Location of Service Industry Web Objects: developing a standard
Leonie Cassidy
College of Business, Law & Governance James Cook University
Cairns, Queensland, Australia Email: [email protected]
John Hamilton
College of Business, Law & Governance James Cook University
Cairns, Queensland, Australia Email: [email protected]
Abstract
In prior research consumers subjectively located various web objects on a 2D grid representation of a homepage. This study applies content analysis with a 3D fine-grid approach (using our 3D Web Objects Visualiser software). It analyses the ‘actual’ placement of twenty-two literature identified homepage web objects within five services-industries website homepages and across ten countries. Regardless of country, several web objects show industry-specific consistency in their ‘actual’ grid placement and a generic placement of five web objects (logo, search, navigation, header, and footer) exists. The method used herein provides management with a simple, cost effective way, to check the placement of web objects on their website homepage against consumer metal positioning models, and allows for easy comparison with competitors.
Keywords
Website, position, compare, content analysis, benchmark
INTRODUCTION
In today’s global economy, websites show increasing importance to the company and to its marketing strategy (Hernandez et al. 2009). Consumers now source globally, often obtaining products, services, or information from beyond their own region or country (Park and Gretzel 2007). Globally, internet use has moved from around 360 million users (December 2000) to over 2.4 billion (June 2012) (Internet World Stats 2013). To tap this large consumer market, Lynch and Horton (2008) suggest company websites should target their consumers’ design expectations and also offer universally usable services.
Over time, website interacting consumers develop perceived expectations concerning the placement, and the location, of common web objects (Roth et al. 2013). These perceived expectations may be viewed as the consumer’s ‘mental positioning model’ (Roth et al. 2010; Shaikh et al. 2006), where consumers predict or infer the position of web objects, and how these contribute to their navigation within the website (Linxen et al. 2014). Baharum and Jaafar (2014) show the consumer mental positioning model operates independent of age, and websites conforming to the consumer mental positioning model are more likely to display a competitive advantage over those who do not conform (Baharum and Jaafar, 2014; Linxen et al. 2014). However, few website content analysis studies (such as those involving the specific location of web objects) have been conducted, and these studies remain limited, focusing on particular types of websites such as agricultural university websites (Suresh and Gopalakrishnan 2012), and library websites (Raju and Harinarayana 2011). Hence, this study seeks to understanding whether there is alignment between existing consumer mental positioning models and the actual placement of specific web objects by business. We employ content analysis and consider the location of twenty-two common web objects across five services industries in each of ten countries, and determine whether a standard website homepage location exists for each of these web objects.
RELATIVE PLACEMENT OF WEB OBJECTS
analysed using grid squares (Table 1) positioning. Roth et al. (2013) employs eye tracking with results grid-mapped and then analysed. Like Shaikh and Lenz (2006), Raju and Harinarayana (2011) use a 5 x5 grid but use it to map their content analysis of library websites. Suresh and Gopalakrishnan (2012) employ a finer 8 x 7 grid (Table 1) in their content analysis of agricultural university websites. Table 1 shows finer grids offer more content placements squares, and so enable more precise positioning of web objects.
Table 1. Studies and Grid Sizes Used
Authors Studies Grid Squares
Di Nocera, Capponi & Ferlazzo 2004 1 4x4 16
Shaikh, Chaparro & Joshi 2006; Shaikh & Lenz 2006; Raju & Harinarayana 2011 3 5x5 25
Bernard & Sheshadri 2004 1 7x6 42
Baharum & Jaafar 2014 1 7x6 (3x3) 42 (9)
Bernard 2001a; 2001b; 2002; 2003; Suresh & Gopalakrishnan 2012 3 8x7 56
Roth et al. 2010; Roth et al. 2013 2 12x8 96
This Study 1 38x21 798
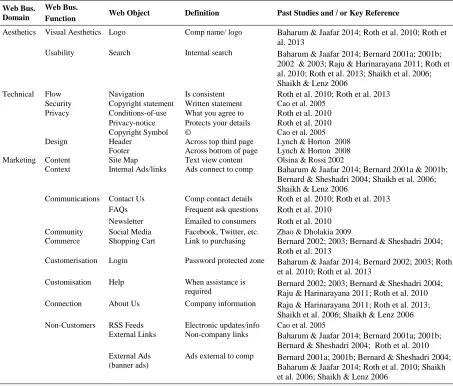
[image:2.595.69.522.343.730.2]Table 1’s differing grid sizes and the inconsistency of web objects (Table 2) investigated make cross study comparisons difficult. Further, there is a lack of consistency of web object selection by the same authors. For example Bernard’s 2001b article considers the advertisement banner web object, but he excludes this from his 2002 and 2003 articles. Also, Roth et al. (2010) list the web object conditions-of-use; however this is not included in the Roth et al. (2013) study.
Table 2. Web Objects and Studies
Web Bus. Domain
Web Bus.
Function Web Object Definition Past Studies and / or Key Reference
Aesthetics Visual Aesthetics Logo Comp name/ logo Baharum & Jaafar 2014; Roth et al. 2010; Roth et al. 2013
Usability Search Internal search Baharum & Jaafar 2014; Bernard 2001a; 2001b;
2002 & 2003; Raju & Harinarayana 2011; Roth et al. 2010; Roth et al. 2013; Shaikh et al. 2006; Shaikh & Lenz 2006
Technical Flow Navigation Is consistent Roth et al. 2010; Roth et al. 2013
Security Copyright statement Written statement Cao et al. 2005
Privacy Conditions-of-use What you agree to Roth et al. 2010
Privacy-notice Protects your details Roth et al. 2010
Copyright Symbol © Cao et al. 2005
Design Header Across top third page Lynch & Horton 2008
Footer Across bottom of page Lynch & Horton 2008
Marketing Content Site Map Text view content Olsina & Rossi 2002
Context Internal Ads/links Ads connect to comp Baharum & Jaafar 2014; Bernard 2001a & 2001b; Bernard & Sheshadri 2004; Shaikh et al. 2006; Shaikh & Lenz 2006
Communications Contact Us Comp contact details Roth et al. 2010; Roth et al. 2013
FAQs Frequent ask questions Roth et al. 2010
Newsletter Emailed to consumers Roth et al. 2010 Community Social Media Facebook, Twitter, etc. Zhao & Dholakia 2009
Commerce Shopping Cart Link to purchasing Bernard 2002; 2003; Bernard & Sheshadri 2004; Roth et al. 2013
Customerisation Login Password protected zone Baharum & Jaafar 2014; Bernard 2002; 2003; Roth et al. 2010; Roth et al. 2013
Customisation Help When assistance is
required Bernard 2002; 2003; Bernard & Sheshadri 2004; Raju & Harinarayana 2011; Roth et al. 2010
Connection About Us Company information Raju & Harinarayana 2011; Roth et al. 2013; Shaikh et al. 2006; Shaikh & Lenz 2006 Non-Customers RSS Feeds Electronic updates/info Cao et al. 2005
External Links Non-company links Baharum & Jaafar 2014; Bernard 2001a; 2001b; Bernard & Sheshadri 2004; Roth et al. 2010 External Ads
(banner ads)
Ads external to comp Bernard 2001a; 2001b; Bernard & Sheshadri 2004; Baharum & Jaafar 2014; Roth et al. 2010; Shaikh et al. 2006; Shaikh & Lenz 2006
Back-to-home
Internal Links
External Links Search
Banners Ads Login/register
Shopping Cart
Help Product Links
Account/ Order
Back-to-home External
Links
Back-to-home
Shopping Cart Search Account/
order
Help Login/register
Product Links
measures such as back-to-home (now replaced by logo) are excluded as logo now serves the same purpose. Archive is not considered, as it only appears in a study by Roth et al. (2010).
The main area (or centre) of the webpage is not considered as it is generally text and image based. As web objects typically reside around the periphery of a webpage we include the header section (generally containing logo and search) and the footer section (generally containing privacy-notice and copyright symbol web objects). Further, website date is excluded as it only appears once (Lynch and Horton 2008), and to-the-top is excluded as only Roth et al. (2010) consider consumer positioning of this web object. Login and shopping cart generally appear on the homepage, but account/order is now normally found on an internal webpage and therefore is excluded. Social media and RSS feeds are included as today they are web objects linked to the consumer’s interactions with the business website. The remaining Table 2 web objects are those considered in this study.
Grid approach deployed
From past empirical studies, we now compare the consumers’ positioning of web objects (according to their mental positioning models) against the actual positioning of web objects (through content analysis) in five services industries across ten countries. We also check, whether over the passage of time, basic web objects remain in the same grid position or location (Lynch and Horton 2008).
These consumer-based studies employ large grid sizes (Table 1) allowing an approximation of a web object’s position. A darker grid square indicates a specific web object occurs more frequently at this grid location (Bernard 2001a; 2001b; 2002; Shaikh and Lenz 2006; Roth et al. 2010). However, the exact location of a web object within the large grid square is not reported in these studies.
In this study, for greater accuracy, we deploy a much smaller grid size. In addition we develop, and deploy, a software program that provides a 3D visual representation of the concentration of each web object at a specific grid position. This 3D Web Objects Visualiser is available to readers at www.adamrehn.com/tools/webobjects/. Here, the position of each web object is gauged against our grid and plotted as an excel grid, converted to a .csv file, and then imported into the 3D Web Objects Visualiser. A 3D graph of the web object’s position is thus produced. This process is also used to overlap and compare the same objects existing on the websites used in this study.
3D web objects visualiser grid comparison
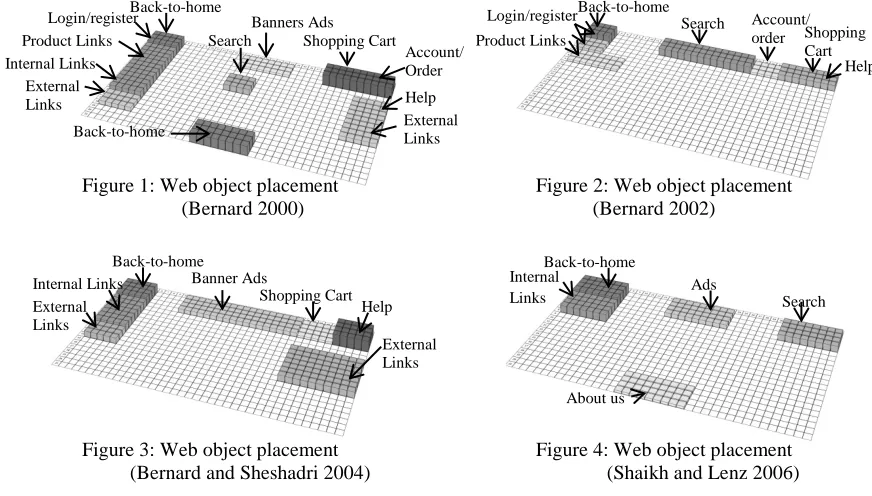
Since 2000 eleven consumer-based and two content analysis studies have placed web objects. For general comparative purposes, we provide visual representation of eight of these studies. These are rescaled into our mapping grid, added to the 3D Web Objects Visualiser, and are shown as Figures 1 to 8. We do not include the remaining five studies as Suresh and Gopalakrishnan (2012) provide scant grid information, Raju and Harinarayana, (2011) and Shaikh et al. (2006) give few general measures, Linxen et al. (2014) only offer an initial study, and Baharum and Jaafar (2014) complex positioning using a double grid.
Figure 1: Web object placement Figure 2: Web object placement
(Bernard 2000) (Bernard 2002)
Figure 3: Web object placement Figure 4: Web object placement (Bernard and Sheshadri 2004) (Shaikh and Lenz 2006)
Ads Back-to-home
Search
About us Internal Links Back-to-home
Shopping Cart Banner Ads
Help Internal Links
External Links
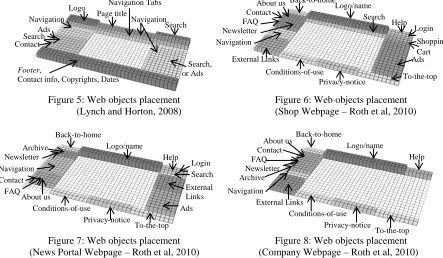
[image:3.595.87.523.529.777.2]Figure 5: Web objects placement Figure 6: Web objects placement (Lynch and Horton, 2008) (Shop Webpage – Roth et al, 2010)
Figure 7: Web objects placement Figure 8: Web objects placement (News Portal Webpage – Roth et al, 2010) (Company Webpage – Roth et al, 2010) After reviewing the placement of web objects in Figures 1 to 8, and Raju and Harinarayana’s (2011) content analysis of web object placement, we propose the following home page hypotheses:
H1: Web objects about us and logo are located upper-left.
H2: Web objects help, shopping cart, login, social media, RSS feeds and search are located upper-right. H3: Web objects contact us; external links, FAQs, navigation, and newsletter are located on the left side. H4: The internal links web object is located on the left or the right side.
H5: Web objects conditions-of-use; copyright notice, copyright symbol, privacy-notice, and site map are located in the footer.
H6: Web objects external ads (banner ads) are located top-middle. H7: The header is the top-third of the webpage.
H8: The footer is the bottom of the webpage.
This study now tests the above hypothesis on the websites from five industries across ten countries.
METHODOLOGY
We apply content analysis across ten countries and five substantive industry websites (tourism, financial, government, postal, and retail). In each country, all five industries have an English language version of their website. Nine are developed countries (Australia, Canada, USA, Hong Kong, Japan, Taiwan, Germany, the UK, and Singapore), each with a GDP (gross domestic product) PPP (purchasing power parity) per capita between $36,000 and $65,000, and an internet penetration above 75% (Internet World Stats, 2013).
India, although a developing country with a GDP PPP per capita of only $4,077.057 (international), is included as the tenth country because their service sector is one of the largest in the world (India Brand Equity Foundation, 2014) accounting for 60% of local GDP. It has 85 million mobile internet users concentrated in urban areas and 25 million users in rural areas (Internet and Mobile Association of India 2014) and has the third highest number of internet users world-wide (Internet World Stats 2013).
Measures
We compare twenty-two web objects of prior studies (Bernard 2000; Bernard and Sheshadri 2004; Cassidy and Hamilton 2011; 2012; Roth et al. 2010). Table 2 links these into their previously defined functions and domains (Boisvert and Caron 2006; Cassidy and Hamilton 2011; 2012), placing each web object into only one function. To allow comparison, some of the past study web objects are consolidated under one name. Logo, for example, represents the company name and/or logo. It provides visual aesthetic appeal, and fits within this website function under the aesthetic domain. Many past studies’ respondents consider the Logo position as an intuitive return-to-homepage link housing a consumer mental positioning model of an embedded, non-visible back-to-home link. Search Logo Page title Navigation Navigation Tabs Search, or Ads Navigation Contact Footer,
This study uses an Acer Aspire 5560G laptop, an AMD A8-3500M APU, and a RadeonTM HD graphics 1.5GHz, and a 64bit operating system. The 15.6 inch HD LED LCD screen resolution is 1366 x 768 and the Google Chrome browser is version 28.0.1500.72m to consistently determine the position of all twenty-two web objects. The study uses ‘point-in-time’ capture of each website’s homepage.
Content Analysis
A 38 (horizontal) x 21 (vertical) grid of 798 positioning squares (each representing 36.5 pixels x 36.5 pixels) allows each small square to remain visually discernible. It is superimposed over each website homepage’s screen capture. The actual position of each web object is then encapsulated (pin-pointed) using this fine grid structure. Any homepage website scrolling is conducted as twenty-one grid row blocks per scroll. Thus, each web object’s positioning results are transferable to an excel spreadsheet, convertible to a .csv file, and then available for 3D Web Objects Visualiser analysis.
The most common location of a web object is represented by how often a specific grid square is used, and whether or not there is consensus across the services industries for all ten countries. The main web objects for each services industry’s website are shown as 3D grid representations (Figures 9 to 13). The darker and the higher is the grid square, the more often this web object is concentrated at this particular location.
RESULTS
[image:5.595.71.527.349.447.2]Our literature research shows no definitive agreement as to why, or where, web objects are located (or as to where they should be located). However, regardless of country, we find some basic web objects such as logo, search, and navigation do show industry-specific consistency in their grid placement.
Table 3. Support for Hypothesis
Hypothesis Financial Government Postal Retail Tourism
H1 Partially Partially Partially Partially Partially
H2 Partially Partially Partially Partially Partially
H3 Not supported Not supported Not supported Partially Not supported
H4 Not supported Not supported Not supported Partially Not supported
H5 Partially Partially Partially Partially Partially
H6 Not supported Not supported Not supported Not supported Not supported
H7 Supported Supported Supported Supported Supported
H8 Supported Supported Supported Supported Supported
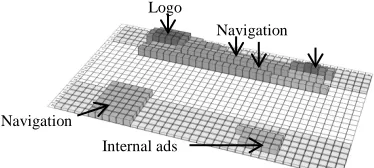
As per Table 3, H1 is partially supported with the web object logo located in the upper-left of website homepages across all five industries (Figures 9 to 13). However, the web object about us (and when present) varies across industries. H2 is also partially supported with the web object search located upper-right on finance, government, postal, and tourism website homepages (Figures 9, 10, 11 and 13). The retail website homepage (Figure 12) has search moved towards the middle (away from upper-right) to make room for web objects shopping cart and login. Social media, RSS feed and help (web objects) show no specific location on website homepages either within or across industries. H3 is partially supported with some navigation on the left side of retail industry homepages (Figure 12). When present on a website homepage, contact us is generally in the footer, while external links, FAQs, and newsletter have no specific location. The retail industry website homepages (Figure 12) provide partial support for H4 with internal links present on the right side of a website homepage (but not the left). H5 is partially supported across all industries. Here, when present, conditions-of-use, copyright symbol, privacy-notice and site map are located in the footer, however copyright notice has no specific location. H6 is not supported with external ads having no specific location across industry websites. H7 is supported across industries. H8 is supported across industries, however it should be noted the size of the footer does vary.
Figure 9: Financial websites Figure 10: Government website
Search Logo
Navigation
Search Logo
Navigation
[image:5.595.289.476.652.736.2]Figure 11: Postal websites Figure 12: Retail websites
Figure 13: Tourism websites
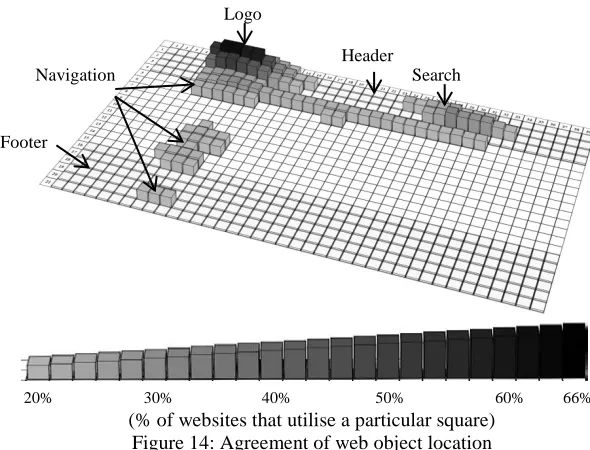
This study demonstrates that in the ‘real world’ web object placement is subjective, complex and/or often limited. However, from our five services industries websites (Figures 9 to 13) across ten countries we propose generic locations for several web objects (Figure 14).
The header covers approximately the top one-third of the webpage. Within the header the upper-left is the favoured placement for logo and upper-right for search. Main navigation is placed below the logo typically stretching horizontally across the page (to under search). Secondary navigation is in three distinct vertical positions on the left of the webpage.
Retail websites are different to the other services industries as they typically possess a shopping cart and login (both located to the right of the search web object).
(% of websites that utilise a particular square) Figure 14: Agreement of web object location
Regardless of scrolling the footer sits lowest and across the base of the webpage. When present, conditions-of-use, privacy-notice, copyright symbol, site map, and contact us are located within the footer. Here, object placement varies across websites regardless of services industry or country.
A cluster of web objects show no specific placement or consistency-of-occurrence on a webpage, these can include: social media, help, about us, RSS feeds, FAQ links, newsletter, external advertising, and the copyright statement.
Search Logo
Navigation
Internal Ads
Navigation
Search Logo
Login Navigation
Internal Ads Shopping Cart
Search Logo
Navigation
Privacy Copyright Symbol
20% 30% 40% 50% 60% 66%
Search Logo
Navigation
Header
[image:6.595.142.437.460.685.2]IMPLICATIONS
Theoretical implications
The homepage is the introductory view of the website. Bernard (2001a; 2001b; 2002), Bernard and Sheshadri (2004), Roth et al. (2010), Roth et al. (2013), and Shaikh and Lenz (2006) use grid mapping to identify homepage placement of web objects, but do so through consumer perspective studies. Others, go further and use between 99 and 150 web objects spread across entire websites (Olsina and Rossi 2002; Stepchenkova et al. 2010) to assess consumer perspectives. This study extends such studies by comparing the actual fine placement of web objects by the business against past consumer predictive perspectives of where such web objects should be found. The study is further extended by comparing five services industries across ten countries. This study establishes a grid mapping approach that can now be used to align the business’ provided web objects against consumer predicted perspectives.
Websites can been studied in fine detail using a three domain perspective (marketing, technical and aesthetics), with each domain further segmented into its unique set of functions, and with each function made up of its own unique set of like objects. (Vilenkin 1986; Boisvert and Caron 2006; Cassidy and Hamilton 2011; 2012) For example a marketing domain’s community function houses social network communication objects such as Facebook, Tumblr and Twitter. Thus a three level approach to collating web objects offers new scope for theoretical associative research.
In this homepage and services industries study, each of the 22 web objects deployed belongs to only one function within only one domain. This approach offers a quick way to consider whether the website’s coverage is effective.
Table 2 compares web objects from past service industries studies with this study’s web objects. With only 22 web objects (one per function) we suggest beyond the marketing domain, homepage coverage within the technical and aesthetic domains remains weak. This three domain grid mapping approach to understanding website homepages remains an investigative opportunity for future theoretical research.
Practical implications
Today services industries business-to-consumer website homepages show improvement across many areas. However, with their increasing global reach, managers and/or designers of these websites should give consideration to consumer mental positioning models (or perceived expectations) of web objects.
When a website shows inconsistency in its web object placement for this services industry, then the website may not align with its consumer groups’ mental positioning models (Lynch and Horton 2008; Shaikh et al. 2006) – resulting in the consumers’ early abandonment of this website.
To determine any alignment between web object positioning on websites and consumer mental positioning models we conducted a content analysis across five industries from ten countries. Our results confirm there is no consistency for web object placement between services industries. However, there is some consistency within industry-specific websites.
The development of a standard websites homepage position for each web object per service industry helps alleviate consumer frustration, and builds further alignment towards their personal mental positioning models. Thus, managers and/or designers of services websites should look globally within their services industry and across other services industries, and apply the grid mapping approach developed in this study to determine the most common (or standard) position of each of their homepage web objects.
When a standard placement of web objects is achieved through grid mapping, consumer interactions with this website improves, particularly if the consumers’ mental positioning models adjust towards their expectations of what is to be fulfilled (Roth et al. 2010; Shaikh et al. 2006). As a guide to standard positioning of a web object, managers and/or designers can follow Nielsen’s (1999) ‘rule’ which states - when more than 80% of websites (from a particular segment) place a web object in one position, this is considered the defacto standard.
FUTURE RESEARCH
Measurement aspects
This study’s webpage grid overlay approach facilitates comparison of web objects regardless of page scrolling. It captures presence and placement of web objects (across marketing, aesthetic and technical domains) from top to the bottom of the page – even if the footer is two or more scrolls further down.
The software deployed herein involves a time-consuming manual preparation of the web object placement input data. Grid placement measures are recorded as an excel spreadsheet and then imported as a .csv file into the 3D Web Objects Visualiser.
Version 2 of this 3D Web Objects Visualiser software is under development, and is to be a commercial package. Version 2 pastes a grid overlay across each website page and allows for a paint-over measurement of a web object. Each recorded web object is data warehoused, and then directly-imported, and graphically-displayed, under the 3D Web Objects Visualiser. Hence, website pages and/or web object data is made available for business intelligence studies involving the establishment web object placement standards (in various industry-specific or country-industry-specific studies), including the comparative benchmarking of web object placement and/or presence. Thu the 3D Web Objects Visualiser software approach offers researchers and managers a visual and comparative website benchmarking tool.
Theoretical aspects
Our grid mapping of web objects and the determination of their relative placement is a comparative benchmarking approach. To date there is no measurement or benchmarking system that can capture or position all available web objects. Our fine grid mapping, although cumbersome for large websites and unable to capture all aesthetic and all technical measures does delivers a visual assessment of the website. This study’s approach does show the business homepage web objects can be aligned to its consumers’ mental positioning models concerning their perceived location of each of these homepage web objects.
This fine grid mapping approach and its complementary 3D Web Objects Visualiser software is part of the practical approach to automating the measuring and comparison of websites. This study’s contribution is a part of the development of a general website benchmarking solution. To date a full theory of website benchmarking is yet to be established.
Research to build the additional tools that complement (and further automate) our grid mapping approach and research to measure non-grid-captured web objects such as the use of cascading style sheets, download speed, or image resolutions, has the capability to deliver a useful comparative benchmarking tool for industry. Such research moves the understanding of web object placement beyond that of consumer (or website developer) perception, and into the domain of comparative actuality.
Management aspects
The 3D Web Objects Visualiser (available at www.adamrehn.com/tools/webobjects/) offers a cheap approach from which business researchers can now check for homepage web object presence and relative placement, and can then compare and benchmark the homepage against other website homepages of interest.
As websites change regularly, and homepages are their most viewed pages, researchers using the approach herein can regularly monitor and compare chosen website homepages against competitors or others in the same industrial sector. Thus over time, the competitor’s web object changes can be intelligently interpreted as a priorities list (rating the importance of web object measures on websites). This area remains an important area for ongoing research and explanation as it can provide a basic map from which researchers and managers can re-assess their homepage’s relative competitiveness.
Further, where many web homepages are compared, patterns for web object location across countries and/or languages may emerge. Here, consumer mental positioning model studies and business homepage web object positioning can be conducted concurrently. This allows point-in-time comparisons between each actual web object’s placement, and the actual consumer perceptions of the expected location of each web object. Further, this type of comparative study can also be run between countries, and across languages.
CONCLUSION
against this services sector’s competitors. Such studies can also be used to compare differences between selected countries.
When designing websites for global reach, services industries managers and/or designers should ensure they incorporate all web objects that show widely-agreed and consistent home page positioning as indicated in Figures 9 to 14.
Compared to past 2D research models, our 3D Web Objects Visualiser software extends the comparative interpretability of multi-site graphical webpage overlays. Extension to this software (with automated data capture, intelligent display processes, and defacto 80% placement position comparisons) is currently under development into a commercial tool.
Within the services sector and countries studied, a basic defacto 80% standard homepage placement layout (Figure 14) exists for just five of the twenty-two web objects studied. These five web objects fit within only four of the nineteen aesthetic and IT functions. This indicates that across the services sector marketing plus many of the aesthetic and IT functions of Table 1 exhibit inconsistent placement of the web objects within a generalized industry website. Utilising tools such as the 3D Web Objects Visualiser, conducting comparison studies between websites, and running consumer mental positioning models studies allows the build of a database that is then capable of further homepage (or website) web object placement, measurement, and optimisation. We note except for H6 all other hypotheses are either fully or partially supported.
Within specific services industries (Figures 9 to 13) the logo, header, search, and navigation web objects are prominently top-of-page positioned on the homepage as they provide the basic operational connections into other sections of the website. For retail websites that ‘sell items’, the shopping-cart, and login, web objects are also placed top-of-page. The bottom footer typically offers less important but required information about the website and its obligations, and it sometimes includes external links to other affiliated websites.
REFERENCES
Baharum, A., and Jaafar, A. 2014. “Generation Y Expectations for the Location of Web Objects,” International Journal of Digital Content Technology and its Applications (8:2), April, pp 81-89.
Bernard, M. 2001a. “User Expectations for the Location of Web Objects,” Conference on Human Factors in Computing Systems: CHI ’01 Extended Abstracts on Human Factors in Computing Systems (31), March, pp 171-172.
Bernard, M. 2001b. “Developing Schemas for the Location of Common Web Objects,” Proceedings of the Human Factors and Ergonomics Society Annual Meeting (45), October, pp 1161-1165.
Bernard, M. 2002. “Criteria for Optimal Web Design (Designing for Usability),” Retrieved 15 July, 2012, from http://psychology.wichita.edu/optimal/structure.htm
Bernard, M. 2003. “Examining User Expectations for the Location of Common e-Commerce Web Objects,” Proceedings of the Human Factors and Ergonomics Society Annual Meeting (47), October, pp 1356-1360. Bernard, M., and Sheshadri, A. 2004. “Preliminary Examination of Global Expectations of Users' Mental
Models for e-Commerce Web Layouts,” Usability News (6:2), July, pp 1-9.
Boisvert, H., and Caron, M. 2006. “Benchmarking web site functions,” Benchmarking: An International Journal (13:1/2), pp 174-189.
Cao, M., Zhang, Q., and Seydel, J. 2005. “B2C e-Commerce Web Site Quality: An Empirical Examination,” Industrial Management and Data Systems (105:5), September, pp 645-661.
Cassidy, L., and Hamilton, J. 2011. “Website Benchmarking: Evaluating Scaled and Dichotomous Approaches,” 11th International Conference of Electronic Business, November, pp 408-412.
Cassidy L., and Hamilton J. 2012. “Multi-level Website Benchmarking: Typological Collation of Recent Approaches,” 26th Australian and New Zealand Academy of Management Conference: Managing for Volatility and Instability, December, pp1-19.
Di Nocera, F., Capponi, C., and Ferlazzo, F. 2004. “Finding Geometrical Associations Between Meaningful Objects in the Web: A Geostatistical Approach,” PsychNology Journal (2:1), pp 84-98.
India Brand Equity Foundation. 2014. “Service Sector in India”. Retrieved 10 June, 2014, from www.ibef.org/industry/services.aspx.
Internet and Mobile Association of India. 2014. “India to have 155Mn Mobile Internet Users by March ’14.” Retrieved 16 May, 2014, from www.iamai.in/PRelease_detail.aspx?nid=3240&NMonth=1&NYear=2014. Internet World Stats. 2013. “World Internet Usage.” Retrieved 12 May, 2014, from
http://www.internetworldstats.com, copyright 2001-2013 Miniwatts Marketing Group.
Linxen, S., Heinz, S., Muller, L.J., Tuch, A.N., and Opwis, K. 2014. “Mental Models for Web Objects in Different Cultural Settings,” CHI'14 Extended Abstracts on Human Factors in Computing Systems, April, pp. 2557-2562.
Lynch, P.J., and Horton, S. 2008. Web Style Guide (3rd Ed.). Kendaville, Indiana: Yale University.
Nielsen, J. 1999. “When Bad Design Elements Become the Standard.” Retrieved 18 June, 2013, from http://www.nngroup.com/articles/when-bad-design-elements-become-the-standard/.
Olsina, L., and Rossi, G. 2002. “Measuring Web Application Quality with WebQEM,” Multimedia IEEE (9:4), October-December, pp 20-29.
Park, Y.A., and Gretzel, U. 2007. “Success Factors for Destination Marketing Web Sites: a Qualitative Meta-analysis,” Journal of Travel Research (46:1), August, pp 46-63.
Raju, N.V., and Harinarayana, N.S. 2011. “Identifying the Location of Web Objects: a Study of Library Web Sites,” 8th International CALIBER, March, pp 28-39.
Roth, S.P., Schmutz, P., Pauwels, S.L., Bargas-Avila, J.A., and Opwis, K. 2010. “Mental Models for Web Objects: Where Do Users Expect to Find the Most Frequent Objects in Online Shops, News Portals, and Company Web Pages?” Interacting with Computers (22:2), March, pp 140-152.
Roth, S.P., Tuch, A.N., Mekler, E.D., Bargas-Avila, J.A., and Opwis, K. 2013. “Location Matters, Especially for Non-salient Features - An Eye-tracking Study on the Effects of Web Object Placement on Different Types of Websites,” International Journal of Human-Computer Studies (71:3), March, pp 228-235.
Shaikh, A.D., Chaparro, B.S., and Joshi, A. 2006. “Indian Users' Expectations for the Location of Web Objects on Informational Websites,” Proceedings of the Human Factors and Ergonomics Society Annual Meeting, October, pp 1922-1926.
Shaikh, A.D., and Lenz, K. 2006. “Where's the search? Re-examining User Expectations of Web Objects,” Usability News (8:1), February, pp 1-5.
Stepchenkova, S., Tang, L., Jang, S., Kirilenko, A.P., and Morrison, A.M. 2010. “Benchmarking CVB Website Performance: Spatial and Structural Patterns,” Tourism Management (31:5), October, pp 611-620.
Suresh, K., and Gopalakrishnan, S. 2012. “Content Organization in Websites of Agricultural Universities in India: a Web Analytic Study,” Library Philosophy and Practice (e-journal). Retrieved 25 September, 2014, from http://digitalcommons.unl.edu/libphilprac/817.
Vilenkin, N.Y. 1986. Stories about Sets. New York, NY: Academic Press.
Zhao, M., and Dholakia, R.R. 2009. “A Multi-attribute Model of Web Site Interactivity and Customer Satisfaction,” Managing Service Quarterly (19:3), pp 286-307.
ACKNOWLEDGEMENTS
The authors acknowledge the 3D Web Objects Visualiser software development provided by Adam Rehn (IT PhD candidate, JCU Cairns campus). Version 1 of this software is available at http://adamrehn.com/tools/webobjects/.