This content has been downloaded from IOPscience. Please scroll down to see the full text.
Download details:
IP Address: 139.86.2.14
This content was downloaded on 07/03/2014 at 05:55
Please note that terms and conditions apply.
Geospatial database for heritage building conservation
View the table of contents for this issue, or go to the journal homepage for more 2014 IOP Conf. Ser.: Earth Environ. Sci. 18 012087
Geospatial database for heritage building conservation
W N F W A Basir1,3, H Setan1, Z Majid1, A Chong2
1 Photogrammetry and Laser Scanning Research Group, FGRE, Universiti Teknologi
Malaysia, Johor, Malaysia
2 University of Southern Queensland, Queensland, Australia
Email: [email protected]
Abstract. Heritage buildings are icons from the past that exist in present time. Through heritage architecture, we can learn about economic issues and social activities of the past. Nowadays, heritage buildings are under threat from natural disaster, uncertain weather, pollution and others. In order to preserve this heritage for the future generation, recording and documenting of heritage buildings are required. With the development of information system and data collection technique, it is possible to create a 3D digital model. This 3D information plays an important role in recording and documenting heritage buildings. 3D modeling and virtual reality techniques have demonstrated the ability to visualize the real world in 3D. It can provide a better platform for communication and understanding of heritage building. Combining 3D modelling with technology of Geographic Information System (GIS) will create a database that can make various analyses about spatial data in the form of a 3D model. Objectives of this research are to determine the reliability of Terrestrial Laser Scanning (TLS) technique for data acquisition of heritage building and to develop a geospatial database for heritage building conservation purposes. The result from data acquisition will become a guideline for 3D model development. This 3D model will be exported to the GIS format in order to develop a database for heritage building conservation. In this database, requirements for heritage building conservation process are included. Through this research, a proper database for storing and documenting of the heritage building conservation data will be developed.
1. Introduction
Recording and documenting heritage buildings are important in preserving information for future generations to learn about the past. Architecture from heritage building represents a result of the interaction between different cultures throughout history such as the social values, political strategies, economic situations, and behaviours of a particular time. Recording and documenting heritage buildings are important because these cultural properties also are threatened by risks such as destruction, wreathing and hasty and inadequate repair and restoration brought about by tourism promotion policies. This cultural property can become an important asset to country because it can be one of the elements that can be used as attraction for tourism.
There are many methods that are used in recording and documenting process of heritage buildings such as using surveying technique, digital photogrammetry technique (can produce high resolution textured 3D model based on their pictures), and the latest technology is active sensor – laser scanning (can create high resolution geometric model in 3D point cloud). During the generation of 3D models, requirements such as high geometric accuracy, availability of all details, and efficiency in the model size and photo practicality have to be met by the different approaches used for data collection [1]. One well-accepted technique frequently applied in the context of heritage site documentation is close range photogrammetry [2,3] and laser scanning. Furthermore, laser scanning has become a standard tool for
3 To whom any correspondence should be addressed.
3D data collection for the generation of high quality 3D models of cultural heritage sites and historical buildings [4].
To record a unique detailed of historical and archaeological sites digitally and more accurately, the most practical and effective approach is to combine 3D laser scanning and digital photogrammetry [1]. This integration (laser scanning and digital camera) helps to improve the geometry and visual quality of the collected 3D model. During data collection the information on edges and linear surface features like cracks is based on the analysis of the images, whereas information on object geometry is provided from the laser data. Additionally, areas which are not reachable in the laser scanner data due to occlusions are added based on semiautomatic evaluation of the imagery. By these means, a complete 3D features for the scene can be generated with sufficient and clear details.
Computers provide us easier and faster storing, retrieving, and sorting information capabilities than traditional tools. By constructing a 3D model of a building, we are actually making a digital database of the building. Documentation must be able not only to qualify the geometric and formal characters of these architectures, but also to detect and to end up evaluating and present damages at the heritage buildings.
Nowadays, to solve with success the requirements mentioned, graphic and alphanumeric database is needed. In addition, the elaboration of some architectural surveying, the techniques based on the use of the Laser Scanning and the Geographical Information System allow us not only to edit some plans with graphic precision and metric accuracy, but also to detect all those structural and constructive degenerations that cause the minimum deformations in the formal state of the building.
Geographic Information System (GIS) is a new technology that joins the computer science advantages with the modern systems of capture of data, so that it allows the integration and the treatment of all type of information of a computer team, in a simple way on the part of any user that requires to work with this information.
The extreme main problem encountered in GIS studies is the lack of required quality data [5]. Good quality spatial data is the most indispensable component of planned database concerning historical assets. This kind of data should be acquired in an appropriate form in data collecting stage and it should be manipulated in carefully designed databases in the stage of data storing [6].
2. Methodology
2.1 Data acquisition
The 3D laser scanning system Leica ScanStation C10 manufactured by Leica Geosystem was applied to capture the exterior and interior of Kota Johor Lama Museum. Leica ScanStation C10 is a high speed 3D laser scanner for detailed measurement and documentation. It gives the advantage in term of high accuracy and long range scanning.
[image:3.595.50.540.594.678.2]This laser scanner is equipped with builds in digital camera which can be used for scan management or planning and is automatically aligned with the scans texture the point clouds. Due to its intuitive control concept with touch screen display, the Leica ScanStation C10 is as easy to operate as a digital camera.
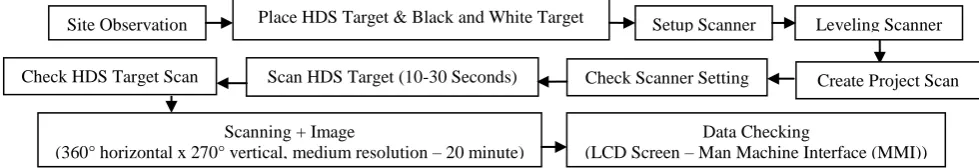
Figure 1. Procedure of Data Acquisition.
Before data acquisition, a site observation is first conducted to obtain the suitable location to place the scanner and the target. Figure 1 shows the data acquisition procedure for this research. Basic thing that must be done before data capture process is setup and also levelling the scanner. All data were recorded during this process were stored in the interior memory scanner. The approach of data
Site Observation
Create Project Scan Check Scanner Setting
Scan HDS Target (10-30 Seconds) Check HDS Target Scan
Scanning + Image
(360° horizontal x 270° vertical, medium resolution – 20 minute)
Data Checking
(LCD Screen – Man Machine Interface (MMI))
Place HDS Target & Black and White Target Setup Scanner Leveling Scanner
IOP Conf. Series: Earth and Environmental Science18(2014) 012087 doi:10.1088/1755-1315/18/1/012087
collection that been applied by Leica ScanStation C10 begins by capturing the point cloud of the building model and then followed by capturing the image.
To record the whole building structure of Kota Johor Lama Museum, there are twelve (12) scan station need to be carried out. In doing this scanning, the target location must be place at a critical location because to combine the scan stations, there must be at least three (3) common targets that can be seen from the other scan stations. This requirement is needed to smooth the post processing work especially in the registration process. Besides, the numbers of the scan station also depends on the size and the complexity of the building structure.
2.2 Data processing
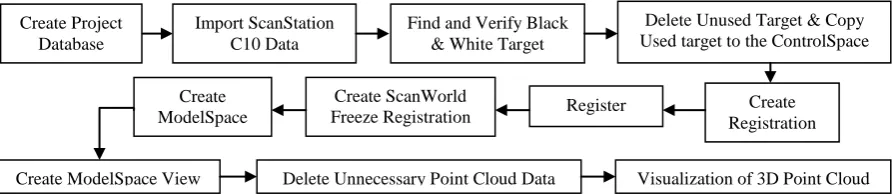
[image:4.595.76.524.352.449.2]Figure 2 below show the point cloud data processing work flow. This stage started with the basic tasks such as creating database project and imports the ScanStation C10 Data. In this stage, point cloud data was checked and unnecessary point cloud will be deleted from database. Before the registration, the black and white targets need to verify the quality of the target. If the quality of target used is not good enough, the errors in registration process will become bigger. In this research, there are 12 scan stations that have been registered to cover the whole Kota Johor Lama Museum. From this 12 scan station, there are seven (7) scan stations at the exterior building and five (5) scan stations in the interior of the building. All the scan stations have to register in one coordinate system to complete the visualization model of Kota Johor Lama Museum. After the registration, data filtering process was carried out to remove the unnecessary point cloud that block the building.
Figure 2. Data Processing Work Flow.
2.2.1.Registration. Registration is the process of combining a project's ScanWorlds into a single coordinate system as a registered ScanWorld. This integration needs pairs of equivalent tie-points or overlapping point cloud that exist in two ScanWorld. The function of Cyclone software was used to register the point cloud data (12 scan stations, around 172 million points) and produce a 3D visualization model. In this registration process, function of Auto-Add Constraints has been used. By using this function, Cyclone will find all ScanWorlds' ControlSpace for objects with the same registration labels and it will be automatically pairs. The errors of the registration will be shown in Constraints tab menu. After the registration process success, this registration needs to be in freeze registration mode. This mode will not allow any further manipulation of the data that have been registered. After that, the ModelSpace must be carried out to view the combination of all scan stations that have been registered in one coordinate system. Once the ModelSpace was created, complete 3D model of Kota Johor Lama Museum was loaded. In this project, the result from registration process had 0.002 error value and this value is considered as acceptable.
2.3 3D model development
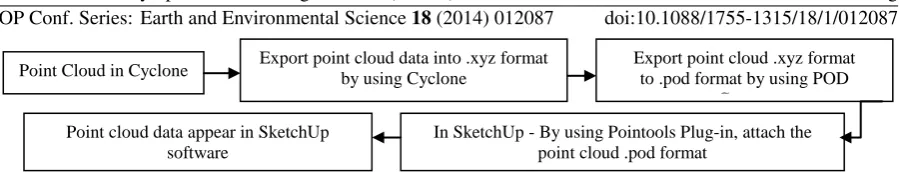
After the registration process is carried out, the next process is the development of 3D models of Kota Johor Lama Museum. 3D building model of the museum has been developed by using SketchUp software based on the point cloud which has been registered in the Cyclone software. SketchUp software has been chosen to generate 3D model because this software provide tools to create simple 3D model to complex 3D model. To enable the cloud point read in SketchUp format, Pointools Plug-in for SketchUp has been used. Figure 3 show the flow of convertPlug-ing poPlug-int cloud data to the format that can be read in SketchUp.
Create Project Database
Import ScanStation C10 Data
Find and Verify Black & White Target
Delete Unused Target & Copy Used target to the ControlSpace
Create Registration Register
Create ScanWorld Freeze Registration Create
ModelSpace
Create ModelSpace View Delete Unnecessary Point Cloud Data Visualization of 3D Point Cloud
Figure 3. Flow of Converting Point Cloud Data Format.
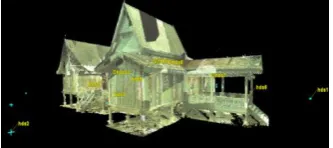
[image:5.595.144.323.248.330.2]Each point data in the point cloud become a guideline for the construction of 3D model includes height, roof, walls, heritage design and others. Figure 4 show the example of point cloud that been added into SketchUp.
Figure 4. Point Cloud in SketchUp.
To model the museum, the main function that has been used is drawing Line With Point Snap. It can be used to snap any point in the point cloud to generate the base face model of the building. After the face of the building was design, the function of Push/pull tool in SketchUp was used to extrude the shape and the Line tool was used to add the detail of the building. Figure 5 show some 3D model development process.
Figure 5. Some Example of 3D Model Development Process.
2.4 Database design and development
Process of database design is one of the methods that require time, research and a complete reference in order to develop a database that can carry out the useful application to fulfil the requirement of user. Ability to design databases and related applications is something that is very important for the success of a department.
Database design requires a good understanding of the operational and management needs of the organization and the ability to model and realize the need of using the database. Database design is the information system planning activity where the contents of the intended database are identified and described. Database design is usually divided into three major activities [7]:
1) Conceptual data modelling: identify data content and describe data at an abstract, or conceptual, level;
2) Logical database design: translation of the conceptual database design into the data model of a specific software system; and
3) Physical design: representation of the data model in the schema of the software.
Database development involves activities that have been designed in the database design stage. It comprised of the processing and data entry into the database. Database platform that used in this project is ArcGIS 10. Figure 6 show the work flow of exporting 3D data from SketchUp to ArcGIS.
Point Cloud in Cyclone Export point cloud data into .xyz format by using Cyclone Export point cloud .xyz format to .pod format by using POD
Creator
In SketchUp - By using Pointools Plug-in, attach the point cloud .pod format
Point cloud data appear in SketchUp software
IOP Conf. Series: Earth and Environmental Science18(2014) 012087 doi:10.1088/1755-1315/18/1/012087
Figure 6. Work Flow of Exporting 3D.
3. Results
3.1 3D point cloud
[image:6.595.205.372.271.345.2]The complete 3D coloured of point cloud was shown in Figure 7. In this research, each of the station scan take approximately 20 minutes to complete. This includes scanning and image capturing and the point cloud data for each scan is around ten (10) millions. The capacity of the point cloud depends on the surroundings.
Figure 7. 3D Coloured Point Cloud of Kota Johor Lama Johor.
In this initial study, medium resolution were selected because it already sufficient to record the details of shape and design of the building. Their result show the heritage design can be seen clearly (Figure 8).
(a) (b)
Figure 8. The Detail Point Cloud Model ((a) Exterior building, (b) Interior building).
3.2 3D model or heritage building
For SketchUp software, the result from the construction of 3D models of Kota Johor Lama Museum is as shown in Figure 9. It can produce a 3D building model along with the heritage design of the building. The building model has the proper structure and size because during generation of 3D building model process, measurement of the height and width is based on measurements that obtained from point cloud model.
(a) (b) (c)
Figure 9. 3D Building Model in SketchUp ((a) Full View 3D model of Museum, (b) and (c) Some Detail of Heritage Design)
3.3 Geospatial database for heritage building
Main objective for this paper is database development for heritage building. In the GIS database that will be developed, it will contain the spatial and attribute data. With the establishment of heritage
3D Data in SketchUp Export 3D data into .dae format In ArcScene – open 3D Analyst Tool
Conversion From File – Importing 3D Files
[image:6.595.160.424.411.490.2] [image:6.595.73.514.601.692.2]building conservation database, various analysis can be performed such as the query of material used, type of architecture, colour and others. When this application is fully developed, users can easily search information and data management is more effective than current application.
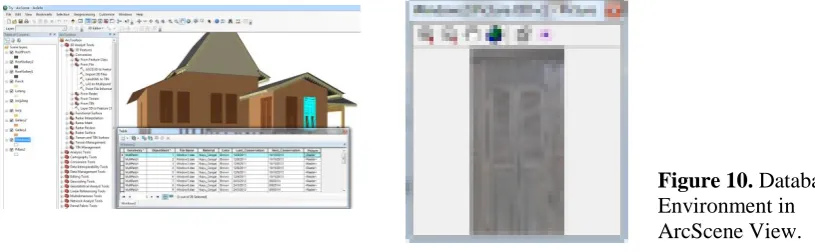
[image:7.595.85.493.190.316.2]In this database will contains building data such as roof, pillars, windows, doors, walls and grill as main attributes to develop the database. Figure 10 shows the database environment in ArcScene View. In this ArcScene, each entity that has been export from SketchUp can be view and this data can be manipulated.
Figure 10. Database Environment in ArcScene View.
4. Conclusion
The word described in this paper was develop as a part of an ongoing research, which aims to underline the necessity to integrate image based and technology of laser scanner in order to optimize the geometric accuracy and the visual quality of 3D data captured for heritage buildings. In our approach for documentation part, Geographic Information System (GIS) be applied to develop database by using the 3D data that captured by technology of image based and laser scanner to perform 3D database. By the combination technology of data collection and data documentation, the database that plan to develop will meet the requirement for heritage applications. In addition, we were seeking a better understanding of managing and integrating architectural and system for heritage recording purposes. This includes exploring new concepts, tools and methods to streamline the digital recording and documentation process.
References
[1] El-Hakim, S., Beraldin, A., Picard, M. 2002 Detailed 3D Reconstruction of Monuments
Using Multiple Techniques. ISPRS/CIPA International Workshop on Scanning for Cultural Heritage Recording, Corfu, Greece 58-64
[2] Gruen, A., Remondino, F., Zhang, L. 2002 Reconstruction of the great Buddha of bamiyan, Afghanistan. International Archives of Photogrammetry and Remote Sensing XXXIV Corfu, Greece 363-368
[3] Debevec, E. 1996 Modeling and Rendering Architecture from Photographs. Ph.D. Thesis, University of California atBerkeley.
[4] Boehler, W., Marbs, A. 2002 3D scanning instruments. ISPRS/CIPA International Workshop on Scanning for Cultural Heritage Recording, Corfu, Greece 9-12
[5] Siebert, L. 2000 Using GIS to Document, Visualize, and Interpret Tokyo’s Spatial History, Social Science History, 24 537-574
[6] Reis, S., Qnan, H.Q., Yomralıoglu, T. 2002 Designing A Regional Geographic Database and Its Application, International Symposium On Geographic Information Systems, Eylül, QTÜ, Qstanbul, Bildiriler CD’si.
[7] El-Hakim S., Whiting E., Gonzo L., Girardi S. 2005 3D reconstruction of complex
architectures from multiple data. 3D Virtual Reconstruction and Visualization of Complex Architectures (3D Arch 2005), Venice-Mestre, Italy.
IOP Conf. Series: Earth and Environmental Science18(2014) 012087 doi:10.1088/1755-1315/18/1/012087