Keep on keeping on: Predicting who will be
able to work until they are 70 years old
Report prepared for the IRT Research Foundation
Professor Deborah Schofielda,b,c, Dr Rupendra Shresthaa, Dr Michelle Cunicha and Dr Emily Callandera,d
aFaculty of Pharmacy, Charles Perkins Centre, The University of Sydney, NSW, 2006, Australia
bMurdoch Children’s Research Institute, Royal Children's Hospital, Flemington Road, Parkville Victoria, 3052, Australia cGarvan Institute of Medical Research, The University of Sydney, NSW, 2006, Australia
dDr Callander is currently employed at the Australian Institute of Tropical Health and Medicine, James Cook University, Queensland, Australia
Phone: +61 2 8627 1951 Fax: +61 2 8627 0141
Email: [email protected]
1 Executive Summary
The Federal Government announced in its 2015 budget that, in addition to increasing the age of eligibility for the Age Pension to 67 years by 2023, it plans to further increase the age of eligibility to 70 years by 2035[1]. The economic drivers for this policy were emphasised twelve months earlier in the National Commission of Audit Report (2014):
Once the impacts of an ageing population and expected lower growth prospects in the longer term are taken into account a growing fiscal gap will emerge at all levels of government across Australia if current expenditure and revenue policies remain unchanged.… Today we have five people working for every one retired person, by 2050 we will only have 2.7[2].
Justification for increasing the age of eligibility for the Age Pension has centred on increasing longevity and related costs of pension payments and health and aged care. Treasury’s 2015 Intergenerational Report (IGR) highlighted this point, stating: “A greater proportion of the population will be aged 65 and over. The number of Australians in this age group is projected to more than double by 2054-55 compared with today” and thus the Government has also implemented policies to increase the labour force participation of older Australians[3]. However, the capacity of people to work until the age of 70 not only depends on the availability of incentives and employment opportunities but their health capacity to do so. Although the Australian population is living longer, there is evidence that they are not a healthier population (Productivity Commission report on An Ageing Australia, 2014)[4].
We estimated there are 512,700 people aged 65-69 years who will be in the labour force. Of these, 500,600 are projected to be able to keep working until the age of 70 (312,600 in full-time and 188,000 in part-time) and 97,700 who will not be able to work due to their ill-health. We also estimated the effects (and ranking) of the individual’s main chronic condition on their probability of participating in the workforce, where arthritis, back problems and other diseases of the musculoskeletal system were the top three conditions that would keep most people out of the labour force.
2 1. Introduction
Numerous government reports have emphasised the economic impacts of the ageing population (such as health and aged care, pension costs) and thus the need for increased labour force participation (see IGR reports 2002, 2007, 2010, 2015)[3, 6-8]. In his 2011-12 Budget Speech, Treasurer Swan stated: “We believe our economy can't afford to waste a single pair of capable hands”[9] when referring to the need to increase labour force participation because of the likely future impacts on the budget due to the ageing population.
For these reasons, the Federal Government has introduced a number of measures to promote gradual and deferred retirement[10], including measures to encourage older workers to keep working[11]. Furthermore, the Government announced in its 2014 budget that, in addition to increasing the Age Pension eligibility to 67 years by 2023, it plans to further increase the age of eligibility to 70 years by 2035[1]. However, there is a lack of evidence about just how many people aged 65-69 years will have the health capacity to continue working into older age. This is important to quantify because the Government is relying on such measures to ensure its budget (and thus service provision) is sustainable in the future, and yet, ill-health is a major barrier to work. Just over 25% of men and 21% of women aged 45 years and older who retired from full-time employment in 2012-13 reported doing so because of ‘their own sickness, injury or disability’[12].
1.1. Why Australia needs to increase the labour force participation of older people
Increasing the labour force participation rate of people aged 65 or older is important for two reasons. One is that life expectancy (longevity) has increased by around 13 years for men (from 67 to 80 years) and 10 years for women (from 74 to 84 years) in Australia in the last 50 years[13]. In fact, in 1960, about one third of men did not live to the age of 65 years[14], and in 1909, when the Age Pension was first introduced, the life expectancy of men at birth was 55 years, which had the effect of making it accessible only to a small proportion of the population[2]. The 2015 Intergenerational Report projects that life expectancy at birth will be 95.1 years for men and 96.6 years for women by 2055. Additionally, that there will be around 40,000 people aged over 100 years, which is well over three hundred times the number of centenarians in 1975[3]. The President of the Actuaries Institute recently claimed that “it is quite conceivable that in the coming years half of all healthy 65 year olds will live past 100”[15]. Thus the Age Pension will need to support Australians for a much longer period of retirement and it was for this reason that the Productivity Commission’s report, called An Ageing Australia, recommended that “growing longevity should be considered for the whole retirement income system (p15)[4].” The second is that there is projected to be 73% growth in the population aged 65-70 years over the period from 2010 to 2035, which is far greater than any other working-age group and more than double the rate of growth of any of the age groups under the age of 40. Thus this potential large source of labour supply cannot be ignored and the Government has already begun implementing measures for encouraging people in this age group to stay in the labour force.
3
Growth Age group
20-24 25-29 30-34 35-39 40-44 45-49 50-54 55-59 60-64 65-69
Population
at 2010 1,642,263 1,657,438 1,528,993 1,616,023 1,549,610 1,575,858 1,467,896 1,325,205 1,211,191 908,177
Population
at 2035 1,977,149 2,075,030 2,051,244 2,127,339 2,211,036 2,195,546 2,034,347 1,770,866 1,742,362 1,566,819
Growth in
Population 334,886 417,592 522,251 511,316 661,426 619,688 566,451 445,661 531,171 658,642
% for age
group 20% 25% 34% 32% 43% 39% 39% 34% 44% 73%
% of total
growth 6% 8% 10% 10% 13% 12% 11% 8% 10% 13%
Source: Population projections provided by Treasury
1.2. The health capacity of people aged 65 years and older to remain in the labour force
While there is pressure for older Australians to work longer (and thus reduce the number of years they draw the Age Pension), the work capacity of people to do so depends on their health. The interplay between health and work capacities has not been addressed by either the IGRs (2002, 2007, 2010, 2015) or the National Commission of Audit (2014). Consequently, although the Government may be implementing policies to achieve favourable future budgets, the premise on which these policies are based – i.e. that a longer living population can naturally work longer too[3, 4, 16, 17] – is problematic because it does not take into account the limitations of poor health on work capacity.
4 1.3. Impacts of ill-health on older workers
We have estimated that there were 347,000 lost productive life years (PLYs) due to ill-health for the population aged 45-64 years in 2010, which is projected to increase to 459,000 by 2030 (32.3% increase over 20 years)[19]. The leading chronic conditions associated with early exits from the workforce are back problems, arthritis and mental and behavioural problems at both time-points. The percentage increase in the number of PLYs lost by those aged 45–64 years was greater than that of population growth for the entire age group (32.3% versus 27.8%). The strongest driver of the increase in lost PLYs was population growth (accounting for 89.2% of the increase), followed by chronic condition trends (8.3%)[19]. We have also estimated that a further 137,000 carers of the same age are out of the labour force and caring for someone with a long-term condition or disability[20]. Both groups being out of the labour force has resulted in a significant increase in the costs of welfare payments and lost taxation revenue for the Government (see, for 2009 estimates, [21, 22]). Consequently, the policy settings that rely on Australians working up to the age of 70 in order to achieve the savings sought by the 2014 National Commission of Audit[2] may be unachievable, and risk putting more pressure on sick, older Australians and jeopardise the country’s fiscal security.
2. Aims
This project will determine who is likely to be able to keep working until the age of 70 and who is not. Specific aims are:
• To estimate the number of people aged 65-69 with work capacity
• To estimate the number of people aged 65-69 who are likely to be working
• To estimate the number of people aged 65-69 who are likely to be in full-time employment and part-time employment
• To estimate the number of people aged 65-69 who are likely to be unable to work due to their own ill-health
• To determine the main health conditions (long-term) that have the greatest impact on the labour force participation of people aged 65-69 years.
3. Approach
In this project, we will estimate the number of people likely to be able to keep working until the age of 70 and those who are not able to continue working.
3.1. Data
5 accommodation[24]. These nationally representative (Australian) household survey data provide information on demographic variables (such as age, sex, family type), socioeconomic variables (such as level of education, income, home ownership, and receipt of welfare payments), labour force variables (such as labour force participation, employment restrictions, and main reason for retirement), and health and disability (such as chronic conditions, health status, type and extent of disability, support and care required) for each individual in the household.
The main reason for drawing on the SDACs for the base population is that they provide the type of information on individuals that will enable us to model the impacts of specific illnesses (and disability) on labour market behaviour (e.g. whether in the labour force or not, and hours of work, and reasons for early retirement). To increase the number of unit records (and sample rarer populations), the unit records from the two SDACs 2009 and 2012 were concatenated. Both surveys have used similar sampling methods and the contents relevant to this study are comparable across both surveys, making it possible to concatenate the two datasets after reweighting the 2009 and 2012 data to 2015 (reference year).
From the combined data, the individual records of the population aged 45-69 years were extracted.
3.2. Reweighting
Both SDACs (2009 and 2012) are weighted by the ABS to address the problem of unequal probability of individual selection in the surveys, and to ensure the survey data are a true representation of the Australian population in the survey year[24]. A survey weight designed to take into account the individual’s probability of selection, as well as clustering and stratification of the sample, is assigned to each record in the dataset. This weight reflects the number of people with similar characteristics in the Australian population at the particular survey year. Starting with these sample weights, we further reweighted the SDACs 2009 and 2012 to reflect the profile of the subsample aged 45-69 years in 2015 using a generalised regression reweighting algorithm programmed in a SAS (a statistical software package) macro called GREGWT. This macro was developed by the ABS and is commonly used to reweight their survey data[27]; see, for a mathematical description of GREGWT, Singh and Mohl (1996)[28] and Tanton et al (2011)[29]). Briefly, the reweighting algorithm GREGWT uses generalised regression models to modify initial survey weights so that the weighted totals match the externally provided totals known as benchmarks[27].
Population and labour force projections for 2015 from the Commonwealth Treasury were used as benchmarks for population and labour force growth in Australians aged 45-69 years. The following projected populations were used as benchmarks:
• Population by age group, sex
6 To address socioeconomic changes in the subsample of Australians aged 45-69 years, benchmark datasets were based on outputs from a long-standing microsimulation model, called Australian Population and Policy Simulation Model or APPSIM[30], for 2015. The following three populations were used as benchmark populations during reweighting. Benchmark populations were derived by applying distributions from APPSIM datasets to the Treasury population projections.
• Population by age group, sex and highest level of education • Population by income unit type
• Population by age group, sex and whether or not owns a home
3.3. Labour Force Participation and Chronic Disease
In the SDACs 2009 and 2012, respondents were asked to nominate their current labour force status as either: • Employed working full-time
• Employed working part-time
• Unemployed looking for full-time work • Unemployed looking for part-time work • Not in the labour force
For those who responded they were not in the labour force, the main reason for them not looking for work was also sought e.g. ‘own ill-health or disability’. The survey also collected data on long-term health conditions of all survey respondents. Respondents who were identified as being out of the labour force due to their own ill-health or disability were considered to be out of the labour force due to a chronic disease in this study.
3.4. Modelling labour force participation
7 average of 1,000 simulations and the 95% uncertainty interval, estimated using the percentile method, are reported in this report.
We used the same methodology to develop predictive models for full-time employment, part-time employment and unemployment using the data for those in the 45-64 years age group who were in the labour force and simulated if an individual would be in full-time employment, part-time employment or unemployment for individuals aged 65-69 years old who are likely to be in the labour force. We then estimated the number of individuals aged 65-69 years who are likely to be working, and working full-time and working part-time. We also estimated the number of people likely to be out of the labour force due to ill-health, and the main conditions that keep people aged 65-69 years out of the labour force based on the new simulated information on their labour force participation.
4. Results
4.1. The number of people aged 65-69 who have the capacity to work
Our modelling is based on the population aged 45-64 years, which was used to estimate who in the 65-69 years old population will have the capacity to work i.e. likely to be in the labour force. The labour force is defined as those working full-time, working part-time, unemployed and looking for work.
8 4.2. Modelling the number of persons aged 65-69 years in the labour force working full-time or part-time
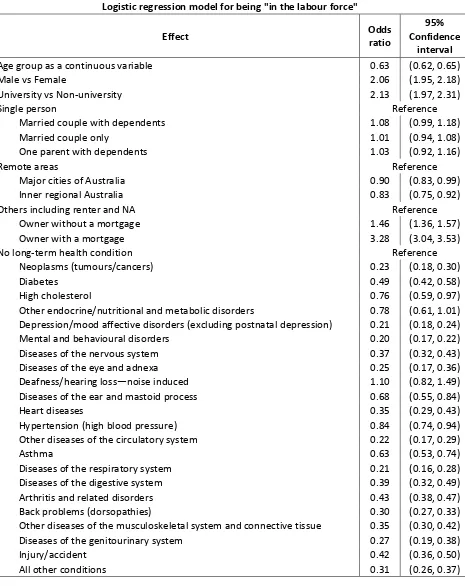
[image:9.595.70.535.67.653.2]We estimated who of the age 65-69 years is likely to be both in the labour force and either working full-time or part-time. The modelling is based on the 45-64 years old population and excludes those not in the labour force for any reason.
Table 2: Odds of participating in the labour force, 45 to 64 year old population Logistic regression model for being "in the labour force"
Effect Odds ratio Confidence 95%
interval
Age group as a continuous variable 0.63 (0.62, 0.65)
Male vs Female 2.06 (1.95, 2.18)
University vs Non-university 2.13 (1.97, 2.31)
Single person Reference
Married couple with dependents 1.08 (0.99, 1.18)
Married couple only 1.01 (0.94, 1.08)
One parent with dependents 1.03 (0.92, 1.16)
Remote areas Reference
Major cities of Australia 0.90 (0.83, 0.99)
Inner regional Australia 0.83 (0.75, 0.92)
Others including renter and NA Reference
Owner without a mortgage 1.46 (1.36, 1.57)
Owner with a mortgage 3.28 (3.04, 3.53)
No long-term health condition Reference
Neoplasms (tumours/cancers) 0.23 (0.18, 0.30)
Diabetes 0.49 (0.42, 0.58)
High cholesterol 0.76 (0.59, 0.97)
Other endocrine/nutritional and metabolic disorders 0.78 (0.61, 1.01) Depression/mood affective disorders (excluding postnatal depression) 0.21 (0.18, 0.24)
Mental and behavioural disorders 0.20 (0.17, 0.22)
Diseases of the nervous system 0.37 (0.32, 0.43)
Diseases of the eye and adnexa 0.25 (0.17, 0.36)
Deafness/hearing loss—noise induced 1.10 (0.82, 1.49)
Diseases of the ear and mastoid process 0.68 (0.55, 0.84)
Heart diseases 0.35 (0.29, 0.43)
Hypertension (high blood pressure) 0.84 (0.74, 0.94)
Other diseases of the circulatory system 0.22 (0.17, 0.29)
Asthma 0.63 (0.53, 0.74)
Diseases of the respiratory system 0.21 (0.16, 0.28)
Diseases of the digestive system 0.39 (0.32, 0.49)
Arthritis and related disorders 0.43 (0.38, 0.47)
Back problems (dorsopathies) 0.30 (0.27, 0.33)
Other diseases of the musculoskeletal system and connective tissue 0.35 (0.30, 0.42)
Diseases of the genitourinary system 0.27 (0.19, 0.38)
Injury/accident 0.42 (0.36, 0.50)
9 Results of logistic regression models for full-time and part-time employment are shown in Appendices A and B respectively. Results from the models suggest that people with a university degree (or higher qualification), married couple (with or without dependents) and home owners (with or without a mortgage) are more likely to be employed. Men are more likely to be employed full-time than unemployed and less likely to be employed part-time than unemployed. Although age is negatively associated with the probability of being in the labour force, it is positively associated with the probability of being employed full-time or part-time for those who are in the labour force.
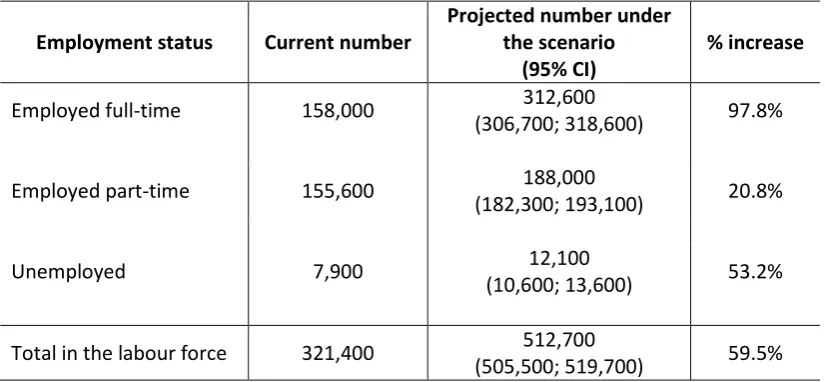
Based on the logistic regression models (Appendices A and B), we simulated the likelihood of individuals aged 65-69 years who were likely to participate in the labour force under a hypothetic scenario where the retirement age is 70 years being employed full-time or part-time or being unemployed. The number of people aged 65-69 years who would have been likely to be working full-time in 2015 under this scenario was estimated to be approximately 312,600 (95% CI: 306,700; 318,600), an increase of 154,600 (97.8% increase) from the estimated number under the current setting (Table 3). The full-time employment rate would be expected to increase from 49.2% to 61% under the changed scenario. The number of people aged 65-69 years projected to be in part-time employment or unemployment was also projected to increase, although at a slower rate than full-time employment.
4.3. The number of people aged 65-69 who are likely to be unable to participate in the labour force due to their own ill-health
[image:10.595.86.499.400.591.2]Under the current setting, there are 818,970 people aged 65-69 years not in the labour force in 2015. Of these, 12,000 (1.5%) are not in the labour force due to ill-health, although some respondents who report being out of the labour force due to other reasons (such as their age) would have health conditions which are likely to preclude them from working. Under the scenario that the retirement age is increased to 70, we estimated that 627,700 (95% CI: 620,700; 634,800) people aged 65-69 years would not be in the labour force, where 97,700 (95% CI: 93,700; 101,700) would not be in the labour force due to their own ill-health, a 15.6% of the population
Table 3: Current and projected number by employment status, 65 to 69 year old population, 2015
Employment status Current number Projected number under the scenario
(95% CI) % increase Employed full-time 158,000 (306,700; 318,600) 312,600 97.8%
Employed part-time 155,600 (182,300; 193,100) 188,000 20.8%
Unemployed 7,900 (10,600; 13,600) 12,100 53.2%
10 aged 65-69 years old who are not in the labour force. Our simulation of the number of people who are likely to be out of the labour force due to their own ill-health is based on the logistic regression model for being out of the labour force due to ill-health for the population aged 45-64 years, which excluded those in the labour force (employed and unemployed) (Table 4).
Table 4: Odds of not participating in the labour force due to ill-health among those not in the labour force, 45 to 64 year old population
Logistic regression model for "not in the labour force due to ill health" among those not in the labour force
Effect Odds ratio Confidence 95%
interval
Age group as a continuous variable 0.95 (0.90, 1.01)
Male vs Female 1.13 (1.00, 1.28)
University vs Non-university 0.70 (0.56, 0.88)
Single person Reference
Married couple with dependents 0.86 (0.70, 1.05)
Married couple only 0.64 (0.55, 0.75)
One parent with dependents 0.90 (0.71, 1.14)
Remote areas Reference
Major cities of Australia 1.03 (0.85, 1.24)
Inner regional Australia 1.01 (0.82, 1.25)
Others including renter and NA Reference
Owner without a mortgage 0.53 (0.45, 0.63)
Owner with a mortgage 0.75 (0.63, 0.90)
No long-term health condition Reference
Neoplasms (tumours/cancers) 29.34 (17.97, 47.90)
Diabetes 11.94 (7.66, 18.63)
High cholesterol 4.05 (1.53, 10.71)
Other endocrine/nutritional and metabolic disorders 9.47 (4.70, 19.06) Depression/mood affective disorders (excluding postnatal depression) 19.88 (13.30, 29.71)
Mental and behavioural disorders 17.49 (11.98, 25.54)
Diseases of the nervous system 15.70 (10.34, 23.85)
Diseases of the eye and adnexa 18.45 (9.46, 36.01)
Deafness/hearing loss—noise induced 2.04 (0.42, 9.87)
Diseases of the ear and mastoid process 10.61 (5.88, 19.16)
Heart diseases 12.47 (7.58, 20.53)
Hypertension (high blood pressure) 5.77 (3.62, 9.19)
Other diseases of the circulatory system 17.75 (10.70, 29.44)
Asthma 8.83 (5.40, 14.46)
Diseases of the respiratory system 18.39 (11.13, 30.40)
Diseases of the digestive system 13.45 (8.00, 22.60)
Arthritis and related disorders 15.22 (10.56, 21.93)
Back problems (dorsopathies) 19.52 (13.73, 27.77)
Other diseases of the musculoskeletal system and connective tissue 22.09 (14.59, 33.44)
Diseases of the genitourinary system 7.64 (3.50, 16.69)
Injury/accident 23.22 (15.22, 35.41)
11 Results of the logistic regression model for people being out of the labour force due to their own ill-health (Table 4) suggest that those without a university qualification, a single person compared to a married couple (without dependents), renters, and who have a long-term health condition are more likely to be out of the labour force due to ill-health.
4.4. Chronic conditions that mostly contribute to being out of the labour force due to ill-health
12 Table 5: Chronic health conditions that most likely keep people aged 65-69 out of the labour force
Main long-term health condition Projected number
(%) 95% CI
Arthritis and related disorders (21.1%) 20,656 (18,814; 22,503)
Back problems (dorsopathies) (17.1%) 16,743 (15,167; 18,457)
Other diseases of the musculoskeletal system and connective tissue (6.6%) 6,474 (5,457; 7,447)
Diabetes (5.5%) 5,364 (4,449; 6,409)
Neoplasms (tumours/cancers) (4.8%) 4,677 (3,856; 5,553)
Mental and behavioural disorders (4.8%) 4,662 (3,876; 5,516)
All other conditions (4.6%) 4,490 (3,621; 5,377)
Hypertension (high blood pressure) (4.5%) 4,434 (3,580; 5,385)
Injury/accident (4.4%) 4,331 (3,493; 5,150)
Diseases of the respiratory system (4.1%) 3,977 (3,207; 4,770)
Heart diseases (3.8%) 3,664 (2,952; 4,441)
Diseases of the nervous system (3.4%) 3,279 (2,553; 4,074)
Other diseases of the circulatory system (2.8%) 2,701 (2,031; 3,408) Depression/mood affective disorders (excluding postnatal
depression) (2.3%) 2,236 (1,655; 2,803)
Diseases of the ear and mastoid process (2.2%) 2,149 (1,545; 2,774)
Diseases of the digestive system (2.2%) 2,102 (1,518; 2,737)
Asthma (1.7%) 1,624 (1,075; 2,206)
Diseases of the eye and adnexa (1.1%) 1,054 (670; 1,424)
Other endocrine/nutritional and metabolic disorders (0.6%) 555 (263; 899)
High cholesterol (0.5%) 524 (250; 855)
Diseases of the genitourinary system (0.5%) 504 (212; 824)
13 5. Discussion and Conclusion
We estimated that 512,700 people aged 65-69 years would have the capacity to work (i.e. be in the labour force), and 627,700 would be out of the labour force in 2015 under the hypothetical scenario of increasing the retirement age to 70. Individuals who have a university degree (or higher qualification), married (with or without dependents), and home owners (with or without a mortgage) are more likely to be employed. Men and those with long-term health conditions are less likely to be employed. Although age is negatively associated with the probability of being in the labour force, it is positively associated with the probability of employment full or part-time for those who are in the labour force. However, this may be because older people who cannot find work are more likely to leave the labour force rather than continue to seek employment. We also determined that the top ranked long-term health conditions keeping people out of the labour force in the population aged 65-69 years were: arthritis, back problems, other diseases of musculoskeletal system, diabetes and neoplasms (tumors/cancers) and mental and behavioural disorders.
COAG is pursuing strategies to increase the labour force participation of key groups (such as those receiving welfare payments, mature and older workers, and women) in order to ensure future revenue streams. One of the main policies to achieve this has been the Australian Government’s move to increase the age of eligibility to the Age Pension. The COAG National Reform Initiative Working Group argued that:
…good health is the foundation of an active and productive working life. To help people develop and maintain good health, there needs to be a concerted effort to reduce the prevalence of the risk factors that are known to contribute to chronic diseases[5].
COAG make special note of the fact that an ageing population and continuing low fertility is projected to “reduce overall labour force participation rates”. However, COAG were also quick to note that:
…the foundation of the nation’s human capital is the health of its people. A strong economy requires a healthy current and future workforce. A greater focus is needed on promoting good health and preventing ill health among children and the working-age population, with particular attention to key disease categories…
14 In published work, we projected that 380,000 (7.3%) people aged 45-64 years are out of the labour force due to ill-health in 2015, increasing to 459,000 (7.6%) by 2030 – a 22% increase[19]. Should the age of retirement increase to 70, the current project has identified a further 97,700 Australians who would be kept out of the labour force due to their own ill-health or disability. Older workers who are out of the labour force due to their ill-health incur substantial costs in terms of lost income, savings, and income poverty. We have already demonstrated that premature retirement due to ill-health is a major contributor to poverty, with about half of all the families affected being in poverty[31]. The economic consequences include a reduced capacity to save with those unable to work due to their own ill-health having about 85% less in savings (superannuation and other income producing assets) and a similar reduction in their income stream from their savings in retirement after the age of 65 years compared to their counterparts without a chronic health condition who are able to keep working full-time[32].
15 References
1. The Treasurer (The Honourable Joe Hockey MP), 2014-2015 Budget Night Speech. 2014, Commonwealth of Australia: Canberra.
2. National Commission of Audit, Towards Responsible Government Phase One (Sections 1.4, and 7.1),. 2014, Commonwealth of Australia: Canberra.
3. Commonwealth of Australia, 2015 Intergenerational Report: Australia in 2055. 2015, Commonwealth of Australia: Canberra.
4. Productivity Commission, An Ageing Australia: Preparing for the Future (sections 6.7, B.1 p275, A.1, and B.1 p275 respectively). 2013, Commonwealth of Australia: Canberra.
5. Council of Australian Government (COAG), Human Capital Reform: Report by the National Reform Initiative Working Group. 2006.
6. The Treasury, Intergenerational report 2002–03. 2002, Commonwealth of Australia: Canberra. 7. The Treasury, Intergenerational report 2007. 2007, Commonwealth of Australia: Canberra. 8. The Treasury, Intergenerational Report 2010. 2010, Australian Government: Canberra.
9. The Honourable Wayne Swan MP. Budget speech 2011-12. 2011 4 March 2014]; Available from:
http://www.budget.gov.au/2011-12/content/speech/html/speech.htm.
10. Kelly, S. and A. Harding, Funding the Retirement of the Baby Boomers. Agenda, 2004. 11(2): p. 99-112. 11. Australian Government, A Plan to Simplify and Streamline Superannuation (Accessed 20 July 2006),
http://www.budget.gov.au/. 2006.
12. Australian Bureau of Statistics, Retirement and Retirement Intentions, Australia, July 2012 to June 2013 (cat. no. 6238.0). 2013, Australian Bureau of Statistics: Canberra.
13. Australian Bureau of Statistics, Australian Historical Population Statistics 2008 (cat. no. 3105.0.65.001). 2009 Australilan Bureau of Statistics: Canberra.
14. Australian Bureau of Statistics, Australian historical population statistics, Cat 3105.0, . 2014, Australian Bureau of Statistics Canberra.
15. Actuaries Institute, Actuaries warn of retirement underfunding risk. 2014, Actuaries Institute: Sydney. 16. National Commission of Audit, Towards Responsible Government: The Report of the National
Commission of Audit – Phase One (Section 7.1), . 2014, Commonwealth of Australia: Canberra.
17. National Commission of Audit, Towards Responsible Government: Appendix to the Report of the National Commission of Audit - Volume 1 (section 9.1),. 2014, Commonwealth of Australia.
18. Schofield, D., et al., Are We Getting Healthier As We Grow Older? Implications for Babyboomer Labor Force Participation. Ann NY Acad Sci, 2007. 1114: p. 230-40.
19. Schofield, D., et al., Lost productive life years caused by chronic conditions in Australians aged 45-64 years, 2010 to 2030. Medical Journal of Australia, 2015. 203(6): p. 260.e1-6.
20. Schofield, D., et al., The impact of chronic conditions of care recipients on the labour force participation of informal carers in Australia: which conditions are associated with higher rates of non-participation in the labour force? . BMC Public Health, 2014. 14(1): p. 1-9.
21. Schofield, D., et al., Economic Impacts of Illness in Older Workers: Quantifying the impact of illness on income, tax revenue and government spending. BMC Public Health, 2011. 11: p. 418.
16 23. Australian Bureau of Statistics, 2003 Disability, Ageing and Carers: Summary of findings. 2004, Australian
Bureau of Statistics: Canberra.
24. Australian Bureau of Statistics, Information Paper - Basic Confidentialised Unit Record File: Survey of Disability, Ageing and Carers 2003 (reissue). 2005, Australian Bureau of Statistics: Canberra.
25. Australian Bureau of Statistics, Information Paper: Disability, Ageing and Carers, Australia: User Guide 2009, Cat 4431.0.55.001. 2011, Australian Bureau of Statistics: Canberra.
26. Australian Bureau of Statistics, Disability, Ageing and Carers, Australia: Summary of Findings, 2012. 2013, Australian Bureau of Statistics: Canberra.
27. Bell, P., GREGWT and TABLE macros - users guide. 2000, Australian Bureau of Statistics: Canberra. 28. Singh, A.C. and C.A. Mohl, Understanding calibration estimators in survey sampling. Survey
Methodology, 1996. 22: p. 107-15.
29. Tanton, R., et al., Small area estimation using a reweighting algorithm. J R Statist Soc A 2011. 174(4): p. 931-951.
30. Keegan, M. and S. Kelly, APPSIM - Dynamic microsimulation modelling of social security and taxation. 2009, National Centre for Social and Economic Modelling, University of Canberra: Canberra.
31. Schofield, D., et al., Premature retirement due to ill health and poverty: a cross-sectional study of older workers. BMJ Open, 2013. 3: p. e002683.
17 Appendix A: Logistic regression model for “being employed full-time vs unemployed” for those aged 45 to 64 year old population who are in the labour force
Effect Odds ratio Confidence 95%
interval
Age group as a continuous variable 1.11 (1.03, 1.19)
Male vs Female 1.36 (1.18, 1.56)
University vs Non-university 1.90 (1.59, 2.29)
Single person Reference
Married couple with dependents 1.55 (1.28, 1.87)
Married couple only 1.73 (1.45, 2.06)
One parent with dependents 0.69 (0.55, 0.85)
Remote areas Reference
Major cities of Australia 0.81 (0.65, 1.00)
Inner regional Australia 0.74 (0.58, 0.94)
Others including renter and NA Reference
Owner without a mortgage 2.16 (1.79, 2.60)
Owner with a mortgage 3.08 (2.61, 3.62)
No long-term health condition Reference
Neoplasms (tumours/cancers) 0.90 (0.33, 2.44)
Diabetes 1.30 (0.80, 2.10)
High cholesterol 0.64 (0.36, 1.12)
Other endocrine/nutritional and metabolic disorders 0.87 (0.45, 1.69) Depression/mood affective disorders (excluding postnatal depression) 0.34 (0.23, 0.49)
Mental and behavioural disorders 0.36 (0.26, 0.49)
Diseases of the nervous system 0.52 (0.37, 0.75)
Diseases of the eye and adnexa 0.26 (0.13, 0.54)
Deafness/hearing loss—noise induced 0.80 (0.46, 1.37)
Diseases of the ear and mastoid process 0.85 (0.51, 1.41)
Heart diseases 0.65 (0.37, 1.14)
Hypertension (high blood pressure) 0.91 (0.69, 1.21)
Other diseases of the circulatory system 0.87 (0.37, 2.05)
Asthma 0.91 (0.62, 1.33)
Diseases of the respiratory system 0.70 (0.30, 1.64)
Diseases of the digestive system 0.70 (0.40, 1.22)
Arthritis and related disorders 0.88 (0.66, 1.18)
Back problems (dorsopathies) 0.58 (0.46, 0.73)
Other diseases of the musculoskeletal system and connective tissue 0.53 (0.34, 0.82)
Diseases of the genitourinary system 1.79 (0.29, 11.00)
Injury/accident 0.54 (0.38, 0.75)
18 Appendix B: Logistic regression model for “being employed part-time vs unemployed” for those aged 45 to 64 year old population who are in the labour force
Effect Odds ratio Confidence 95%
interval
Age group as a continuous variable 1.41 (1.31, 1.52)
Male vs Female 0.23 (0.20, 0.26)
University vs Non-university 1.34 (1.11, 1.63)
Single person Reference
Married couple with dependents 2.89 (2.36, 3.54)
Married couple only 2.33 (1.93, 2.81)
One parent with dependents 1.38 (1.10, 1.73)
Remote areas Reference
Major cities of Australia 0.85 (0.67, 1.06)
Inner regional Australia 0.92 (0.71, 1.19)
Others including renter and NA Reference
Owner without a mortgage 2.38 (1.96, 2.88)
Owner with a mortgage 2.04 (1.72, 2.43)
No long-term health condition Reference
Neoplasms (tumours/cancers) 1.89 (0.69, 5.22)
Diabetes 1.36 (0.82, 2.25)
High cholesterol 0.72 (0.40, 1.32)
Other endocrine/nutritional and metabolic disorders 1.04 (0.53, 2.06) Depression/mood affective disorders (excluding postnatal depression) 0.65 (0.44, 0.95)
Mental and behavioural disorders 0.63 (0.45, 0.88)
Diseases of the nervous system 0.73 (0.50, 1.06)
Diseases of the eye and adnexa 0.25 (0.10, 0.59)
Deafness/hearing loss—noise induced 0.73 (0.39, 1.35)
Diseases of the ear and mastoid process 1.09 (0.64, 1.86)
Heart diseases 1.02 (0.56, 1.84)
Hypertension (high blood pressure) 0.92 (0.68, 1.23)
Other diseases of the circulatory system 1.04 (0.43, 2.53)
Asthma 0.89 (0.60, 1.32)
Diseases of the respiratory system 1.06 (0.43, 2.61)
Diseases of the digestive system 0.80 (0.44, 1.45)
Arthritis and related disorders 1.13 (0.84, 1.53)
Back problems (dorsopathies) 0.96 (0.75, 1.23)
Other diseases of the musculoskeletal system and connective tissue 0.86 (0.55, 1.35)
Diseases of the genitourinary system 3.65 (0.59, 22.59)
Injury/accident 0.65 (0.45, 0.93)