Kilobases Upstream of
c-myb
Are Proximal to the 5
=
Regulatory
Region of the Gene through DNA Looping
Junfang Zhang, Jan Markus,* Juraj Bies, Thomas Paul,* and Linda Wolff
Laboratory of Cellular Oncology, Center for Cancer Research, National Cancer Institute, Bethesda, Maryland, USA
Retroviruses integrated into genomic DNA participate in long-range gene activation from as far away as several hundred
kilo-bases. Hypotheses have been put forth to account for these phenomena, but data have not been provided to support a physical
mechanism that explains long-range activation. In murine leukemia virus-induced myeloid leukemia in mice, integrated
provi-ruses have been found upstream of
c-myb
in three regions, named Mml1, Mml2, and Mml3 (25, 50, and 70 kb upstream,
respec-tively). The transcription factor c-Myb is an oncogene whose dysregulation and/or mutation can lead to human leukemia. We
hypothesized that the murine
c-myb
upstream region contains regulatory elements accessed by the retrovirus. To identify
regu-latory sites in the murine
c-myb
upstream region, we looked by chromatin immunoprecipitation with microarray technology
(ChIP-on-chip) for histone modifications implicating gene activation in normal cells. H3K4me3, H3K4me1, and H3K9/14ac
were enriched at Mml1 and/or Mml2 in the myeloblastic cell line M1, which expresses
c-myb
. The enrichment of all of these
his-tone marks decreased with differentiation-induced downregulation of the gene in M1 cells but increased and spread in tumor
cells containing integrated provirus. Importantly, using chromosome conformation capture (3C)-quantitative PCR assays,
inter-actions between the 5
=
region, including the promoter and all Mml sites (Mml1, Mml2, and Mml3), were detected due to DNA
looping in M1 cells and tumor cells with provirus in Mml1, Mml2, or Mml3. Therefore, our study provides a new mechanism of
retrovirus insertional mutagenesis whereby spatial chromatin organization allows distally located provirus, with its own
en-hancer elements, to access the 5
=
regulatory region of the gene.
C
-Myb is a transcription factor that regulates hematopoiesis by
controlling essential cellular processes, such as proliferation,
differentiation, and apoptosis (
7
,
21
). A role for
c
-
MYB
in human
T-cell leukemia (T-ALL) has been reported recently, where the
gene was found to be involved in translocation and duplication (
3
,
18
). Altered c-
MYB
expression also plays a role in human colon
and breast carcinoma (
6
,
13
,
37
). These reports followed years of
studies in avian and murine models which demonstrated that
overexpression or mutations in
c-myb
can release its oncogenic
potential, especially in myeloid cells (
30
,
40
).
c-myb
was a primary target of insertional mutagenesis when
Moloney murine leukemia virus (M-MuLV) was inoculated
intra-venously into adult BALB/c mice following intraperitoneal
injec-tion of pristane to induce an inflammatory response (
26
,
33
,
42
).
In this animal model, 100% of the tumors were shown to have
undergone
c-myb
DNA rearrangements due to virus integration.
Promoter insertion combined with the formation of
gag-myb
RNA fusions was the most common mechanism of activation.
Therefore, an important feature was the ability of the enhancer/
promoter region in the long terminal repeat (LTR) of the provirus
to activate transcription from the
c-myb
locus, bypassing the
nor-mal promoter.
In a similar model where pristane-treated DBA/2 mice were
injected with amphotropic 4070 virus (
41
), two-thirds had
inte-grations directly into
c-myb
, and additional proviral integration
sites were found far upstream of
c-myb
. These upstream
integra-tion sites were mapped to three regions, named Mml1, Mml2, and
Mml3, located approximately 25, 50, and 70 kb upstream of the
c-myb
promoter, respectively (
9
,
16
). Interestingly, many of these
leukemia viruses have a single clonal provirus which was found in
one of these regions.
The mechanism by which these proviral insertions in Mml1,
Mml2, or Mml3 contributes to leukemia development has been
unknown. After the failure to find additional gene-coding regions
within this 100-kb region, we hypothesized that the upstream
re-gion of
c-myb
contains regulatory elements that control
expres-sion of
c-myb
at a distance, and perhaps these elements are utilized
by the provirus to somehow activate gene expression. We have
addressed this model by analyzing histone modifications within
this region to identify sites that are potentially involved in positive
gene regulation. Indeed, enrichments of histone methylation and
acetylation marks, which identify enhancers, were found near
proviruses and were associated with
c-myb
expression. Further
analysis of the spatial organization of the same 100-kb region,
using a quantitative chromosome conformation capture PCR
(3C-qPCR) assay, revealed looping structures that, in tumors,
al-low integrated proviral LTRs access to the 5=
control region of
c-myb
. This provides the first evidence for a long-range
mecha-nism of retrovirus gene activation through a 3-dimensional
chro-mosome structure.
Received1 May 2012Accepted9 July 2012
Published ahead of print18 July 2012
Address correspondence to Linda Wolff, wolffl@mail.nih.gov.
* Present address: Jan Markus, Cancer Research Institute, Slovak Academy of Sciences, Bratislava, Slovakia; Thomas Paul, Celgene, San Diego, California, USA.
Copyright © 2012, American Society for Microbiology. All Rights Reserved.
doi:10.1128/JVI.01077-12
on November 7, 2019 by guest
http://jvi.asm.org/
gene expression assays (Mm 00501741-m1; Applied Biosystems). Data were normalized to a mouse glyceraldehyde-3-phosphate dehydrogenase (GAPDH) control (Applied Biosystems). Relative quantitation was car-ried out by the comparative threshold cycle (CT) method. Statistical anal-ysis was performed using GraphPad Prism 5 software. The Studentttest was used on measurements ofc-mybexpression from M1 and tumor samples from 3 experimental replicates.
ChIP-on-chip analysis.Chromatin immunoprecipitation with mi-croarray technology (ChIP-on-chip) was conducted as previously de-scribed (28). Cells were fixed in 0.8% formaldehyde for 6 min at room temperature. After lysis, samples were sonicated to a size range of 200 to 1,000 bp. Chromatin (150 to 200g) was immunoprecipitated with an-tibodies for H3K4me3 (ab8580; Abcam), H3K4me1 (ab8895; Abcam), H3K9/14Ac (06-599; Upstate), CTCF (ab70303; Abcam), H3K9me3 (ab8898; Abcam), H3K27me3 (17-622; Upstate), or rabbit IgG (15006; Sigma-Aldrich). A 10% aliquot was removed as an input fraction. ChIP DNA and input DNA were amplified using a WGA2 kit (Sigma-Aldrich). A total of 2.5g of amplified DNA was labeled with Cy3 (input) or Cy5 (IP) dUTP (PerkinElmer Life and Analytical Sciences) using the CGH labeling kit (Invitrogen).
Custom 8-by-15,000 tiling arrays (Agilent) contained probes span-ning mouse chromosome 10 (chr.10) from bp 020600015 to 021199991 (genome browser-mm8; University of California–Santa Cruz). Probes were designed using eArray (Agilent) and a covered 600-kb region sur-roundingc-myb (⬃40-bp spacing). A total of 3g of labeled ChIP and input DNA was cohybridized to the chip for 40 h at 65°C, washed, and scanned using an Agilent Scanner with Agilent Scan Control 7.0 software. Data were extracted with Feature Extraction 9.1 software and analyzed using ChIP Analytics 1.3 software (Agilent). Normalized and raw data files can be accessed at the GEO database with accession numberGSE34770.
3C assay.The 3C-qPCR protocol was performed as described previ-ously (8), with minor modifications. Cross-linking was performed by in-cubating 1⫻107cells in 10 ml of fresh medium supplemented with 1%
formaldehyde for 10 min at room temperature. The reaction was quenched by addition of glycine to a final concentration of 0.125 M. Nuclei were harvested by lysis of the cells in ice-cold lysis buffer (10 mM Tris-HCl, pH 7.5; 10 mM NaCl; 0.2% NP-40; 1⫻complete protease in-hibitor [11836145001; Roche]) at 4°C for 1 h. Nuclei were resuspended in buffer 2 (NEB) containing 0.3% SDS and incubated at 37°C for 1 h while being shaken. Triton X-100 was added to 2%, followed by incubation for 1 h at 37°C to sequester the SDS. The cross-linked DNA was digested overnight with 400 U HindIII. Digested DNA was diluted with ligation buffer (50 mM Tris-HCl, 10 mM MgCl2, 10 mM dithiothreitol [DTT], 1
mM ATP) to a low DNA concentration of 3 ng/l. After addition of Triton X-100 to 1%, 1 h of incubation was performed at 37°C. DNA was ligated by using 100 U T4 DNA ligase in 7 ml 1⫻ligation buffer for 4 h at 16°C, followed by 30 min of incubation at room temperature. Proteinase K (300 g final) was added and DNA was incubated overnight at 65°C to de-cross-link the samples. De-de-cross-linked DNA was incubated for 30 min at 37°C with RNase (300g final) and purified by phenol-chloroform ex-traction and ethanol precipitation. The purity assessment and loading adjustment were based on qPCR.
To prepare a qPCR control template in which all possible ligation
products are present in equimolar amounts, a mouse K9 bacterial artificial chromosome (BAC) clone (9) was completely digested with HindIII and ligated at a high DNA concentration to reach a random ligation. The ligated products were diluted to the appropriate concentration to perform the standard curve for each test primer set by qPCR.
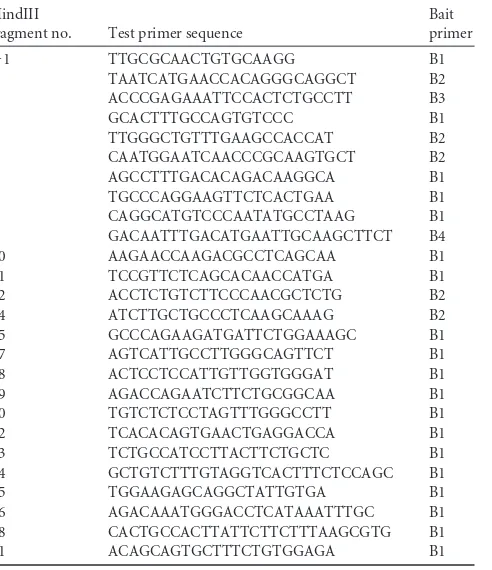
Quantitative PCR analysis of 3C DNA.The TaqMan probe and bait primers were designed close to the HindIII restriction site of thec-myb
promoter bait fragment. Test primers were designed close to restriction sites of each candidate interacting fragment. (Sequences of the test and bait primers and TaqMan probe are listed inTable 1.) Two hundred ng of 3C DNA and Universal PCR Master Mix (Applied Biosystems) were used for the TaqMan real-time PCR. Standard curves were performed for each run using serial dilutions of the control template prepared from the K9 BAC clone. Relative interactions were determined by the values corre-sponding to the quantification of the ligation product. Values were calcu-lated using the parameters of the standard curve (b, intercept;a, slope) as 10(CT⫺b)/a. For normalization, values in different 3C samples were di-vided by the value of the ERCC3 internal cross-linking control (35).
Microarray data accession number.Normalized and raw data files have been submitted to the GEO database under accession number GSE34770.
7 TGCCCAGGAAGTTCTCACTGAA B1
8 CAGGCATGTCCCAATATGCCTAAG B1
9 GACAATTTGACATGAATTGCAAGCTTCT B4
10 AAGAACCAAGACGCCTCAGCAA B1
11 TCCGTTCTCAGCACAACCATGA B1
12 ACCTCTGTCTTCCCAACGCTCTG B2
14 ATCTTGCTGCCCTCAAGCAAAG B2
15 GCCCAGAAGATGATTCTGGAAAGC B1
17 AGTCATTGCCTTGGGCAGTTCT B1
18 ACTCCTCCATTGTTGGTGGGAT B1
19 AGACCAGAATCTTCTGCGGCAA B1
20 TGTCTCTCCTAGTTTGGGCCTT B1
22 TCACACAGTGAACTGAGGACCA B1
23 TCTGCCATCCTTACTTCTGCTC B1
24 GCTGTCTTTGTAGGTCACTTTCTCCAGC B1
25 TGGAAGAGCAGGCTATTGTGA B1
26 AGACAAATGGGACCTCATAAATTTGC B1
28 CACTGCCACTTATTCTTCTTTAAGCGTG B1
31 ACAGCAGTGCTTTCTGTGGAGA B1
a
Four bait primers (B1, B2, B3, and B4) are all located within a 34-bp sequence located 100 to 134 bp downstream of the 5=HindIII site of thec-mybpromoter bait fragment. Their sequences are the following (5=to 3=): B1, ATTATGGAGGCGAGAGAGGTGT; B2, TCAT TATGGAGGCGAGAGAGGTGT; B3, ATTATGGAGGCGAGAGAGGTGTCA; and B4, TCATTCATTCATTATGGAGGCGAGAGAGG. For each ligation product, the bait primer giving the best amplification efficiency was used as indicated in the table. The ligation product-specific primers (so-called test primers) were designed downstream of the 5=HindIII site of each restriction fragment (fragments 1 to 31). The sequence of the TaqMan probe used is 5=- 6-carboxyfluorescein [FAM]- AATCTTTGCAGCTGCCTGC CTGTCAGC-3=BGH. Internal interaction controls were performed using the following ERCC-3 primers as described before (35): forward primer (5=to 3=), GCCCTCCCTGA AAATAAGGA; reverse primer (5=to 3=), GACTTCTCACCTGGGCCTACA; ERCC-3 TaqMan probe, 5=- FAM-AAAGCTTGCACCCTGCTTTAGTGGCC-3=BGH.
on November 7, 2019 by guest
http://jvi.asm.org/
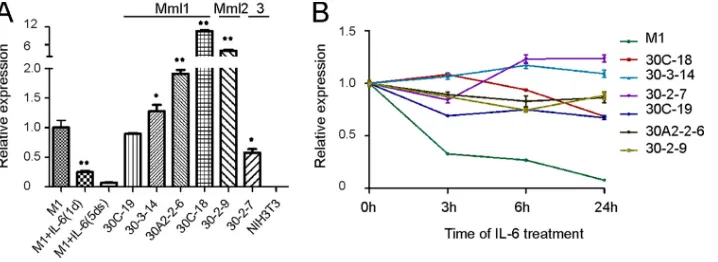
[image:2.585.299.545.86.371.2]RESULTS
c-myb
is expressed in tumor cell lines with provirus integrated
in
c-myb
upstream regions.
c-Myb is an essential regulator of
hematopoiesis, and its expression is largely restricted to
progeni-tor cells and is downregulated as cells differentiate (
7
). As shown
in
Fig. 1A
, expression of
c-myb
RNA is significantly decreased in
myeloblastic M1 cells induced by IL-6 to differentiate into
mono-cytes/macrophages during a period of 5 days. Furthermore,
c-myb
is expressed in tumor cell lines with integrated provirus in the
Mml1, Mml2, or Mml3 region at levels similar to or higher than
those of undifferentiated M1 cells (
Fig. 1A
). These tumor cells
have either a very limited response to IL-6 compared to M1 cells or
no response (
Fig. 1B
). This indicates that there is a positive
corre-lation between the presence of provirus upstream of
c-myb
and
c-myb
expression.
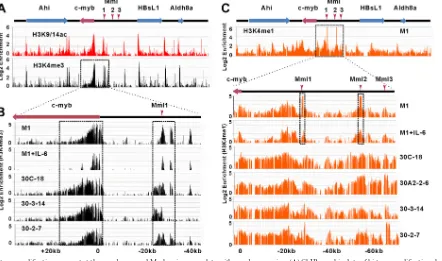
Histone H3K4 trimethylation and histone acetylation at
both the
c-myb
gene promoter and Mml1 are associated with
active
c-myb
transcription.
Histone modifications are implicated
in influencing gene expression and genome function. To provide
evidence for upstream transcriptional regulatory regions that
might be involved in positively influencing
c-myb
expression in
normal cells without proviral integration, we analyzed for
enrich-ments of H3K4 trimethylation (H3K4me3) and acetylation of
H3K9 and H3K14 (H3K9/14ac) in M1 cells. These histone
modi-fications have been found by others to be frequently present at
gene promoters at either a poised or transcriptional active state (
1
,
15
,
17
). Distribution of these marks in M1 cells was determined by
ChIP-on-chip analysis using a tiling microarray representing a
600-kb region surrounding the
c-myb
gene on mouse chr.10
(
⬃
40-bp spacing) (
Fig. 2A
). Consistent with active
c-myb
in these
cells, both H3K4me3 and H3K9/14ac were found at its
transcrip-tion start site. Interestingly, there was also strong enrichment of
these marks in the Mml1 region, with 3 peaks between
⫺
25 and
⫺
40 kb that indicate the presence of regulatory elements (
Fig. 2A
and
B
). It should be noted that in previous studies, no transcripts
were found in these regions (
9
). To examine the enhancer activity
of sequences representing the three peaks, E1 (3.8k), E2 (1.8k),
and E3 (1.9k) fragments were cloned upstream of the
c-myb
pro-moter controlling a firefly luciferase reporter gene (
Fig. 3A
and
B
).
Luciferase assays show that sequences within one of the regions
increased luciferase activity (
Fig. 3C
), indicating the presence of
an enhancer element. The histone modifications that were present
at both
c-myb
and Mml1 sites in M1 cells significantly decreased
when
c-my
b was downregulated in conjunction with IL-6
treat-ment (
Fig. 2B
), supporting their role in
c-myb
transcription.
Further analysis showed that, in tumor cells with integrations
at Mml1 (30C-18 and 30-3-14) and expressing
c-myb
, there was an
increase in H3K4me3 at the
c-myb
promoter and at Mml1
com-pared to the level found in M1 cells (
Fig. 2B
). In fact, the regions of
enrichment were expanded in the direction of the
c-myb
gene. In a
tumor cell line (30-2-7) with a provirus at Mml3, we observed a
similar broad distribution of the H3K4me3 mark at
c-myb
and
Mml1. We hypothesize that the presence of viral enhancers in
integrated proviruses is responsible for the increase in histone
modification.
H3K4me1 in the
c-myb
upstream region is increased and
al-tered in location due to integrated provirus.
It was reported that
the distribution of the H3K4me1 mark can predict regulatory
el-ements, such as enhancers (
11
). ChIP-on-chip data showed that
this modification was strikingly abundant at both Mml1 and
Mml2 in M1 cells, and it was decreased at both sites when M1 cells
were differentiated with IL-6 treatment for 5 days (
Fig. 2C
). We
also observed that, in tumors with insertions in Mml1 and Mml3,
enrichment of H3K4me1 was present at all Mml regions.
Com-pared to M1 cells, the presence of provirus at either Mml1 or
Mml3 caused an expansion of this histone modification
through-out the upstream region of
c-myb
.
Changes in H3K27me3 and H3K9me3, which are reported to
be associated with the transcriptional repression states, were not
found to differ largely between
c-myb
-expressing and
nonexpress-ing cells (data not shown).
All three retrovirus integration regions interact with the 5
=
end of
c-myb
in tumor cell lines through DNA looping.
The
his-tone modification data above suggest the existence of regulatory
elements in the distal upstream region of
c-myb
that correlate with
c-myb
expression levels. Interestingly, the presence of provirus in
one region causes increases of the enhancer-associated histone
marks at a distance, suggesting that there are interactions between
distal loci and the
c-myb
promoter. Therefore, we decided to look
at the spatial organization of the chromosome by applying a
quan-FIG 1Expression ofc-mybRNA in tumor cell lines with integrated provirus. Expression levels were determined by quantitative reverse transcription PCR. (A) Total RNA samples were prepared from M1 cells, M1 cells treated with IL-6 for 1 or 5 days, 6 tumor cell lines with virus integrated in the Mml1, Mml2, or Mml3 region, and NIH 3T3 cells. Data are normalized to GAPDH expression. Error bars represent standard deviations (SD) (n⫽3). An asterisk represents significant difference of expression compared to M1 cells (P⬍0.05). **,P⬍0.01. (B) Response of tumor cell lines to IL-6. Total RNA was prepared from the indicated tumor cell lines and M1 cells after treatment with IL-6 for 0, 3, 6, and 24 h. Data are normalized to initialc-mybexpression in individual cell lines. Error bars represent SD (n⫽3).on November 7, 2019 by guest
http://jvi.asm.org/
[image:3.585.113.472.66.197.2]titative chromosome conformation capture assay (3C-qPCR) (
5
,
8
). The 3C assay, developed by Dekker et al., provides a method to
detect long-range chromatin interactions
in vivo
(
5
). A region of
approximately 100 kb, upstream of
c-myb
and covering the Mml1,
Mml2, and Mml3 regions, was examined. Interaction frequency
was detected by quantitative real-time PCR with a TaqMan probe
designed in the bait. To relate the spatial conformation of the
c-myb
locus to its transcriptional status, the 3C-qPCR assay was
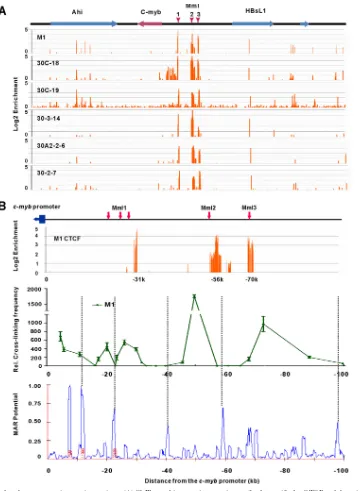
FIG 2Histone modifications present at thec-mybgene and Mml regions correlate withc-mybexpression. (A) ChIP-on-chip data of histone modifications known to represent active transcription, H3K9/14ac and H3K4me3, in M1 cells. The schematic presentation shows an⬃600-kb region surrounding thec-mybproto-oncogene on mouse chr.10. Four known genes on the locus are shown on top by solid rectangles with arrows that indicate their transcriptional orientation. Locations of viral integrations sites Mml1, Mml2, and Mml3 are shown. The area within the box, thec-mybgene through Mml1, is expanded in panel B. (B) Detailed analysis of the H3K4me3 distribution at thec-mybgene and the Mml1 region in cell line M1, M1 treated with IL-6 for 5 days, and cell lines with proviral integrations at Mml1 (30C-18 and 30-3-14) and Mml3 (30-2-7). The location of Mml1 is indicated by a red vertical arrow. (C) ChIP-on-chip data of H3K4me1 in M1 cells and detailed analysis of the H3K4me1 distribution in thec-myb5=end and Mml regions of the indicated cell lines. Tumor cell lines with integrations in Mml1 are 30C-18, 30A2-2-6, and 30-3-14. A tumor cell line with a provirus in Mml3 is 30-2-7. The locations of Mml1, Mml2, and Mml3 are indicated by red vertical arrows. Boxes in B and C depict the presence of major differences in enrichment between cells lines. Normalized enrichment data (IP/input ratio) are plotted on a log 2 scale.FIG 3Luciferase assays of potential enhancers in the Mml1 region. Three fragments (E1, E2, and E3) marked by H3K4me3 in the Mml1 region (A) were cloned separately upstream of thec-mybpromoter controlling a luciferase reporter gene (B) and transfected into NIH 3T3 and 293T cell lines. The green horizontal arrow shows the transcription orientation of the gene. One of the regions (E1) increases the luciferase transcription by 2- to 4-fold compared to the promoter-only control (C). Data are normalized to cotransfected Renilla gene expression. Error bars represent SD (n⫽3).
on November 7, 2019 by guest
http://jvi.asm.org/
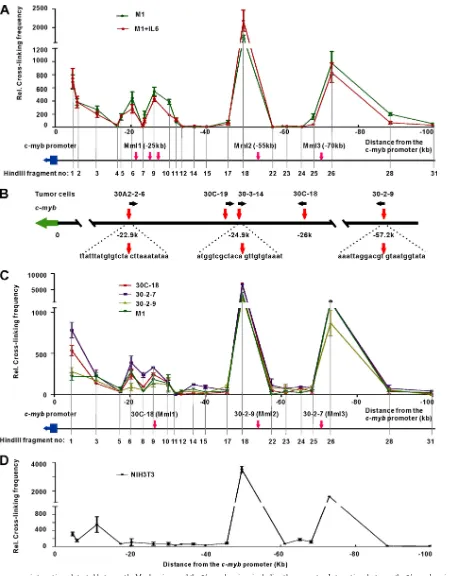
[image:4.585.72.514.68.329.2] [image:4.585.113.475.501.684.2]FIG 4Long-range interactions detected between the Mml regions and the 5=c-mybregion, including the promoter. Interactions between the 5=c-mybregion and regions up to⫺100 kb upstream were determined by 3C-qPCR. A HindIII fragment, including thec-mybpromoter, was used as the bait. (A) The 3C-qPCR assay was performed on differentiated (M1 plus IL-6) and undifferentiated M1 cells, and the data show the cross-linking frequency between the upstream regions and the bait fragment. The locations of HindIII fragments are indicated below the graph. Mml1, Mml2, and Mml3 regions are marked by red arrows. Data are normalized to the ERCC3 internal cross-linking control (means and standard errors of the means [SEM];n⫽3). (B) Sequences of retrovirus integration sites in tumor cell lines. Virus-chromosomal DNA junction sequences were determined by a shotgun cloning method as described previously (34). Genomic DNA was digested with MseI and ligated with an adaptor (the sequence is available upon request). PCR was carried out using a viral LTR primer and an adaptor primer to amplify the junction sequences, followed by TA cloning and sequencing. Virus integration site sequences in tumor cell lines are shown as indicated. Red vertical
on November 7, 2019 by guest
http://jvi.asm.org/
[image:5.585.69.518.70.646.2]fragment 9 (
⫺
26 kb). We have determined the
proviral/chromo-somal DNA junction sequences for proviruses within these two
Mml1 peaks. These sequences, from tumors (30A2-2-6 and
30-3-14), are presented in
Fig. 4B
, and virus insertion sites are depicted
by the three arrows in the Mml1 region in
Fig. 4A
. Many other
proviruses were mapped previously to the region by Southern blot
analysis (
16
). The other two strong interaction peaks,
correspond-ing to the Mml2 and Mml3 regions, were located at
⫺
50 kb
(frag-ment 18) and
⫺
73 kb (fragment 26). The interaction frequencies
of these sites are more than 4-fold higher than those of the Mml1
region. Similar to the peaks in the Mml1 region, these peaks in M1
cells did not change upon a differentiation-induced decrease in
c-myb
expression.
The 3C data in M1 cells suggest that provirus in the upstream
region comes close to the
c-myb
promoter through DNA loops
and thereby affects the oncogene transcription in
retrovirus-in-duced leukemia. To determine whether the provirus indeed
comes in close proximity to the
c-my
b promoter in tumors with
retrovirus integrations, we analyzed the spatial organization of the
c-myb
locus in tumor cells with proviruses in Mml1 (30C-18),
Mml2 (30-2-9), and Mml3 (30-2-7). The data show that the
pro-moter interaction regions overlap all three virus integration
re-gions in these cells (
Fig. 4C
). Our data indicate that in the nuclei of
the tumor cells, virus comes in close vicinity to the
c-myb
pro-moter through integration into preformed, stable loops.
The spatial organization of the
c-myb
locus was also examined
in NIH 3T3 cells, because this represents another tissue type, one
which does not express
c-myb
(
Fig. 4D
). Interestingly,
cross-link-ing frequency data for the Mml1 region indicate the absence of
interaction between the Mml1 region and the promoter in NIH
3T3 cells. However, cross-linking frequencies in the vicinities of
Mml2 and Mml3 are similar to that in M1 cells. Interestingly, the
cross-linking frequency between the third HindIII fragment (
⫺
11
kb) and the promoter was increased in NIH 3T3 cells compared to
M1 cells, indicating a new interaction that might be related to gene
silencing.
CTCF is recruited to the interaction regions.
The CTCF
pro-tein is a multivalent factor with widespread regulatory functions,
and it has been implicated in mediating intrachromosomal
con-tacts and looping (
29
). Here, we investigated the location of CTCF
binding in the mouse genomic
c-myb
locus to see if its binding fit
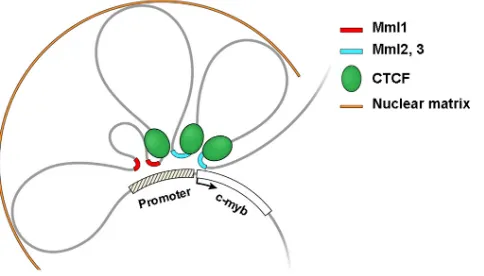
This study describes a new mechanism for gene activation by
ret-roviruses that insert in intergenic regions. We show here that
pro-viruses within 100 kb upstream of the
c-myb
gene in murine
my-eloid leukemias are inserted specifically at DNA sites that interact
with the 5=
region, including the promoter of the gene, through
looping (
Fig. 6
). Since a well-accepted mechanism of insertional
mutagenesis is enhancer insertion, the mechanism by which the
far-upstream proviruses activate
c-myb
may be a modification of
this mechanism (
22
,
27
). Since it was reported that differential
expression of
c-myb
is regulated by a transcriptional arrest
mech-anism in the first intron (
2
,
31
) and the bait used in the
confor-mation capture assay here included the promoter and a small part
of intron 1, we cannot rule out the possibility that the integrated
proviruses in the Mml regions act through prevention of
attenu-ation at the elongattenu-ation block.
Sequences in the LTR enhancer elements presumably are
re-sponsible for activation of gene transcription in these tumors. We
previously found that proviruses integrated in the Mml1 region
were deleted. The total size of some of the proviruses in 4 cases was
between 0.4 and 0.9 kb, and we know that the U3 LTR sequences
were present (
16
). This indicates that in some cases, in the absence
of structural genes, only an LTR remained in these proviruses.
Although such a model could be predicted based upon recent
studies that show that transcriptional activation in higher
eu-karyotes frequently involves the long-range action of regulatory
elements (
10
,
24
), this is the first time it has actually been shown
that the provirus is in a position to interact with the promoter
and/or control region in intron 1 through a 3-dimensional
chro-matin structure.
In this study, we applied a quantitative 3C assay that was
re-cently developed by Hagege et al. (
8
) to include TaqMan real-time
PCR technology, which provides accurate measurements of
cross-linking frequencies. Our 3C data show that all three Mml
integra-tion regions are close to the promoter by loop formaintegra-tion in M1
cells (
Fig. 4A
) and in tumor cell lines with provirus in these regions
(
Fig. 4C
). The Mml1 region contains 2 loops, giving a total of 4
loops, and provirus was found to be inserted in each of these loops.
Interestingly, M1 cells that are induced to differentiate with IL-6
and do not express appreciable levels of
c-myb
still maintain the
same chromatin looping structure observed in cells with active
transcription. Therefore, this chromatin looping structure is
in-arrows mark the virus integration sites. Black horizontal in-arrows indicate the orientation of retrovirus sequences inserted into the genome. A green solid rectangle with an arrow depicts thec-mybgene and its transcriptional orientation. (C) Long-range interactions detected between the 5=c-mybregion and Mml regions in tumor cells. 3C-qPCR assays were performed at the same time in M1 cells and tumor cell lines containing a provirus in one of the Mml regions. The upstream HindIII fragments examined in these experiments are indicated. Integration sites in tumor cell lines are marked by red arrows. The locations of integrated proviruses in cell lines 30C-18 (Mml1), 30-2-9 (Mml2), and 30-2-7 (Mml3) are depicted, and the genomic sequences at the virus-cell junctions are presented in panel B. The Mml3 location was previously determined by Southern blot analysis. Data are normalized to the ERCC3 internal cross-linking frequency control (means and SEM;n⫽3). (D) 3C-qPCR assay of NIH 3T3 cells. Data are normalized to the ERCC3 control (means and SEM;n⫽3).
on November 7, 2019 by guest
http://jvi.asm.org/
sufficient by itself for
c-myb
expression and may require addition
of transcription factors to result in expression. Examination of the
chromatin conformation in a nonhematopoietic cell line, NIH
3T3, which does not express
c-myb
, revealed that differences in the
looping structure at the
c-myb
locus exist in different cell types.
Apparently, a novel interaction peak that is not found in the
he-matopoietic cells was present very close to the promoter at
ap-proximately
⫺
11 kb. The fact that looping structures vary
be-tween tissues is supported by a recent finding showing that murine
erythroid cells have a different pattern of looping than we found
here in myeloid cells (
36
).
The finding that CTCF binds in the vicinity of the looping
structure is not surprising, in that it is known that CTCF
contrib-utes to looping associated with gene activation (
12
,
29
). Although
we discovered 4 dominant promoter-interacting loops, only 3
were associated with CTCF (
Fig. 5B
). The most proximal loop was
FIG 5CTCF is recruited to the promoter interaction regions. (A) ChIP-on-chip experiment using antibody specific for CTCF and the microarray described in the legend toFig. 2were performed on the indicated cell lines. Red vertical arrows indicate Mml1, Mml2, and Mml3. (B) Detailed locations of CTCF binding sites and the chromosome structure of thec-myblocus in M1 cells. 3C-qPCR data of thec-myblocus in M1 cells (details are given in the legend toFig. 4). Potential matrix attachment regions (MARs) were predicted within a 100-kb region upstream ofc-mybby the online program MARWIZ (http://genomecluster.secs .oakland.edu/marwiz).In silicodata show that potential MARs are located at the boundaries of the loops identified in the 3C assay (alignments are shown by dotted lines).on November 7, 2019 by guest
http://jvi.asm.org/
[image:7.585.112.471.64.555.2]not associated with this DNA binding protein. Interestingly,
oth-ers have shown that enhancer and promoter sites are often bound
by cohesin and mediator complexes in the absence of CTCF (
14
).
Matrix attachment regions (MARs) are evolutionarily conserved
genome sequences that anchor DNA to the nuclear matrix and are
reported to act as boundary elements for chromatin functional
domains (
23
). The MARWIZ online program was used to predict
potential MARs within the region 100 kb upstream of
c-myb
in M1
cells.
In silico
data show that potential MARs are located at the
boundaries of the loops identified in the 3C assay (
Fig. 5B
).
Integration at a site in the genome can be a consequence of both
target site selection and clonal selection, and it would be reasonable to
imagine that both play a role in the far-upstream region of
c-myb
.
When murine leukemia virus (MLV) site selection is studied
in vitro
,
in the absence of clonal selection, it has been shown that these viruses
have preferences not only for the vicinity of the 5=
ends but also for
insertion within a kilobase of DNase hypersensitivity sites (
4
,
19
).
This suggests that there is a preference for intergenic regions that are
involved in active transcription.
Here, we mapped histone H3 modification sites in the
c-myb
upstream region to identify regulatory elements that might exist in
normal cells. Using ChIP-on-chip, we found that Mml integration
regions in myeloid cells contain active histone modifications,
es-pecially H3K4me1 and H3K4me3, which are hallmarks of
enhanc-ers (
11
). The enrichment of these marks was correlated with
c-myb
expression in the cell lines that we examined, indicating that
c-myb
is regulated from a distance in myeloblastic M1 cells. Interestingly,
long-range regulation from upstream sequences of
c-myb
has been
suggested by others who reported that a transgene integrated
ap-proximately 77 kb upstream of the
c-myb
disrupts sequences that
regulate
c-myb
gene expression in megakaryocyte/erythrocyte
lin-eage-restricted progenitor cells (
25
). In addition, studies on the
human
HBS1L-MYB
intergenic interval associated with elevated
fetal hemoglobin (HbF) levels suggest that the HBS1L-MYB
inter-genic region contains regulatory sequences that could be
impor-tant in hematopoiesis by controlling
MYB
expression (
38
).
We did not observe a significant change in
repression-associ-ated histone modifications (H3K27me3 and H3K9me3) with
downregulation of
c-myb
(data not shown). Perhaps these
modi-fications are more generally involved in bivalent stem cell states
We thank Richard Koller in our laboratory for assistance in tumor cell culturing and Sam John and Ofir Hakim, Laboratory of Receptor Biology and Gene Expression, for their much valued and excellent advice.
The work was supported by the Intramural Program at the National Cancer Institute, Center for Cancer Research. J.M. was partially sup-ported by grant 2/0135/09 from the Slovak Grant Agency VEGA.
REFERENCES
1.Barski A, et al.2007. High-resolution profiling of histone methylations in the human genome. Cell129:823– 837.
2.Bender TP, Thompson CB, Kuehl WM.1987. Differential expression of c-myb mRNA in murine B lymphomas by a block to transcription elon-gation. Science237:1473–1476.
3.Clappier E, et al.2007. The C-MYB locus is involved in chromosomal translocation and genomic duplications in human T-cell acute leukemia (T-ALL), the translocation defining a new T-ALL subtype in very young children. Blood110:1251–1261.
4.Daniel R, Smith JA.2008. Integration site selection by retroviral vectors: molecular mechanism and clinical consequences. Hum. Gene Ther.19: 557–568.
5.Dekker J, Rippe K, Dekker M, Kleckner N.2002. Capturing chromo-some conformation. Science295:1306 –1311.
6.Drabsch Y, et al.2007. Mechanism of and requirement for estrogen-regulated MYB expression in estrogen-receptor-positive breast cancer cells. Proc. Natl. Acad. Sci. U. S. A.104:13762–13767.
7.Greig KT, Carotta S, Nutt SL.2008. Critical roles for c-Myb in hemato-poietic progenitor cells. Semin. Immunol.20:247–256.
8.Hagege H, et al.2007. Quantitative analysis of chromosome conforma-tion capture assays (3C-qPCR). Nat. Protoc.2:1722–1733.
9.Haviernik P, et al.2002. Linkage on chromosome 10 of several murine retroviral integration loci associated with leukaemia. J. Gen. Virol.83: 819 – 827.
10. Heintzman ND, et al.2009. Histone modifications at human enhancers reflect global cell-type-specific gene expression. Nature459:108 –112. 11. Heintzman ND, et al.2007. Distinct and predictive chromatin signatures
of transcriptional promoters and enhancers in the human genome. Nat. Genet.39:311–318.
12. Hou CH, Zhao H, Tanimoto K, Dean A.2008. CTCF-dependent en-hancer-blocking by alternative chromatin loop formation. Proc. Natl. Acad. Sci. U. S. A.105:20398 –20403.
13. Hugo H, et al.2006. Mutations in the MYB intron I regulatory sequence increase transcription in colon cancers. Genes Chromosomes Cancer45: 1143–1154.
14. Kagey MH, et al.2010. Mediator and cohesin connect gene expression and chromatin architecture. Nature467:430 – 435.
15. Koch CM, et al.2007. The landscape of histone modifications across 1% of the human genome in five human cell lines. Genome Res.17:691–707. 16. Koller R, et al.1996. Mml1, a new common integration site in murine leukemia virus-induced promonocytic leukemias maps to mouse chro-mosome 10. Virology224:224 –234.
17. Kouzarides T.2007. Chromatin modifications and their function. Cell 128:693–705.
18. Lahortiga I, et al.2007. Duplication of the MYB oncogene in T cell acute lymphoblastic leukemia. Nat. Genet.39:593–595.
19. Lewinski MK, et al.2006. Retroviral DNA integration: viral and cellular determinants of target-site selection. PLoS Pathog.2:611– 622. doi: 10.1371/journal.ppat.0020060.
20. Liebermann DA, Hoffman-Liebermann B.1989. Proto-oncogene ex-FIG 6Model of the long-range interactions between retrovirus integration
regions and the 5=end ofc-mybin tumor cells. Proviruses in Mml1 (red lines) or Mml2 and Mml3 (blue lines) come in close proximity to the 5=-end regu-latory region of the gene by DNA looping. CTCF binding near the interaction regions is suggested to be involved in the looping formation. Potential MARs were found at the boundaries of the looping structure.
on November 7, 2019 by guest
http://jvi.asm.org/
[image:8.585.44.286.67.205.2]pression and dissection of the myeloid growth to differentiation develop-mental cascade. Oncogene4:583–592.
21. Lieu YK, Reddy EP.2009. Conditional c-myb knockout in adult hema-topoietic stem cells leads to loss of self-renewal due to impaired prolifer-ation and accelerated differentiprolifer-ation. Proc. Natl. Acad. Sci. U. S. A.106: 21689 –21694.
22. Maeda N, Fan H, Yoshikai Y.2008. Oncogenesis by retroviruses: old and new paradigms. Rev. Med. Virol.18:387– 405.
23. Mirkovitch J, Mirault ME, Laemmli UK. 1984. Organization of the higher-order chromatin loop: specific DNA attachment sites on nuclear scaffold. Cell39:223–232.
24. Morse RH.2010. Epigenetic marks identify functional elements. Nat. Genet.42:282–284.
25. Mukai HY, et al.2006. Transgene insertion in proximity to the c-myb gene disrupts erythroid-megakaryocytic lineage bifurcation. Mol. Cell. Biol.26:7953–7965.
26. Nason-Burchenal K, Wolff L.1993. Activation of c-myb is an early bone-marrow event in a murine model for acute promonocytic leukemia. Proc. Natl. Acad. Sci. U. S. A.90:1619 –1623.
27. Neel BG, Hayward WS, Robinson HL, Fang J, Astrin SM.1981. Avian leukosis virus-induced tumors have common proviral integration sites and synthesize discrete new RNAs: oncogenesis by promoter insertion. Cell23:323–334.
28. Paul TA, Bies J, Small D, Wolff L.2010. Signatures of polycomb repres-sion and reduced H3K4 trimethylation are associated with p15INK4b DNA methylation in AML. Blood115:3098 –3108.
29. Phillips JE, Corces VG.2009. CTCF: master weaver of the genome. Cell 137:1194 –1211.
30. Ramsay RG, Gonda TJ.2008. MYB function in normal and cancer cells. Nat. Rev. Cancer8:523–534.
31. Reddy CD, Reddy EP.1989. Differential binding of nuclear factors to the intron 1 sequences containing the transcriptional pause site correlates with c-myb expression. Proc. Natl. Acad. Sci. U. S. A.86:7326 –7330.
32. Schmidt M, Nazarov V, Stevens L, Watson R, Wolff L.2000. Regulation of the resident chromosomal copy of c-myc by c-Myb is involved in my-eloid leukemogenesis. Mol. Cell. Biol.20:1970 –1981.
33. Shen-Ong GL, Wolff L.1987. Moloney murine leukemia virus-induced myeloid tumors in adult BALB/c mice: requirement of c-myb activation but lack of v-abl involvement. J. Virol.61:3721–3725.
34. Slape C, et al.2007. Retroviral insertional mutagenesis identifies genes that collaborate with NUP98-HOXD13 during leukemic transformation. Cancer Res.67:5148 –5155.
35. Splinter E, et al.2006. CTCF mediates long-range chromatin looping and local histone modification in the beta-globin locus. Genes Dev.20:2349 – 2354.
36. Stadhouders R, et al.2011. Dynamic long-range chromatin interactions control Myb proto-oncogene transcription during erythroid develop-ment. EMBO J.31:986 –999.
37. Thompson MA, Flegg R, Westin EH, Ramsay RG.1997. Microsatellite deletions in the c-myb transcriptional attenuator region associated with over-expression in colon tumour cell lines. Oncogene14:1715–1723. 38. Wahlberg K, et al.2009. The HBS1L-MYB intergenic interval associated
with elevated HbF levels shows characteristics of a distal regulatory region in erythroid cells. Blood114:1254 –1262.
39. Wang Z, et al.2009. Genome-wide mapping of HATs and HDACs reveals distinct functions in active and inactive genes. Cell138:1019 –1031. 40. Wolff L. 1996. Myb-induced transformation. Crit. Rev. Oncogenesis
7:245–260.
41. Wolff L, Koller R, Davidson W.1991. Acute myeloid leukemia induction by amphotropic murine retrovirus (4070A): clonal integrations involve c-myb in some but not all leukemias. J. Virol.65:3607–3616.
42. Wolff L, Mushinski JF, Shen-Ong GL, Morse HC, III.1988. A chronic inflammatory response. Its role in supporting the development of c-myb and c-myc related promonocytic and monocytic tumors in BALB/c mice. J. Immunol.141:681– 689.
on November 7, 2019 by guest
http://jvi.asm.org/