October 2016
National Evaluation of the Troubled Families
Programme: National Impact Study Report
Findings from the Analysis of National Administrative Data
and local data on programme participation
© Queen’s Printer and Controller of Her Majesty’s Stationery Office, 2016 Copyright in the typographical arrangement rests with the Crown.
You may re-use this information (not including logos) free of charge in any format or medium, under the terms of the Open Government Licence. To view this licence, visit
http://www.nationalarchives.gov.uk/doc/open-government-licence/version/3/ or write to the Information Policy Team, The National Archives, Kew, London TW9 4DU, or e-mail: psi@nationalarchives.gsi.gov.uk.
This document/publication is also available on our website at www.gov.uk/dclg
If you have any enquiries regarding this document/publication, complete the form at http://forms.communities.gov.uk/ or write to us at:
Department for Communities and Local Government Fry Building
2 Marsham Street London
SW1P 4DF
Telephone: 030 3444 0000
For all our latest news and updates follow us on Twitter: https://twitter.com/CommunitiesUK
October 2016
Contents
Acknowledgments 15
The Authors 16
Abbreviations 17
Executive summary 18
Aims 18
Key findings 20
Generalising the analysis 21
Introduction 24
The Troubled Families programme 24
The evaluation 26
Overview of research 26
Purpose of the report 26
Caveats 27
Report outline 27
Data 29
Overview of data sources 29
Programme data 29
Contents and coverage 29
Limitations 32
Response to known limitations 33
National pupil database 33
Limitations 34
Responses to known limitations 35
Police national computer 36
Contents and coverage 36
Limitations 36
Responses to known limitations 37
Work and pensions longitudinal study 37
Coverage 37
Limitations and responses 38
Data linking 38
Unmatched individuals 42
Assigning the comparison group to a pseudo-start date 42
Characteristics of participants 45
Introduction 45
Timing and nature of participation 46
Screening 46
National criteria met 47
Starting on the programme 50
The recording of end dates 53
Programme length and intensity 54
Regional distribution and area characteristics 55
Family characteristics 56
Personal characteristics 58
History prior to programme start 59
Family history prior to programme start 59
Personal history prior to programme start 61
Observed outcomes 65
Individual-level outcomes 67
Summary 70
Methods 72
Introduction 72
Propensity score matching 73
Description of methods 73
Assumptions 73
Common support 75
Types of matching 75
Matching variables 76
Testing whether the assumptions were met 78
Summary of findings from assumption testing 99
Waiting list analysis 100
Description of methods 100
Assumptions 100
Control variables 101
Testing whether the assumptions were met 103
Results from propensity score matching 104
Introduction 104
Effects of programme on benefit receipt 104
Effects of programme on employment 107
Effects of programme on educational participation 108
Effects of programme on child welfare 110
Effect of programme on offending 111
Summary 115
Introduction 126
Effects of programme on benefit receipt 127
Effects of programme on employment 131
Effects of programme on child welfare 133
Effect of programme on offending 134
Summary 141
Conclusions 142
Introduction 142
Interpreting the findings 142
Overview of main findings 144
Effects of programme on benefit receipt and employment 144
Effects of programme on educational participation 145
Effects of programme on child welfare 145
Effect of programme on adult offending 146
Effect of programme on child offending 146
Limitations of the analysis and suggestions for future analyses 147
Appendix A: Data questionnaire 151
Appendix B: Impact estimates for families that received the intensive version of the
programme 152
Appendix C: Impact estimates using the expanded comparison group 157
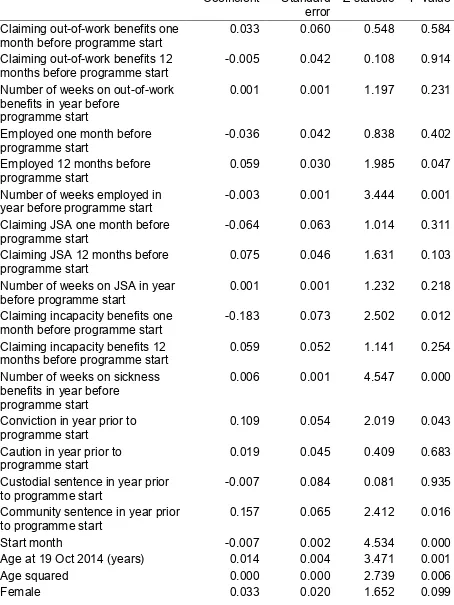
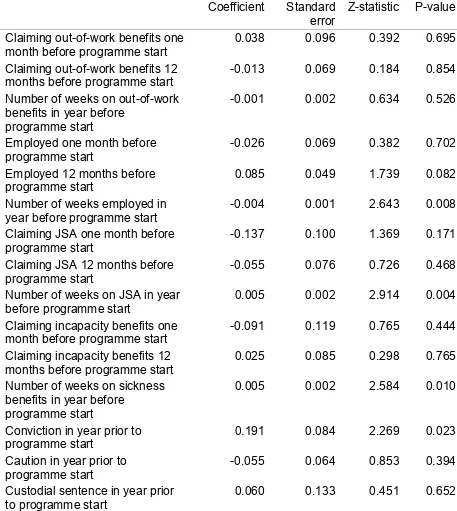
Appendix D: Propensity score estimation 161
Appendix E: Impact estimates using radius matching 177
Appendix F: Impact estimates using Local Linear Regression matching 182
Appendix H: Impact estimates for the sample of areas where start order random 191
Appendix I: Pre-programme tests using kernel matching 195
Appendix J: Waiting list analysis for the sample of areas where start order random 199
Annex A: Local authority data cleaning and checking 209
Overview 209
Data checking and cleaning 210
Unmatched NPD and WPLS data 219
Summary 220
Additional data checks 222
Missing NPD data in LA5 222
Recoding of treatment and comparison groups 245
List of Tables and figures
Table 1 Coverage of the data extract 31
Table 2 Percentage of records complete in the raw data 33
Table 3 Time period covered by each of the NPD datasets 35
Table 4 Data requested from departments 39
Table 5 Matched sample - Adults 40
Table 6 Matched sample - Children 40
Table 7 Matched sample for treatment and comparison groups - Adults 41 Table 8 Matched sample for treatment and comparison groups - Children 41 Table 9 Matched sample for treatment and comparison group families 41 Table 10 Assumptions made where outcomes (or history) not observed 42
Figure 1 Comparison of actual and pseudo-start dates 43
Table 11 Percentage of sample with recorded screening date 46
Table 12 Distribution of screening dates for families 47
Table 13 Percentage of families meeting each of the national criteria 49 Table 14 Percentage of treatment group with recorded start date 51
Table 15 Distribution of recorded start dates 52
Table 16 Percentage of treatment group with recorded end date 53
Table 17 Distribution of end dates 54
Table 18 Distribution of recorded end dates relative to start dates 55
Table 19 Area characteristics 56
Table 20 Family characteristics 57
Table 21 Age, gender and ethnic composition of families 58
Table 22 Age 58
Table 23 Gender, ethnicity and family membership 59
Table 24 Maximum absence rate for any child within family 60 Table 25 Family exclusions, welfare, benefits and employment history 60 Table 26 Family history of SEN or receipt of free school meals 61
Table 27 Family offending history 61
Table 28 Absence history 62
Table 29 Persistent absence, exclusions and child welfare 62 Table 30 History of SEN and receipt of free school meals 62
Table 31 History of claiming benefits 63
Table 33 Offending history 64 Table 34 History of committing particular types of offence 64 Table 35 Family-level outcomes for absence, exclusions, child welfare and benefit receipt
66
Table 36 Family-level offending outcomes 67
Table 37 Absence, exclusions, child welfare, benefit receipt and employment outcomes 68
Table 38 Educational attainment outcomes 69
Table 39 Offending outcomes 70
Table 40 Balance between treatment and comparison groups after PSM kernel matching for benefits and offending sample - adults observed for 12 months following programme
start 80
Table 41 Balance between treatment and comparison groups after PSM kernel matching for employment sample - adults observed for 12 months following programme start 83 Table 42 Balance between treatment and comparison groups after PSM kernel matching for benefits and offending sample - adults observed for 18 months following programme
start 85
Table 43 Balance between treatment and comparison groups after PSM kernel matching for employment sample - adults observed for 18 months following programme start 87 Table 44 Balance between treatment and comparison groups after PSM for offending sample - children observed for 12 months following programme start 89 Table 45 Balance between treatment and comparison groups after PSM with kernel
matching estimator for absence sample - children observed for 12 months following
programme start 91
Table 46 Balance between treatment and comparison groups after PSM with kernel matching estimator for exclusions sample - children observed for 12 months following
programme start 93
Table 47 Number of children undergoing Key Stage Assessments following participation in
the Troubled Families programme 94
Table 48 Balance between treatment and comparison groups after PSM with kernel matching estimator for child welfare sample - children observed for 12 months following
programme start 96
Table 49 Balance between treatment and comparison groups after PSM - children
observed for 18 months following programme start 98
Table 50 PSM Benefit impact estimates for adults, kernel matching 106 Table 51 PSM Employment impact estimates for adults, kernel matching 108 Table 52 PSM Absence impact estimates for children, kernel matching 109 Table 53 PSM 12-month impact estimates for children, child welfare kernel matching 111 Table 54 PSM Offending impact estimates for adults, kernel matching 112 Table 55 PSM offending impact estimates for children, kernel matching 114
Table 57 Waiting list analysis adults - 12-month impact estimates for out-of-work benefits 128 Table 58 Waiting list analysis adults - 18-month impact estimates for out-of-work benefits
128 Table 59 Waiting list analysis adults - 12-month impact estimates for JSA 128 Table 60 Waiting list analysis adults - 18-month impact estimates for JSA 129 Table 61 Waiting list analysis adults - 12-month impact estimates for incapacity benefits
129 Table 62 Waiting list analysis adults - 18-month impact estimates for incapacity benefits
130 Table 63 Waiting list analysis adults - 12-month impact estimates for employment 132 Table 64 Waiting list analysis adults - 18-month impact estimates for employment 132 Table 65 Waiting list analysis children - 12-month impact estimates for child welfare 133 Table 66 Waiting list analysis adults - 12-month impact estimates for offending 135 Table 67 Waiting list analysis adults - 18-month impact estimates for offending 135 Table 68 Waiting list analysis adults - 12-month impact estimates for community sentences 135 Table 69 Waiting list analysis adults - 18-month impact estimates for community sentences 136 Table 70 Waiting list analysis adults - 12-month impact estimates for custodial sentence
136 Table 71 Waiting list analysis adults - 18-month impact estimates for custodial sentence
137 Table 72 Waiting list analysis children - 12-month impact estimates for offending 137 Table 73 Waiting list analysis children - 18-month impact estimates for offending 138 Table 74 Waiting list analysis children - 12-month impact estimates for community
sentences 138
Table 75 Waiting list analysis children - 18-month impact estimates for community
sentences 139
Table 84 PSM benefits impact estimates, kernel matching 157 Table 85 PSM employment impact estimates, kernel matching 158 Table 86 PSM 12-month impact estimates for absence, kernel matching 158 Table 87 PSM 12-month impact estimates for child welfare, kernel matching 159 Table 88 PSM offending impact estimates for adults, kernel matching 159 Table 89 PSM offending impact estimates for children, kernel matching 160 Table 90 Propensity score estimation for adults where benefit and offending outcomes are
observed for 12 months following programme start 161
Table 91 Propensity score estimation for adults where employment outcomes are
observed for 12 months following programme start 162
Table 92 Propensity score estimation for adults where benefits and offending outcomes
are observed for 18 months following programme start 164
Table 93 Propensity score estimation for adults where employment outcomes are
observed for 18 months following programme start 166
Table 94 Propensity score estimation for children where offending outcomes are observed
for 12 months following programme start 167
Table 95 Propensity score estimation for children where absence outcomes are observed
for 12 months following programme start 169
Table 96 Propensity score estimation for children where exclusion outcomes are observed
for 12 months following programme start 171
Table 97 Propensity score estimation for children where child welfare outcomes are
observed for 12 months following programme start 173
Table 98 Propensity score estimation for children where offending outcomes are observed
for 18 months following programme start 175
Table 99 PSM benefit impact estimates, radius matching 177 Table 100 PSM employment impact estimates, radius matching 178 Table 101 PSM 12-month absence impact estimates, radius matching 179 Table 102 PSM 12-month impact estimates for child welfare, radius matching 179 Table 103 PSM 12-month impact estimates for adult offending, radius matching 180 Table 104 PSM 12-month impact estimates for child offending, radius matching 181 Table 105 PSM benefit impact estimates for adults, LLR matching 182 Table 106 PSM employment impact estimates, LLR matching 183 Table 107 PSM 12-month impact estimates for absence, LLR matching 184 Table 108 PSM 12-month impact estimates for child welfare, LLR matching 184 Table 109 PSM 12-month impact estimates for adult offending, LLR matching 185 Table 110 PSM 12-month impact estimates for child offending LLR 186 Table 111 PSM 12-month benefit impact estimates for adults, reduced bandwidth kernel
Table 112 PSM 12-month employment impact estimates for adults, reduced bandwidth
kernel matching 188
Table 113 PSM 12-month impact estimates for absence, reduced bandwidth kernel
matching 188
Table 114 PSM 12-month impact estimates for children, child welfare reduced bandwidth
kernel matching 189
Table 115 PSM 12-month impact estimates for adult offending, reduced bandwidth kernel
matching 189
Table 116 PSM 12-month impact estimates for child offending, reduced bandwidth kernel
matching 190
Table 117 PSM benefit impact estimates, kernel matching 191 Table 118 PSM employment impact estimates, kernel matching 192 Table 119 PSM 12-month impact estimates for absence, kernel matching 192 Table 120 PSM 12-month impact estimates for child welfare, kernel matching 193 Table 121 PSM impact estimates for adult offending, kernel matching 193 Table 122 PSM impact estimates for child offending, kernel matching 194 Table 123 PSM pre-programme tests for benefits, kernel matching 195 Table 124 PSM pre-programme tests for employment, kernel matching 196 Table 125 PSM pre-programme tests for absence, kernel matching 196 Table 126 PSM pre-programme tests for child welfare, kernel matching 197 Table 127 PSM pre-programme tests for adult offending, kernel matching 197 Table 128 PSM 12-month impact estimates for child offending, kernel matching 198 Table 129 Waiting list analysis adults – 12-month impact for out-of-work benefits 199 Table 130 Waiting list analysis adults – 18-month impact estimates for out-of-work benefits 199 Table 131 Waiting list analysis adults - 12-month impact estimates for JSA 200 Table 132 Waiting list analysis adults - 18-month impact estimates for JSA 200 Table 133 Waiting list analysis adults - 12-month impact estimates for incapacity benefits
200 Table 134 Waiting list analysis adults - 18-month impact estimates for incapacity benefits
201 Table 135 Waiting list analysis adults - 12-month impact estimates for employment 201 Table 136 Waiting list analysis adults - 18-month impact estimates for employment 202 Table 137 Waiting list analysis children - 12-month impact estimates for child welfare 202 Table 138 Waiting list analysis adults - 12-month impact estimates for offending 202 T able 139 Waiting list analysis adults - 18-month impact estimates for offending 203 Table 140 Waiting list analysis adults - 12-month impact estimates for community
Table 141 Waiting list analysis adults - 18-month impact estimates for community
sentence 204
Table 142 Waiting list analysis adults - 12-month impact estimates for custodial sentence 204 Table 143 Waiting list analysis adults - 18-month impact estimates for custodial sentence
205 Table 144 Waiting list analysis children - 12-month impact estimates for offending 205 Table 145 Waiting list analysis children - 18-month impact estimates for offending 206 Table 146 Waiting list analysis children - 12-month impact estimates for community
sentences 206
Table 147 Waiting list analysis children - 18-month impact estimates for community
sentences 207
Table 148 Waiting list analysis children - 12-month impact estimates for custodial
sentences 207
Table 149 Waiting list analysis children - 18-month impact estimates for custodial
sentences 208
Table 150 Data checking and cleaning steps 211
Table 151 Impact of data cleaning on the treatment and comparison group samples, by
area 217
Table 152 Cases excluded from WPLS and NPD data extracts 219
Table 153 Number of cases matched to each dataset 220
Table 159 to Table 164 compare the main impact analysis findings using the final dataset and data which exclude LA5. The results remain statistically insignificant when LA5 is
excluded from the analysis. 222
Table 154 Balance between treatment and comparison groups after PSM kernel matching for benefits and offending sample - adults observed for 12 months following programme
start 223
Table 155 Balance between treatment and comparison groups after PSM kernel matching for employment sample - adults observed for 12 months following programme start 226 Table 156 Balance between treatment and comparison groups after PSM for offending sample - children observed for 12 months following programme start 229 Table 157 Balance between treatment and comparison groups after PSM with kernel matching estimator for absence sample - children observed for 12 months following
programme start 232
Table 158 Balance between treatment and comparison groups after PSM with kernel matching estimator for child welfare sample - children observed for 12 months following
programme start 235
Table 163 PSM Absence impact estimates for children, kernel matching 243 Table 164 PSM 12-month impact estimates for children, child welfare kernel matching 244 Table 165 Balance between treatment and comparison groups after PSM kernel matching for benefits and offending sample - adults observed for 12 months following programme
start 246
Table 166 Balance between treatment and comparison groups after PSM kernel matching for employment sample - adults observed for 12 months following programme start 249 Table 167 Balance between treatment and comparison groups after PSM for offending sample - children observed for 12 months following programme start 252 Table 168 Balance between treatment and comparison groups after PSM with kernel matching estimator for absence sample - children observed for 12 months following
programme start 255
Table 169 Balance between treatment and comparison groups after PSM with kernel matching estimator for child welfare sample - children observed for 12 months following
programme start 258
Acknowledgments
The authors would like to thank all the staff at participating local authorities who assisted with the supply of data for this study, and in particular the ten areas that provided detailed information on the data that they held on families as part of a preliminary consultation exercise which was used to inform data collection. Staff at the Department for
Communities and Local Government (DCLG) supported the data collection exercise and, as well as DCLG analysts and the Troubled Families Team, the authors would like to thank Rita Collins, who provided guidance on legal matters.
A number of people within the Department for Education (DfE), Department for Work and Pensions (DWP) and the Ministry of Justice (MoJ) provided advice and assistance in gaining access to the national administrative datasets. Particular thanks are due to Richard White and Chris Douglass at DfE, Sharon Moore and Lee Irving at DWP and Sheila Ladva, Melissa Wingfield and Yu Zhang at MoJ.
The authors would also like to thank the other members of the research consortium
involved in evaluating the impact of the Troubled Families programme for the support and guidance that they provided throughout the study. Susan Purdon (from Bryson-Purdon Social Research) and Marjorie Smith (from UCL Institute of Education) provided helpful comments on early drafts of the analyses and Laurie Day (Ecorys) gave invaluable insights into the findings from the other strands of the evaluation.
The evaluation was also the subject of an independent peer review process. Anna Vignoles (University of Cambridge) and Jo Blanden (University of Surrey) provided extremely helpful and constructive comments.
Finally, we would like to acknowledge the contribution of our colleagues at the National Institute of Economic and Social Research (NIESR). Jake Anders provided assistance in developing the measures of educational attainment and Alex Bryson and Richard Dorsett offered helpful advice on the methodology.
The authors
Helen Bewley is a Principal Research Fellow at NIESR. Over the past 17 years she has evaluated the impact of numerous government interventions using a variety of techniques to identify causal impact. Past projects have included the evaluation of Pathways to Work for incapacity benefits claimants, the introduction of Jobcentre Plus, an evaluation of different types of Community Order requirements and the Employment and Retention and Advancement project; the UK’s largest ever random assignment programme to assess the impact of a social policy.
Anitha George is a Research Fellow at NIESR. She has previously worked on process and impact evaluations for a number of government programmes, such as the Work
Programme, Day One mandation of prison leavers to the Work Programme and the Better-off in Work Credit. As well as having a good foundation in quantitative methods she is an experienced qualitative researcher with expertise in a range of qualitative techniques.
Cinzia Rienzo is a Research Fellow at NIESR, where she carries out applied econometric research on issues such as education, migration, the labour market and development. Past projects have included the evaluation of Mind the Gap and Changing Mindsets: randomised control trials of interventions to increase attainment by disadvantaged children in the UK. She is currently leading the evaluation of Powerful Learning Conversation intervention.
Abbreviations
CIN Child In Need CLA Child Looked After
DCLG Department for Communities and Local Government DfE Department for Education
DWP Department for Work and Pensions ESA Employment Support Allowance HMRC Her Majesty’s Revenue and Customs IB Incapacity Benefit
IS Income Support
IMD Index of Multiple Deprivation JSA Jobseeker's Allowance LA Local Authority
LLR Local Linear Regression MSB Mean Standardised Bias MoJ Ministry of Justice
NPD National Pupil Database PbR Payment by Results PNC Police National Computer PSM Propensity Score Matching SDA Severe Disability Allowance
Executive summary
Aims
The purpose of the analysis upon which this report is based was to estimate the impact of participation in the initial phase of the Troubled Families programme on a range of
outcomes encompassing benefit receipt, employment, educational participation, child welfare and offending. This analysis estimates the impact of programme participation on these outcomes, relative to non-participation. That is, the findings that overall participation in the programme had no significant or systemic impact does not mean that there were no changes in the relevant outcomes for families; simply that any changes (positive or
negative) cannot be attributed to participation in the programme, because similar changes were observed for comparable non-participants. In other words, participation in the
programme did not in itself result in or cause any change in outcomes. This applies to all impact estimates described below. This report should be read alongside the separate and independent analysis of the impact of participation in the Troubled Families programme using survey data.1 This analysis, which uses administrative data, is consistent with the analysis of the survey data.
The data used in this analysis was compiled from information provided by local authorities and from national administrative datasets covering tax and benefits receipt, offending, educational attainment, schooling and child social care. Information provided by local authorities allowed records for individuals to be linked together to build up a detailed picture of family circumstances prior to starting on the programme and outcomes following entry. The main advantage of using administrative data was that it provided information on a larger sample of families than would have been possible if it had been necessary to survey Troubled Families programme participants. However, the use of partial and incomplete data, reflecting in part the novel nature of the process for local authorities, means that there are a number of caveats attached to the findings.
Data issues and caveats
56 local authorities provided the data used in this study between October and November 2014.2 These data were then matched to national level administrative datasets. Data were obtained on approximately 25 per cent of the 120,000 families that participated in the programme, representing a large sample, and enabling us to undertake detailed analysis. However, the data supplied were of variable quality. As a result, some important data were missing, and it was necessary to make certain assumptions in assigning individuals to treatment and control groups. In addition, a significant number of individuals were not
1 Evaluation of the Troubled Familied Programme, “Impact evaluation using survey data”, Susan Purdon and Caroline Bryson.
matched to certain of the administrative datasets, and this necessitated further assumptions – for example, we assume that individuals not matched to employment records were not employed.3 Further details are set out in the data chapter and in Annex A.
It is possible that in some cases these assumptions did not reflect the true circumstances of particular families and, as a result, the findings may be subject to measurement error. However, as long as the prevalence of missing or incomplete data is random and/or does not differ systematically between the treated and control groups, the conclusions will remain unbiased. None of the available evidence suggests that such systematic
differences exist, and the possibility of significant bias therefore appears unlikely. The fact that separate analysis, using survey data, produces results consistent with our analysis is further evidence that any bias that would impact our results to a significant degree is unlikely. However, given the data issues this possibility cannot be entirely excluded. It is not possible to say with certainty how this might affect the reported results.
Methods
Local authorities were asked to supply information on all those families who met at least two of the national eligibility criteria for the programme. Thus, local authorities were asked to provide information on a comparison group of families that fell just below the eligibility threshold for the programme, as well as those who actually started on the programme following its introduction in April 2012.
The three national criteria covered anti-social behaviour or youth offending, worklessness and child truancy or exclusion. Families were only eligible for the programme if they met three national criteria, or two of the national criteria plus local discretionary criteria. The local criteria were designed to identify families that resulted in high costs to the taxpayer. Two methods were used to estimate the causal impact of the Troubled Families
programme. The main focus in the report is on the analysis which uses a technique known as propensity score matching (PSM), as it is thought that this was most likely to be robust in the current application. Both approaches seek to estimate what could have been
expected to happen to members of families that participated in the programme if they had not taken part, so that observed outcomes following participation in the programme for this group of families can be compared against this estimate. PSM matches those subject to the programme to a comparison group of families that have a similar propensity to be treated, based on their observed characteristics, but who do not in fact receive assistance. Provided the two groups are matched on all characteristics which determine both whether the family participates in the programme and which impact on the outcomes that they experience as a result of participation, the impact estimate should provide an accurate and unbiased estimate of the true impact of the intervention. The analysis used a number of different ways of selecting matches for participating families and also explored the
sensitivity of the results to including families that started on the programme at a later point in time as a comparison group for families that were offered support at an earlier date. The impact of the programme on families that were offered more intensive support was also explored.
PSM is the standard technique used to estimate impact in programme evaluation when, as here, a randomised control trial was not feasible, and was therefore considered
appropriate here. However, as is generally the case with impact evaluation for which a randomly selected control group does not exist, it is impossible to exclude entirely that there were systematic differences between the two groups that are not observed in the available data, which could potentially bias the results.
A supplementary analysis exploited the fact that families started on the programme at different points in time. This was known as the waiting list analysis. Those who started on the programme at a later date were used as a comparison group for families that started earlier, with outcomes for the comparison group observed in the period before they started to receive support.
Key findings
The key finding is that across a wide range of outcomes, covering the key headline objectives of the programme - employment, benefit receipt, school attendance, safeguarding and child welfare - we were unable to find consistent evidence that the Troubled Families programme had any significant or systematic impact. That is to say, our analysis found no impact on these outcomes attributable to the programme. The vast majority of impact estimates were statistically insignificant, with a very small number of positive or negative results. These results are consistent with those found by the separate and independent impact analysis using survey data, which also found no significant or systemic impact on outcomes related to employment, job seeking, school attendance, or anti-social behaviour.4 This gives us further confidence in the reliability of our results. However, given the quite major limitations imposed by data quality, our results in isolation cannot be taken as conclusive evidence that the programme had no impact at all, and it is important to consider this result in conjunction with the other evidence contained in the evaluation as a whole. Although our conclusions are robust to a variety of checks detailed below, and consistent with the separate analysis of the survey data, they are subject to caveats and the results below should be read in this light.
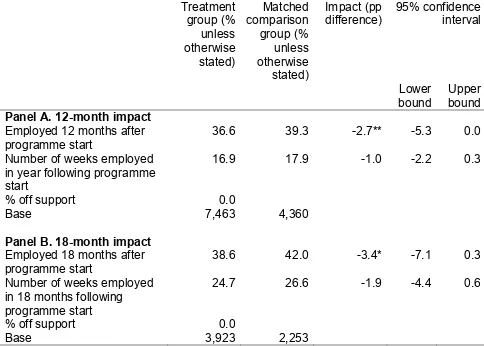
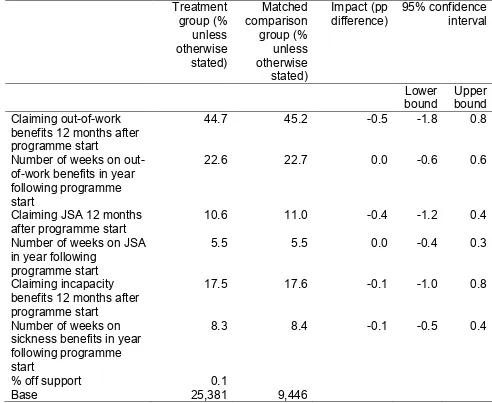
The clearest and most reliable estimates, bearing in mind the limitations of the data, were for impacts on benefit receipt and employment. Our analysis found no significant impact of participation in the Troubled Families programme on any of the key outcome variables. We found no significant impact on the proportion of adults claiming out-of-work benefits either 12 or 18 months after starting on the programme. This was also the case when focusing specifically on JSA or incapacity benefits. Participation in the programme also had no detectable impact on the number of weeks that adult family members spent on out-of-work benefits in the year following the date that they started on the programme. Nor did we find any impact on the likelihood that adults shifted from other out-of-work benefits to JSA. The analysis also suggested that participation in the Troubled Families programme had no impact on the likelihood that adults were employed 12 or 18 months after starting on the programme. The number of weeks spent in employment over each of these time periods
seems to have been unaffected and we found no evidence that more intensive contact affected employment outcomes.
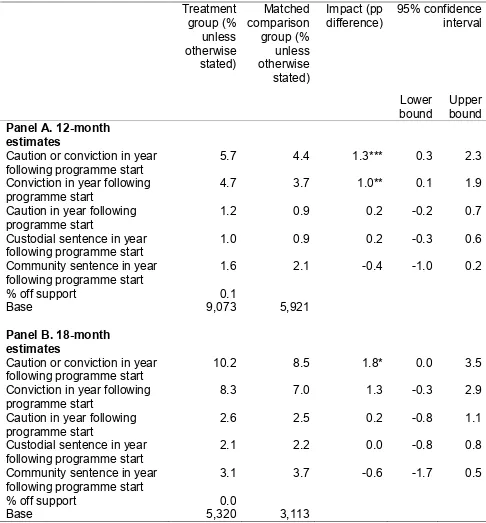
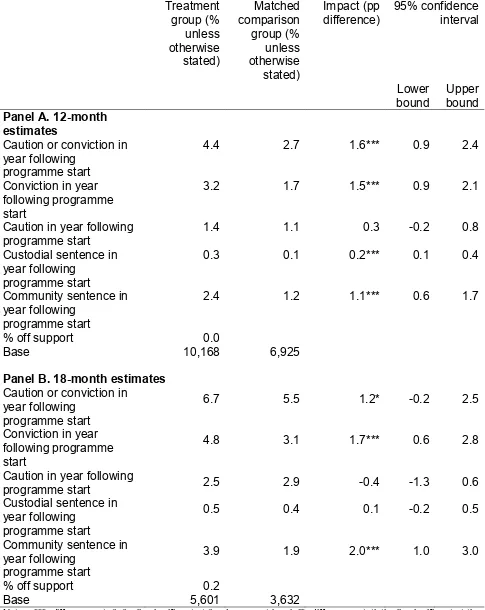
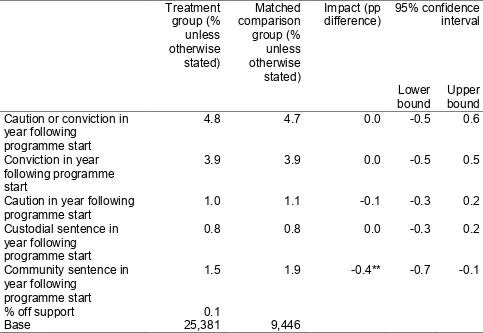
For other outcomes, including on absence from school, the likelihood of children being in care or classified as “in need”, and child and adult offending, some “significant” estimates were obtained. However, these were not consistently either positive or negative (that is, when testing different analytical models, in some cases participation appeared to improve outcomes, but in others to worsen them). Moreover, given the number of hypotheses tested, some significant “impact” estimates would be expected to occur by chance in any case5. In no case did such estimates appear to be robust. The conclusion therefore remains that there is no evidence from this analysis to suggest that the programme had any positive or negative impact, although this is once again subject to the caveats above. We also examined whether participation in the programme had a differential impact on families that were said to have received more intensive support. There was no evidence from this analysis to support this hypothesis.
Generalising the analysis
It was not possible to estimate the impact that participation in a local Troubled Families programme had on all the outcomes that it is potentially possible to observe in the national administrative datasets within the timeframe for the analysis, because only a limited subset of families could be observed at a point when they could be expected to have completed their participation in the programme. For this reason, the study was unable to assess the impact of the programme on exclusions or educational attainment. Even when outcomes could be observed for a sizeable sample of families 12 months after starting on the
programme, there was still a possibility that the family was continuing to receive support at this point, particularly for the hardest to help. There could be greater confidence that the programme would have had time to take effect 18 months after families had started on the intervention, but outcomes at this point could only be observed for a smaller sample of families and for the benefit receipt, employment and offending outcomes. As a result, the findings for this sample of families may not have been representative of those for the wider population of participants.
The generalisability of the findings may have also been affected by the fact that
participation in the study by local authorities was voluntary. Whilst a sizeable proportion of areas did participate (nearly two-fifths), it is possible that the efforts devoted to the success of the Troubled Families programme in these areas were not replicated in other parts of the country. These issues could potentially be overcome in any future evaluation if it were possible to integrate the collection of data required for the evaluation into the reporting requirements for Payment by Results, as well as incentivising local authorities to screen families in a systematic way.
It was not possible to look at variation in performance by local authority. It is therefore possible, particularly given that there was a very large amount of discretion on how the
programme was delivered locally, that analysis in the aggregate might mask differing levels of impact. That is, it is possible that, while the aggregate analysis finds no significant impact on a particular outcome, in fact participation in the programme improved outcomes significantly in some areas while worsening them significantly in others (so leading to no significant impact on average overall).
Conclusion
Whilst it was not possible to assess the impact of participation in the Troubled Families programme on all the outcomes that it seeks to affect, a large number of measures were used, with similar outcomes defined in different ways. Also, the sample sizes that the national administrative data provided meant that it should have been feasible to detect impacts which were relatively small in magnitude. Our analysis of the available data
suggested that programme participation did not have any significant or systemic impact on families within the time frame over which it was possible to observe its effects.
Introduction
The Troubled Families programme
In December 2011 the Government committed to investing £448 million to ‘turn around’ the lives of 120,000 of the most ‘troubled’ families in England. The 120,000 figure was based on earlier Cabinet Office analyses of the Families and Children Study (Cabinet Office 2009). This found that 120,000 families in England were estimated to meet five of the following seven criteria:
no parent in the family was in work;
the family lived in poor-quality or overcrowded housing;
no parent had any qualifications;
the mother had mental health problems;
at least one parent had a long-standing limiting illness, disability or infirmity;
the family had a low income (below 60 per cent of the median); and
the family could not afford a number of items of food and clothing.
The decision to introduce the programme was also based on fiscal analysis by the Department for Communities and Local Government (DCLG) which estimated that £9 billion would be spent on these families by central government and local public bodies during the period covered by the 2010-2015 Spending Review (DCLG 2013). Of this amount, the majority (£8 billion) of costs were expected to be incurred as a result of reactive, rather than targeted, interventions. The largest share of costs for reactive
interventions (£3.5bn) was that generated by the need to protect children, such as placing them in care. Around £2.6bn was estimated to be incurred as a result of crimes committed by these families, whilst the rest arose from the cost of providing benefits and healthcare and dealing with pupils excluded from school.
Targeted interventions were largely accounted for by early years programmes, for example Sure Start, as well as preventative work with young people, family interventions and health programmes. A portion of costs for targeted interventions related to welfare provision, such as the European Social Fund for families with complex needs, and work to prevent further anti-social behaviour or offending.
Following the 2011 announcement, the Troubled Families programme, led by the Troubled Families Unit at DCLG, was launched in April 2012. The programme is aimed at families with multiple needs. However, while the 120,000 figure was adopted as the total number of families to be assisted by the programme, a different set of criteria were used to identify eligible families. Instead, local authorities were asked to identify families that:
were involved in crime and anti-social behaviour;
had an adult on out-of-work benefits6; and
resulted in high costs to the public purse.
Eligibility for the programme was determined by whether the family met these criteria. Families that met all three national criteria (the first three listed above) were automatically included in the programme. Additionally, local authorities were able to include other families that met two of the three criteria if the family also met local discretionary criteria which were intended to correspond to the fourth bullet above, i.e. the family generated high costs for the taxpayer (DCLG 2012). Examples of local criteria suggested by DCLG included families with a child subject to a Child Protection Plan, those where the local authority was considering taking children into care, families that were the subject of frequent calls to the police, or engaged in gang-related crime, and those with particular types of health problems, such as long-term health conditions, emotional and mental health problems, drug and alcohol abuse, pregnancy by those under the age of 18 or health problems as a result of domestic abuse. Quotas for the number of families to be worked with by each local authority were assigned based on their population and scores on the Index of Multiple Deprivation and Child Wellbeing Index.
The Troubled Families programme aims to alter the life course of families by moving provision from services targeted at individuals to integrated family support, whilst reducing costs to the taxpayer (DCLG 2011; 2013). DCLG provides up to 40 per cent of the cost of extra interventions for eligible families, with the remainder coming from local authorities. This amounts to a maximum DCLG contribution of £4,000 per family, which is made up of an attachment fee7 and a Payment by Results (PbR) element. The latter is an arrears payment which is only made if specific outcomes are achieved. In the first year of
operation the attachment fee was £3,200 (80 per cent of the maximum DCLG spend per family). This fell to 60 and 40 per cent respectively in the following two years. This was offset by increasing the proportion of the total £4,000 payment which was made as a results-based arrears payment, i.e. the PbR element was 20, 40 and 60 per cent of the total in each successive year of the intervention.
It was announced in the 2013 Spending Round that the programme would be expanded to 400,000 children with an additional £200 million investment from central government for 2015-2016. Families were to be eligible for the expanded programme if they met two of the following criteria:
parents or children were involved in crime or anti-social behaviour;
children were not attending school regularly;
children were in need of help, i.e. they were identified as in need, or subject to a Child Protection Plan;
6 This includes: Income Support (IS) and/or Jobseeker's Allowance (JSA), Employment and Support Allowance (ESA), Incapacity Benefit (IB), Carer's Allowance and Severe Disability Allowance (SDA).
7 The attachment fee is an upfront payment for the costs involved in restructuring services, recruitment of
adults were out-of-work or at risk of financial exclusion, or young people within the family were at risk of worklessness;
families were affected by domestic violence and abuse;
parents or children were experiencing a range of health problems.
Once again, local authorities were allowed to exercise some discretion over which families to include in the programme, but were asked to prioritise those with multiple problems that were ‘most likely to benefit from an integrated, whole family approach’ and families that were likely to result in the highest costs to the taxpayer (DCLG 2015: 8-9).
The evaluation
Overview of research
The impact of the initial stage of the Troubled Families programme is being evaluated by an independent research consortium. The evaluation consists of a number of
complementary strands which, as a whole, are designed to provide a detailed
understanding of the implementation and operation of the programme and its impact across the range of outcomes that it seeks to affect. The research strands include case studies, a quantitative estimate of impact based on a survey of participants and a comparison group, monitoring data provided by local authorities and a study of the cost-effectiveness of the programme, in addition to the quantitative impact estimates using linked national administrative datasets described in this report.
Purpose of the report
The purpose of this report is to report the analysis and findings of the National Impact Study of the Troubled Families programme. The analysis is based on information provided by local authorities and data on members of participating families compiled from national administrative datasets containing records of benefit receipt, employment, educational participation and attainment, child welfare and offending. As administrative data are not collected specifically for the purpose of evaluating the impact of the programme, they do not provide information on every outcome that the programme aims to effect, and are not defined in a way that directly corresponds to the measures set out in the financial
framework used to determine PbR payments. The national administrative datasets also lack some of the more detailed information on families that it might be feasible to collect in a survey. However, the fact that the national administrative datasets are not specifically collected for the purposes of evaluating the Troubled Families programme also means that the analysis is less likely to be based on a biased sample of families than with a survey which may be affected by systematic differences in response rates for families that
achieve particular outcomes. For example, where family members enter work, they may be less likely to be available to complete a survey. The ability to obtain data on a much larger sample of families than it would be feasible to survey also gives an analysis of
approaches seek to estimate what could have been expected to happen to members of families that participated in the programme - known as the treatment group - if they had not taken part. This estimate of the outcomes that family members would have attained in the absence of the treatment is known as the counterfactual. A comparison group, not subject to the treatment, or observed over a period prior to being treated, is used to estimate the counterfactual, taking into account known differences between two groups. Where the comparison group did not have a real start date on the programme, they were given a ‘pseudo’ start date at random, so that ‘outcomes’ could be evaluated from this point, in the same way as they were for the treatment group. The robustness of the
findings to varying the sample on which it is based and the choice of comparison group is explored in the analysis. Results are also presented for families that received more
intensive support from the programme.
Caveats
As the following chapter on the data used in the course of the study explains, it was
necessary to ask local authorities to provide information on the families who participated in the programme.
56 local authorities provided the data used in this study between October and November 2014. This data was then matched to national level administrative datasets. However, the data supplied by local authorities was of variable quality. As a result, some important data was missing, and it was necessary to make certain assumptions in assigning individuals to treatment and comparison groups. In addition, a significant number of individuals were not matched to certain of the administrative datasets, and this necessitated further
assumptions – for example, we assume that individuals not matched to employment records were not employed (see Table 10). Further details on the data cleaning process and data checks in relation to unmatched administrative data and the assignment of individuals to the treatment and comparison groups are provided in Annex A.
It is possible that in some cases these assumptions did not reflect the true circumstances of particular families and, as a result, the findings may be subject to measurement error. If the prevalence of missing or incomplete data is random and/or does not differ
systematically between the treated and comparison groups, the conclusions will remain unbiased. There is no obvious reason to believe from the data that such systematic differences exist, but given the data issues this possibility cannot be excluded. It is not possible to say with certainty how this might affect the reported results.
Report outline
The following chapter describes the main features of the datasets used in this study, including their coverage, contents and limitations. It also describes the process of linking the datasets together and the resulting coverage of families within the linked administrative data. The report then moves on to describe the characteristics of programme participants in terms of the eligibility criteria that they met, the period of their involvement in the
programme and information on individual, family and local area characteristics. The chapter concludes with a description of family and personal history prior to starting on the Troubled Families programme and family- and individual-level outcomes following
the chapter on methods. The following two chapters then report the main findings from the PSM and waiting list analyses on benefit receipt, employment, educational participation, child welfare and offending. The report concludes with a summary of the main findings of the analyses and a discussion of their limitations. Supplementary analyses are provided in appendices.
Data
Overview of data sources
This chapter describes each of the datasets which were combined during the course of the study to compile detailed information on the history, characteristics and outcomes
experienced by families that were assessed for eligibility for the Troubled Families
programme, as well as their participation in the programme. In addition to the information provided by local authorities administering the programme, data extracts were supplied by the Department for Education (DfE), the Ministry of Justice (MoJ) and the Department for Work and Pensions (DWP) (including information from Her Majesty’s Revenue and Customs (HMRC)). The following sections describe the contents of the datasets and the main limitations of the data in terms of their suitability for analysing the impact of the Troubled Families programme. Details are given of the approach taken to reduce any potential limitations where it was possible to do so.
Overall, as explained below, the data supplied was of variable quality. As a result, some important data was missing, and it was necessary to make certain assumptions in assigning individuals to treatment and comparison groups. In addition, a significant
number of individuals were not matched to certain of the administrative datasets, and this necessitated further assumptions – for example, we assume that individuals not matched to employment records were not employed. Annex A provides details of data checks in relation to unmatched administrative data and the assignment of individuals to the treatment and comparison group.
It is possible that in some cases these assumptions did not reflect the true circumstances of particular families and as a result, the findings may be subject to measurement error. If the prevalence of missing or incomplete data is random and/or does not differ
systematically between the treated and comparison groups, the conclusions will remain unbiased. There is no obvious reason to believe from the data that such systematic differences exist, but given the data issues this possibility cannot be excluded. It is not possible to say with certainty how this might affect the reported results.
Programme data
Contents and coverage
Local authorities were asked to provide information on all members of families that met at least two of the eligibility criteria for the Troubled Families programme. DCLG gave local authorities advanced notice of the data request on 12 September 2014. The National Institute of Economic Research (NIESR) then sent the 152 English local authorities with a Troubled Families co-ordinator a data template to complete, along with a one-page
information required in the time available, but local authorities that got in touch to request an alternative deadline were given slightly longer to collate the relevant data where
possible. Also, in some cases, areas provided incomplete returns and so they were asked to supply further information after the deadline. A total of 59 local authorities provided useable data for the study over the period to 14 November 2014.8
As well as being asked to provide the sort of personal data that could be used to find records relating to the individual in each of the national administrative datasets, i.e. forename, surname, date of birth, gender and postcode, local authorities were asked to supply details of any other unique identifiers that were known to them, such as National Insurance number, National Health Service number, Unique Pupil number, Police National Computer number and a School Unique reference number. Known aliases and the
postcodes of any alternative addresses were also requested. Local authorities were asked to provide a family identifier so that it was possible to group individuals into families. The absence of a family identifier meant that three of the 59 areas that supplied data were excluded from the WPLS and NPD data extracts (see Annex A for further details). Local authorities were also asked to indicate when the family was screened for eligibility for the programme, and which of the national and local criteria they met. Finally, they were asked to indicate whether the family had received support from the programme and if so, when this commenced. They were asked to classify support as intensive or less intensive, whether the family had been worked with in the initial phase of the programme, or in the expansion phase, and when the family finished receiving support from the programme, or whether it was ongoing.
As mentioned previously, local authorities were asked to complete a short data
questionnaire, as well as the detailed data template on individual family members. The questionnaire asked whether the data extract contained information on all families that had ever been worked with as part of the Troubled Families programme and whether it
included all members of those families. Local authorities were asked to provide a description of any known exclusions from the data extract. They were also asked to provide basic information on the way in which the programme had been rolled out in their area. For example, they were asked whether support had been offered to families with the greatest need/problems first, or in no particular order. Finally, the respondent was given the opportunity to provide any further information that they thought relevant on the data extract or the answers that they had given. The purpose of the questionnaire was to provide information that could be used to explore the sensitivity of the results to the particular method of implementing the programme, or peculiarities of the particular data extract supplied. The questionnaire is included in Appendix A.
Two areas (accounting for 657 families) did not return the data questionnaire (Table 1). From the 54 areas that did complete the questionnaire, nearly three-quarters (74.1 per cent) included information on all family members within the data extract. The fact that some local authorities did not claim to include all members of each family is likely to be explained by areas focusing their record-keeping on family members who were known to
have triggered the eligibility criteria for the programme. Also, discussions with local
authorities suggested some were cautious about claiming that they held records on every family member due to transience in the composition of households.
Table 1 Coverage of the data extract
%
Returned data questionnaire (base=56 areas) 96.4
Of those returning questionnaire: 54 areas
Supplied information on all individuals within families 74.1 Features of local implementation:
Support offered to families with the greatest need/problems first 31.5 Support offered to families with the lowest need/problems first 0.0 Support offered as families referred to service by agencies 29.6 Support offered as families identified through data analysis 27.8
Support offered in no particular order 11.1
Supplying information on all families ever worked with 38.9
Families known to be excluded from data extract: 33 areas
All/some receiving a lower level of support 27.3
All/some receiving a higher level of support 3.0
All/some who started receiving support before a certain date 12.1 All/some who started receiving support after a certain date 9.1
Other exclusions 24.2
Not answered 24.2
Almost one-third (31.5 per cent) of the areas that completed the questionnaire said that families with the greatest needs or problems were prioritised over those with lesser needs. None of the local authorities which provided data for the study systematically helped those requiring a lower level of support before those with more entrenched problems. In the remaining two-thirds of areas, the order in which families started on the programme depended on when they were identified as meeting the criteria, through systematic data analysis, referrals by agencies, or some other method which was unlikely to result in either those with greater or lesser needs being prioritised.
From the 54 areas that did complete the questionnaire, around two-fifths (38.9 per cent) reported that they provided information on all families that they had ever worked with. Whilst this percentage seems low, it is probably partly explained by the fact that local authorities were asked to provide what data they could in the time available, rather than being required to supply complete information on all the families that they had ever worked with. Discussions with areas indicated that in some cases, it was difficult to provide
information on all families that they had worked with because the local authority was still in the process of developing a dedicated programme database.
their data extract said that it was those receiving a lower level of support who were excluded. The point in time at which support was received also affected whether families were included in the data extract, with some areas excluding families that participated in the programme at an early stage, or very recently, from the data supplied. Around one-quarter (24.2 per cent) of areas did not provide information on why particular families were excluded and the same percentage gave some other reason for families being excluded, such as data quality being poor or families not consenting to data sharing.
More than half (53.6 per cent) of the local authorities that supplied data for the study included some families that had been screened for eligibility, but had not started on the programme at the time that the extract was supplied. Within the final sample for analysis, 70.8 per cent of families and 79.5 per cent of individuals had participated in the
programme.
The data supplied by the 56 local authorities that provided useable data for the study covered a total of 135,313 individuals. Before the data extracts were sent to the
government departments supplying data for the study they were combined into a single dataset and a preliminary process of data cleaning was conducted. This ensured that family-level information was recorded against all family members, corrected obvious typographical errors and resolved inconsistencies in recording between areas. Each case was given a pseudo-anonymised unique identifier before the personal data extract was supplied to each department. After this preliminary stage of cleaning, 135,225 individuals remained on the file. A further round of data cleaning was carried out after the data had been sent to departments. This included carrying out more detailed work on the
programme data (something that was not required for the matching) and identifying and removing duplicates from the dataset.9 Records relating to 134,009 individuals were
retained following cleaning (see Table 150 Annex A for details of the data cleaning process).
Limitations
As only a proportion of all local authorities that operated the Troubled Families programme provided data for the study, there is a risk that the findings are not representative of the impact of the programme on all families that received support. Furthermore, a large
proportion of the local authorities that participated in the study only provided information on a subset of families that they worked with, and some family members were thought to have been excluded from the sample. However, data was obtained on around one-quarter (25.3 per cent) of the 120,000 families that participated in the initial phase of the programme across the 56 local authorities included in the sample, i.e. a sizeable proportion of the population.
Whilst some fields within the data supplied by local authorities were better completed than others, the key items of personal data that were required to identify records relating to the individual in the national administrative datasets were available for the vast majority of individuals included in the sample. Table 2 shows that forename or surname were missing for less than one per cent of individuals in the programme data, whilst postcode was
missing for around one in forty (2.4 per cent). Date of birth was the least well-recorded item of personal data, but was nevertheless available for nearly 85 per cent of the sample. The impact of these missing items of personal data on the number of individuals who could be identified in the national administrative datasets is considered in the final section in this chapter (on data linking), whilst the completion of other information on participation in the programme is considered in the following chapter.
Table 2 Percentage of records complete in the raw data
% of records complete
Forename 99.1
Surname 99.4
Date of birth 84.6
Postcode 97.6
Gender 94.2
Base (raw data) 135,313
Response to known limitations
As previously mentioned, where relevant information was missing for individuals, but available for other family members, cases were recoded. For example, in some cases the postcode was recorded against a single family member, rather than for all individuals who were part of the same family. In these cases, the postcode could be assigned to all family members to maximize the likelihood that matching records would be correctly identified within the national administrative datasets. Where missing, gender was matched on using Office for National Statistics data on names registered for children born in 2013. This included all names registered against that were unique to either boys or girls. Government departments were sent relevant unique identifiers in addition to the personal data
wherever these were available.
Information on programme participation was aggregated up to the family level where it was only provided for particular individuals within the family. For example, some local
authorities recorded whether a particular family member met each of the national criteria. To establish which criteria the family met, it was necessary to aggregate the individual-level information to the family-individual-level. Similarly, inconsistencies in the recording of
information between family members were resolved by using the earliest screening or start dates for any family member and the latest end date. Likewise, if any family member was recorded as receiving intensive support from the programme, or participating in the expansion phase, records for other family members were recoded to be consistent with this. This was to ensure that the estimate of impact was based on families that had definitely participated in the initial phase of the programme, over a time period when any family member was being worked with (see Table 150 Annex A).
National pupil database
Contents and coverage
Information on absenteeism included the percentage of sessions a child was absent from school and whether the absence was authorised or unauthorised in each academic term for each academic year. These variables, combined with information on when the family started on the programme, were used to derive the absence rate three terms before, and in the term prior to, starting on the programme, as well as whether the child had an absence rate of 15 per cent or more at both these points in time.
The exclusions dataset contained information on permanent, fixed-term and lunch-time exclusions. The variables on fixed-term and permanent exclusions were combined to identify those excluded from school 12 months after starting on the programme.
The Child Looked After (CLA) and Child In Need (CIN) datasets contained start and end dates of spells in care and start and end dates of periods when the child was classified as in need respectively. These variables were used to ascertain whether children had CIN status or were in care 12 months after starting on the programme.
In addition, the NPD contained detailed information on attainment at each Key Stage. A number of different measures of GCSE attainment were derived from the Key Stage 4 data.10 The Key Stage 3 data captured whether the pupil achieved the expected level in English, Maths and Science, whilst average points score was used to measure attainment at Key Stage 2. The Key Stage 1 dataset recorded whether the child had achieved the expected level in Reading, Writing, Speaking and Listening, Maths and Science.
In addition to the information which was specific to particular datasets, a number of other control variables used in the study were recorded within multiple sources e.g. whether the child had received free school meals in any given academic year, whether they had a statement of Special Educational Needs (SEN), their gender and age, whether English was not their first language, and the deprivation score for the area in which they lived. In total, the data extract sent to DfE contained records on 104,246 individuals.
Limitations
As Table 3 shows, there was some variation in the time periods covered by each of the NPD datasets. The Exclusions data in particular only covered the period up to the end of July 2013. Given that few children receive fixed term or permanent exclusions, this meant that the impact of the programme on this particular outcome could only be observed over a relatively short period following the introduction of the Troubled Families programme.
Table 3 Time period covered by each of the NPD datasets
Time period covered (Academic year)
Absence 2007/2008 to Spring 2014
Alternative provision 2007-2008 to 2012/2013
Child In Need 31 March 2006 to 31 March 2014
Children Looked After 31 March 2006 to 31 March 2014
Early Years Census 2007/2008-2013/2014
Exclusions 2007/2008 to 2012/2013
Key Stage 4 2005/2006 to 2013/2014
Key Stage 3 2003-2004 to 2012/2013
Key Stage 2 2000/2001 to 2013/2014
Key Stage 1 1997/1998 to 2013/2014
Pupil Referral Unit 2008/2009 to January 2013
School Census 2007/2008 to 2013/2014
One potential problem which arises in relation to families with the types of problems that the programme sought to tackle is that children may change schools on a frequent basis. If there was no way of tracking these children over time, it might be more difficult to observe the impact of the programme on these children than for those in more stable homes. Finally, the documentation for the NPD notes that there are inconsistencies between schools in whether absences are classified as authorised or unauthorised. In some cases, an absence which is classified as unauthorised at the time it is recorded may be amended to indicate that it was in fact authorised if a legitimate explanation for the absence is later given (DfE 2011: 9-10). If the treatment group were more likely than the comparison group to attend schools which had a greater propensity to classify absences as unauthorised, an absence measure based on unauthorised absences alone may result in biased estimates of impact.
Responses to known limitations
The NPD contains a unique personal identifier which is used to ensure that records for any given child can be linked even when there are changes of surname or address. This
reduces the likelihood that it is more difficult to identify records relating to those subject to the programme in the NPD. Local authorities were also asked to provide information on known aliases and alternative postcodes, as well as the unique pupil identifier, where this was recorded. This therefore increased the ability to obtain NPD records for children included in the programme data.
Police national computer
Contents and coverage
The Police National Computer (PNC) is a record of cautions and convictions received by offenders. The data extract was supplied by the MoJ and included detailed information on when the offence was committed (if this was known), the police force area, the date of caution or conviction, the type of offence committed, whether the offender was cautioned or convicted, the number of co-offenders associated with the offence, the primary offence (where an offender was convicted or cautioned for multiple offences on the same date), the type of sentence received (known as the disposal type) and the length of custodial sentences. It also included some information on the personal characteristics of offenders, including gender and ethnicity. The data extract was supplied on 22 December 2014. Offenders are given a unique PNC number which allows multiple cautions or convictions received by the same individual to be linked, even when the offender uses aliases or changes addresses. The extract of data used in this study contained information on all offences committed by the individual prior to 6 November 2014. Those who had never committed an offence resulting in a caution or conviction, and children under the age of ten when the extract was drawn (21 November 2014) would not be found within the PNC extract supplied by MoJ. The dataset included information on 30,002 individuals and contained 245,062 records.
Limitations
One of the main limitations of the PNC in relation to the Troubled Families programme is that it does not contain records on any criminal activity which did not result in a caution or conviction. This could be relevant to local eligibility criteria, which may take into account the type of behaviour which means that the family is known to the police, even if no family members have been cautioned or convicted of an offence in the recent past. Also, the PNC does not include information on anti-social behaviour. Since one of the national eligibility criteria for the Troubled Families programme is whether a family member has engaged in criminal or anti-social behaviour in the year prior to screening, the fact that the PNC does not cover incidents of anti-social behaviour means that it does not offer full coverage of the types of outcomes that the programme seeks to affect.
A further limitation of the PNC is that, whilst the date of conviction or caution is recorded for all offences, the date that the offence was committed is not always complete. This creates potential difficulties in determining whether an offence was committed before or after the date that the family member started on the programme. Where both the date that the offence was committed and the date of caution or conviction were recorded, the date of conviction was a median average of 64 days after the offence date.11 This creates potential difficulties in calculating the offending rate for family members following contact with the programme, if offences committed before the family started on the programme are mistakenly treated as having occurred following programme start. However, whilst the date that the offence was committed was not recorded for 19.0 per cent of offences recorded on
Figure


Outline
Related documents
[r]
Data augmentation techniques were success- fully used in the last CoNLL–SIGMORPHON 2018 Shared Task ( Bergmanis et al. , 2017 ) and thus, we think that our model could see its
Subgroup analysis by ethnicity discovered GG genotype of rs187238 was associated with a significantly higher risk of CAD in all genotypes in Asian, while only in heterozygous model
Paua, Alexandre, "How the human factor in shipboard marine engineering operations has influenced ship accidents in Mozambique : assessing the reasoning : a proposal
announced that we’ll consider changing legislation to extend your current role and the role and responsibilities of the school designated teacher for looked-after children to
Importantly, a majority of the peptides tested were unable to upregulate CD25 expression on Foxp3 ⫹ IFN- ␥ ⫺ Treg, and only a small number showed this capacity, suggesting that
Language variation and change are driven both by individuals’ internal cognitive pro- cesses and by the social structures through which language propagates. A wide range
Overexpression of miR-584 repressed cell viability, migration as well as invasion, potentiated apoptosis and sensitized OS cells to DDP and taxanes.. Mechanism investigation speci fi
