0022-538X/08/$08.00⫹0 doi:10.1128/JVI.00471-08
Copyright © 2008, American Society for Microbiology. All Rights Reserved.
Rapid Sequence Change and Geographical Spread of Human
Parvovirus B19: Comparison of B19 Virus Evolution in
Acute and Persistent Infections
䌤
†
Pa
¨ivi Norja,
1,3Anna Maria Eis-Hu
¨binger,
2Maria So
¨derlund-Venermo,
3Klaus Hedman,
3and Peter Simmonds
1*
Centre for Infectious Diseases, University of Edinburgh, Summerhall, Edinburgh EH9 1QH, United Kingdom1; Institute of Virology,
University of Bonn, Sigmund-Freud-Strasse 25, D-53105 Bonn, Germany2; and Department of Virology, University of
Helsinki, and Helsinki University Hospital Laboratory Division, Haartmaninkatu 3, FI-00290 Helsinki, Finland3
Received 4 March 2008/Accepted 7 April 2008
Parvovirus B19 is a common human pathogen maintained by horizontal transmission between acutely infected individuals. However, B19 virus can also be detected in tissues throughout the life of the host, although little is understood about the nature of such persistence. In the current study, we created large VP1/2 sequence data sets of plasma- and tissue (autopsy)-derived variants of B19 virus with known sample dates to compare the rates of sequence change in exogenous virus populations with those in persistently infected individuals. By using linear regression and likelihood-based methods (such as the BEAST program), we found that plasma-derived B19 virus showed a substitution rate of 4ⴛ10ⴚ4and an unconstrained (synonymous)-substitution rate of 18ⴛ10ⴚ4per site per year, several times higher than previously estimated and within the range of values for mammalian RNA viruses. The underlying high mutation frequency implied by these substitution rates may enable rapid adaptive changes that are more commonly ascribed to RNA virus populations. These revised estimates predict that the last common ancestor for currently circulating genotype 1 variants of B19 virus existed around 1956 to 1959, fitting well with previous analyses of the B19 virus “bioportfolio” that support a complete cessation of genotype 2 infections and their replacement by genotype 1 infections in the 1960s. In contrast, the evolution of B19 virus amplified from tissue samples was best modeled by using estimated dates of primary infection rather than sample dates, consistent with slow or absent sequence change during persistence. Determining what epidemiological or biological factors led to such a complete and geographically extensive population replacement over this short period is central to further understanding the nature of parvovirus evolution.
Parvovirus B19 is the best-characterized member of the fam-ilyParvoviridae, known to cause pathogenic infections in hu-mans (14). Parvoviruses are classified into genera or groups with differences in host range, pathology, and tissue/cellular tropisms (14). Human parvovirus B19 is a member of the
Erythrovirusgenus that specifically targets erythroid progenitor cells through the globoside P antigen (2). Infections are asso-ciated with anemia and sometimes with aplastic crises.
B19 virus has respiratory, vertical (where infection may lead to intrauterine anemia or fetal death [hydrops fetalis] [4]), and parenteral (often through the contamination of plasma-de-rived blood products [3]) routes of transmission. Primary in-fections are characterized by an intense viremia of short dura-tion, a rapid resolution following seroconversion for antibody to B19 virus, and lifelong immunity from reinfection (23). In Western countries, the frequency of B19 virus exposure rises steeply with age in individuals between the ages of 1 year and the late-teenage years to approximately 60 to 70% (13, 28, 33, 44).
Little is known about the origin, past epidemiology, or evo-lution of B19 virus. However, the lifelong persistence of viral DNA in tissues (11, 15, 19, 22, 30, 41) may reveal what variants circulated in previous decades of life when primary infections occurred (30). There are three genotypes of B19 virus, differing in nucleotide sequence by approximately 13 to 14% (6, 16, 29, 37); genotypes 1 and 2 are found in Europe, the United States, and other Western countries, while genotype 3 is restricted to sub-Saharan Africa and South America (6, 31, 34). Sequences of both genotype 1 and 2 were found in tissues of persistently infected individuals, although genotype 2 detection was strictly limited to those born before 1973, indicating that the circula-tion of this genotype ceased in Finland and Germany after this date (30). A similar restriction of genotype 2 to those born before 1963 was found in study subjects from Scotland (27), indicating some commonality in the transmission networks and dynamics of B19 over large areas of Europe.
The relatively dynamic picture of B19 virus populations sug-gested by these findings has reawakened interest in the evolu-tion and molecular epidemiology of B19 virus. To estimate the times of origin of genotype 1 variants that replaced genotype 2 in Europe, we created and analyzed a large data set of geno-type 1 VP1/VP2 sequences of plasma-derived (n⫽33) viruses. We additionally studied tissue-derived variants of B19 virus to compare the evolution of horizontally transmitted, exogenous virus populations with that of virus populations occurring
dur-* Corresponding author. Mailing address: Center for Infectious Dis-eases, University of Edinburgh, Summerhall, Edinburgh EH9 1QH, United Kingdom. Phone: 44 131 650 7927. Fax: 44 131 650 6511. E-mail: [email protected].
† Supplemental material for this article may be found at http://jvi .asm.org/.
䌤Published ahead of print on 16 April 2008.
6427
on November 8, 2019 by guest
http://jvi.asm.org/
ing persistent infection in vivo. The rate of the sequence change of B19 virus was several times higher than previously determined (31, 38), suggesting a much shorter time frame for the emergence of genotype 1, which fits better with the “bio-portfolio” evidence for its replacement of genotype 2 in West-ern countries.
MATERIALS AND METHODS
Study samples.Samples of plasma from study subjects with acute B19 infec-tion and plasma pools or manufactured blood products were obtained from the United Kingdom, Finland, or Germany (see Table S1 in the supplemental ma-terial). Autopsy samples of bone marrow or lymphoid tissue and 15 biopsies of tonsil or skin collected in Finland and the United Kingdom were additionally studied.
Amplification of B19 virus sequences.DNA was extracted from tissue and plasma/blood product samples by standard methods (27, 30) and screened for B19 virus DNA sequences by B19 virus-nested PCR (26). The whole of the open reading frame 2 (ORF2) gene was amplified from positive samples by using three sets of nested primers (see Table S2 in the supplemental material). Amplicons were sequenced using the BigDye Terminator kit (Applied Biosystems), and sequences were assembled and aligned in Simmonic Sequence Editor v1.5 (40).
The sequence data set was supplemented with published sequences with anno-tated sample dates and sources (i.e., plasma or tissue) or provided by the inves-tigators (see Table S3 in the supplemental material).
Screening for recombination and positive selection. All sequences were screened for recombination through the detection of phylogeny violations be-tween trees constructed from sequential 501-base fragments, increasing by 252-base increments through the ORF2 region by using a TreeOrder scan in a
Simmonic package. The only violations detected at a bootstrap value of⬎65%
involved the previously described recombinant sequence AN66 (38), which was excluded from further analysis. No evidence for positively selected amino acid residues among the remaining data set of 121 ORF2 sequences was obtained by
using CodeML (45) or by using the HyPhy package (allPvalues were⬎0.01
[32]).
Phylogenetic analysis and rate calculation.Phylogenetic trees of B19 virus ORF2 sequences were constructed by neighbor-joining of Jukes-Cantor analysis (J-C)-corrected pairwise distances. Regression analysis was performed by using maximum composite likelihood (MCL) distances (calculated by MEGA4 [43] with a gamma distribution value of 0.179) between each sequence and the earliest dated sequence available, PVBPRO. The separate regression analysis of synonymous sites was performed by using J-C-corrected distances.
A Markov chain Monte Carlo (MCMC) method implemented in BEAST package version 1.4 (9) was used to independently estimate the rate of the sequence change of B19 virus (10). Dated sequence sets were run with chain lengths of 10 million under the SRD06 model of substitution (39) and the assumption of a constant population size. Separate runs using a strict molecular clock and a relaxed (uncorrelated lognormal) clock were carried out. All other parameters were optimized during the burn-in period. The output from BEAST was analyzed by using the program TRACER (http://beast.bio.ed.ac.uk/Tracer).
Nucleotide sequence accession numbers.B19 virus sequences were assigned the accession numbers EU478527 to EU478589 (see Table S1 in the supplemen-tal material).
RESULTS
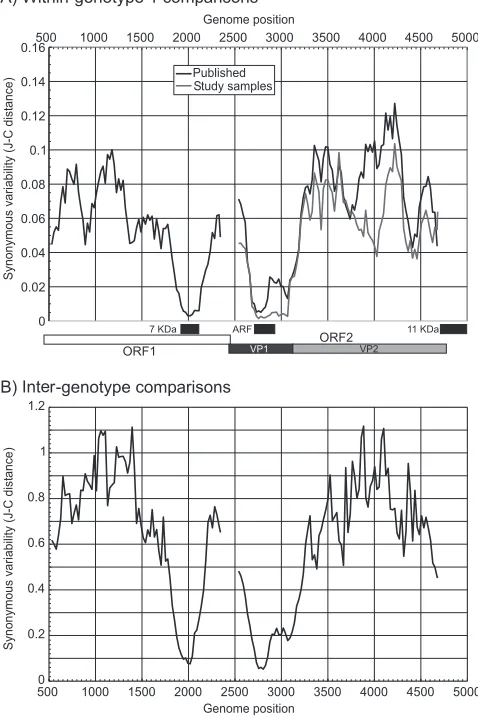
[image:2.585.43.282.75.434.2]Sequence variability of B19 virus.Sequence diversity within and between genotypes of B19 virus occurs primarily at syn-onymous sites. We examined further constraints on B19 virus sequence changes other than protein coding in ORF1 and ORF2 by measuring the synonymous-site variability (SSV) within (Fig. 1A) and between (Fig. 1B) genotypes. A region of suppressed SSV was observed in the overlap of ORF1 and the 7-kDa protein translated from a different reading frame (po-sitions 1904 to 2122 [25]) and in the overlap with the 11-kDa protein gene with ORF2 (positions 4704 to 4988 [42, 46]). A third conserved coding sequence in all three genotypes, re-ferred to previously as the “X” ORF (14), was associated with profound suppression of SSV between positions 2650 and 3200. The alternative reading frame was under a greater se-quence constraint than ORF2 (Table 1), with lower nonsyn-onymous-site variability in the “X” ORF than in ORF2 and a lower ratio of nonsynonymous evolutionary changes (dN) to synonymous changes (dS) (⬍0.3). All regions of ORF2 with
FIG. 1. Variability of ORF1 and ORF2 coding sequences mea-sured as mean pairwise synonymous distances between sequences of the same genotype (A) and different genotypes (B) (note the different
yaxis scales between panels A and B). Analysis was carried out using 201-base fragments increasing by 24-base increments across each cod-ing region. ARF, alternate readcod-ing frame.
TABLE 1. Comparison of sequence diversity levels in ORF2 and an alternate reading frame
Frame Position Type of
comparison dS
a
dNa
dN/dS
ORF2 2714–2729 Intragenotypeb 0.0139 0.0096 1.21 Intergenotype 0.0733 0.0363 0.59
“X” ORF 2712–2930 Intragenotype 0.0261 0.0053 0.28 Intergenotype 0.1011 0.0259 0.28
a
J-C-corrected mean pairwise distances.
b
Weighted pairwise comparison of sequences of the same genotype.
on November 8, 2019 by guest
http://jvi.asm.org/
[image:2.585.299.541.632.707.2]overlapping coding sequences were excluded from subsequent evolutionary analysis.
Time-related sequence change of B19 virus ORF sequences.
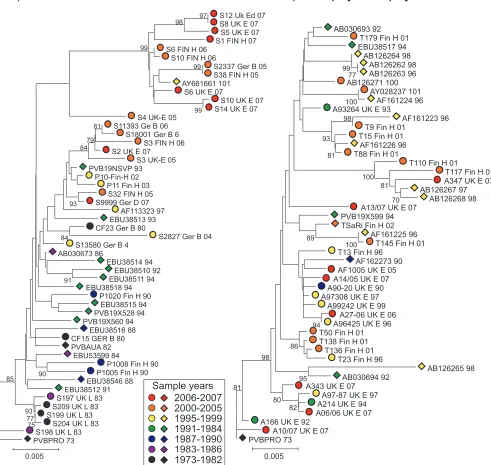
Phylogenetic analysis of B19 virus sequences from positions 3242 to 4612 in ORF2 amplified from 33 plasma samples or from archived plasma pools/blood products and 17 published plasma-derived sequences of known collection dates was car-ried out. This showed evidence for the time-related sequence drift of B19 virus (Fig. 2A), with increasing divergence from the root of the tree with later sampling dates. Regression
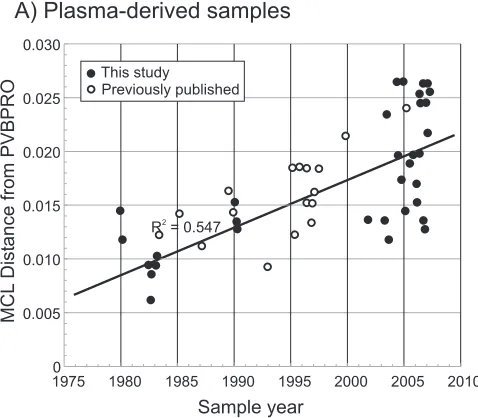
analysis of nucleotide distances between each sequence and PVBPRO with consideration of the sample collection date (Fig. 3) revealed the rate of sequence change of each sequence data set to be around 4.4⫻10⫺4substitution per site per year
(Table 2). Sequence changes at synonymous sites showed the same time-related correlation (R2⫽0.51) and a much higher
substitution rate (18⫻10⫺4substitution per site per year). No
association between sequence divergence at nonsynonymous sites and time was detected in either data set.
[image:3.585.48.539.83.548.2]To investigate whether B19 virus genotypes evolved in a
FIG. 2. Phylogenetic analysis of plasma-derived (A) and autopsy/biopsy sample-derived (B) B19 virus sequences from this study (circles) and published sources (diamonds). Trees were constructed from pairwise J-C-corrected nucleotide distances by neighbor-joining. Symbols were colored based on the calendar year of collection (see the key). The robustness of groupings was calculated by bootstrap resampling of 1,000 replicates of the data; values ofⱖ70% are shown.
on November 8, 2019 by guest
http://jvi.asm.org/
comparable manner during persistence, the same analysis was performed on sequences recovered from tissue samples (Fig. 2). The observable lack of temporal structure in the tree (Fig. 2B) was confirmed by the lack of correlation between the sample date and divergence as determined by regression anal-ysis (Fig. 3B; Table 2) (R2,⬍0.001;P,⬎⬎0.05).
The same data sets were analyzed by the Bayesian MCMC method (10). For plasma-derived sequences, applying strict and relaxed molecular clocks predicted almost identical log likelihoods and nucleotide substitution rates (3.64⫻10⫺4and
3.72 ⫻ 10⫺4 substitution per site per year) (Table 2). The
relaxed clock assumption provided a mean branch substitution rate of 4.11⫻ 10⫺4 substitution per site per year (data not
shown). Allowing a variable rate fitted the data significantly better than allowing a uniform rate (a log10Bayes factor of 5.428), although likelihoods and substitution rates were similar (Table 2), indicating that the uniform-rate assumption pro-vides an adequate model for the evolution of B19 virus. The MCMC estimates of the substitution rate were, furthermore, close (within 5 to 15%) to those calculated by regression anal-ysis (4.4⫻10⫺4substitution per site per year) (Table 2), lying
within the high-probability distribution (HPD) of the MCMC values. Predicted dates for the most recent common ancestor (MRCA) of the sequence analyzed in the plasma-derived data set were from 1956 to 1959 (the HPD range was 1941/1945 to 1968/1969) (Fig. 2).
The substitution rates calculated for autopsy-derived vari-ants of B19 virus by the MCMC method were 10-fold lower than those calculated for plasma-derived viruses (Table 2). The lower HPD interval was close to zero, consistent with an ex-tremely low consistent rate of or undetectable sequence change among these sequences. These data are consistent with the lack of association between divergence and sample by re-gression analysis (Fig. 2B).
Rate of sequence change of B19 virus during persistence.
The lack of correlation between divergence and sample year observed for tissue-derived B19 virus variants may be ac-counted for by restricted or absent virus replication during persistence. The immediate problem with investigating this hypothesis is the lack of information about the time of primary infection in the study subjects from whom tissue samples were obtained. However, as a group, their most likely expected times of infection may be inferred from standard incidence and seroprevalence information on B19 virus from the United Kingdom and Finland. Both countries showed a period of peak incidence between 8 and 9 years of age, at which time, overall seroprevalence was 35% (i.e., approximately half that of the adult population) (28).
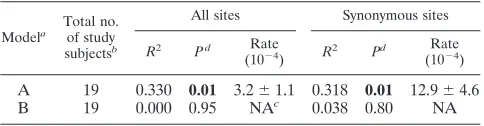
From the subset of study subjects whose ages at the time of sampling were recorded (see Table S1 in the supplemental material), we compared two models of sequence change. Model A assigns a mean time of infection of 9 years of age and assumes no sequence change during the time that the virus persisted. Model B assumes a sequence change after infection at the same rate as that of the exogenous, horizontally trans-mitted virus. Model A provides a convincing correlation be-tween the time of infection and the substitution rate at all and at silent sites (Table 3) (R2⫽0.32 to 0.33;P⬇0.01;
substitu-tion rates, 3.2 ⫻ 10⫺4 and 12.9 ⫻ 10⫺4 per site per year).
Lower correlation coefficients likely arose from a greater scat-ter of the data associated with the introduction of a further variable (age of infection) and the lower number of subjects analyzed. The average of the measured substitution rates of (3.7⫾2.0)⫻10⫺4and (18.3⫾8.5)⫻10⫺4substitution per
[image:4.585.43.282.69.278.2]site per year at all and at synonymous sites, respectively, were remarkably similar (although with higher standard errors) to estimates based on regression analysis for plasma virus (Table 2). No such association is evident in model B (concordant with the analysis of the larger data set) (Table 2).
FIG. 3. Relationship between sample date and divergence (MCL-corrected pairwise distances) between the sequence of the reference strain of B19 virus, PVBPRO (collected in 1973), and plasma-derived (A) and autopsy/biopsy-derived (B) sequences. Previously published (open circles) and newly obtained (filled circles) sequences are shown. Each graph includes a line of best fit, calculated according to the linear region.
on November 8, 2019 by guest
http://jvi.asm.org/
DISCUSSION
Substitution rate of B19 virus.Both the MCMC and regres-sion analyses found consistently high, concordant substitution rates of around 4⫻10⫺4substitution per site per year for B19
virus in ORF2 (Table 2), approximately fourfold higher than those calculated for this region by the MCMC method for a set of 38 genotype 1 sequences (38). The rate is additionally sub-stantially higher than that calculated for genotype 3 sequences (31) and for a short region of VP1 of South American genotype 1 variants (1).
There are two likely reasons for the observed discrepancies in rates between studies. Previous analyses of ORF2 included regions of suppressed variability in VP1 containing overlapping gene sequences which effectively drove SSV in the VP1 coding frame down to close to zero. The inclusion of these relatively invariant regions in the analysis in previous analyses of the gene coding VP1/2 (31, 38) substantially reduced the overall substitution rates calculated.
The second reason for lower estimates in previous studies is the result of the inclusion of sequences derived from biopsy or
autopsy tissue samples (e.g., 11 of 38 VP1/2 sequences ana-lyzed by Shackelton and Holmes [38]). However, we have shown that sequence change in B19 virus variants during the time of virus persistence is not modeled adequately by assum-ing that they have the same substitution rate as horizontally transmitted viruses (Table 3, model B). To demonstrate the effect of their inclusion, we analyzed a combined data set of plasma- and tissue (autopsy)-derived B19 virus variants by the MCMC method and obtained a composite substitution rate for B19 virus of 1.66⫻10⫺4(HPD, 1.17⫻10⫺4to 2.19⫻10⫺4)
substitution per site per year, three times lower than the rate based on plasma-derived viruses. This figure would be even lower if regions of suppressed variability in VP1 had been included in the analyzed sequences.
Comparison with substitution rates of other viruses. The sequence change in VP1/2 and elsewhere in the B19 virus genome is constrained by extreme conservatism in its amino acid sequence of encoded viral proteins (14). Almost all se-quence change (even between the more divergent genotypes of B19 virus) occurs at synonymous sites, with extremely low
dN/dSratios for both major genes (31, 38). A fairer compari-son of the underlying frequency and fixation of mutations in the B19 virus population with those of other viruses (whose protein sequence may not be under such constraint or may indeed be subject to positive selection) may be achieved by comparing synonymous-substitution rates. In the current study, regression analysis was allowed to calculate an unconstrained-substitution rate for B19 virus of at least 1.8⫻10⫺3
synony-mous substitution per site per year (Table 2). This rate lies within the range (of substitutions per site per year) reported for flaviviruses (0.4⫻10⫺3to 4.9⫻10⫺3[restricted to nonzero
rates]), paramyxoviruses (0.7 ⫻ 10⫺3 to 4.8 ⫻ 10⫺3), and
orthomyxoviruses (0.4⫻10⫺3to 4.2⫻ 10⫺3) but was higher
than ranges reported for togaviruses and reoviruses (0.1⫻10⫺3
to 0.78⫻10⫺3and 0.6⫻10⫺3to 1.4⫻10⫺3, respectively) and
lower only than those reported for picornaviruses (2.5⫻10⫺3
to 12⫻10⫺3).
[image:5.585.44.543.79.249.2]The factors that contribute to the rapid sequence drift of
TABLE 2. Estimates of the rates of sequence change of B19 viruses by using regression and BEAST analyses
Source of B19
Origin of sequence
set
Regression analysis (MCL distance) MCMC analysis (BEAST)
Sites
Total no. of samples
R2 Pa
Substitution
rate (10⫺4
substitution/
site/yr)b
Total no. of samples
Clock Likelihood
(⫺ln关L兴)
Substitution
rate (10⫺4
substitution/
site/yr)d
Date of MRCAd
Plasma This study All 33 0.497 5ⴛ10ⴚ6 4.23⫾0.77
Published sequences
All 17 0.442 0.004 4.40⫾1.28
Combined All 50 0.547 ⬍10ⴚ9 4.42⫾0.58 51 Strict ⫺3,645 3.64 (2.54–4.57) 1959 (1945–1968)
Relaxed ⫺3,629 3.72 (2.66–4.84) 1956 (1941–1969)
Combined Synonymous 50 0.510 6ⴛ10ⴚ9 17.86⫾2.54
Combined Nonsynonymous 50 0.047 0.131 NAc
Autopsy This study All 29 0.039 0.300 NA
tissue Published All 17 0.300 0.053 NA
Combined All 46 0.000 0.895 NA 46 Strict ⫺3,285 0.44 (0.014–0.97) NA
Relaxed ⫺3,263 0.46 (0.001–1.06) NA
Combined Synonymous 46 0.002 0.781 NA
Combined Nonsynonymous 46 0.014 0.431 NA
a
Significant values (P⬍0.05) are bold.
b
Mean rate⫾standard error.
c
NA, not applicable. With substitution rates, there was no evidence for time-related sequence change.
d
Mean value (HPD interval).
TABLE 3. Comparison of two models of B19 sequence change during persistenced
Modela Total no.
of study
subjectsb
All sites Synonymous sites
R2 Pd Rate
(10⫺4) R2 Pd
Rate
(10⫺4)
A 19 0.330 0.01 3.2⫾1.1 0.318 0.01 12.9⫾4.6
B 19 0.000 0.95 NAc 0.038 0.80 NA
a
For model A, infection was considered to have occurred at the age of 9 years, with no subsequent sequence change; for model B, the rates of sequence change of exogenous and persistent B19 viruses were considered to be equal.
b
For model A, Excludes study subjects with estimated dates of infection before 1973 were excluded. For study subjects aged 9 years or less, infections assumed to have occurred halfway between birth and the sampling time. For model B, the analysis was restricted to the same subset as that used for model A.
c
NA, not applicable. There was no evidence for a time-related sequence change.
d
Boldface values are significantly different.
on November 8, 2019 by guest
http://jvi.asm.org/
[image:5.585.43.285.581.644.2]B19 virus and potentially to the drift of other parvoviruses maintained by long, horizontal transmission chains are un-known. B19 virus, in common with other small viruses, is rep-licated by host cell DNA polymerase, and the enzyme’s intrin-sic proofreading activity might be expected to reduce the frequency of nucleotide misincorporations to that of host DNA copying. In primates, this mutation frequency leads to a syn-onymous-substitution rate of approximately 2⫻ 10⫺9
substi-tution per site per year (5), around a million times slower than that calculated for B19 virus. The difference in substitution rates cannot be entirely attributed to differences in the number of replicative cycles between B19 virus and its human host. Human DNA in the germ line is copied approximately 30 (females) and 200 (males) times per generation, an average of around 5 times per year. B19 virus cannot possibly undergo 5 million sequential genome replications in a year. With a min-imum replication cycle in cells of at least 24 h, during which time at most 10 to 20 sequentially templated copyings of the viral genome during the synthesis of concatamerized replica-tion intermediates are likely to occur (8), there would be a maximum of 7,000 sequential genome transcriptions per year. This total is nearly 1,000 times fewer than that expected if B19 virus and human DNA replication occurred with the same underlying mutation frequency.
It is possible that the unidirectional synthesis of DNA during the rolling hairpin replication of parvovirus DNA, resolution, and synthesis of single-stranded genomic DNA sequences for packaging (8) may be associated with higher error frequencies than the bidirectional synthesis of host genomic DNA. Inter-estingly, substitution rates in RNA viruses are correlated with genome size, with lower rates occurring in viruses with larger genomes (18). This provides evidence that viruses, in common with larger organisms, have the ability to modulate mutation rates to provide the correct balance between replicative fitness and adaptability. One might speculate that some small DNA viruses, such as B19 virus, may have a similar ability to modify the mutation rates of the host cell, perhaps because its trans-mission and epidemiology, and thus its evolutionary con-straints and pressures, might closely resemble those of respi-ratory viruses with RNA genomes. How this might be achieved is not known.
Recent spread of parvovirus B19 virus. Revised estimates for the substitution rates of B19 virus predict a relatively recent date for the MRCA of genotype 1 (Europe, the United States, Japan, Korea, and Brazil). An MRCA occurring in the late 1950s is consistent with the epidemiology of genotype 1 and genotype 2. The large-scale surveillance of B19 virus genotypes in Europe showed that genotype 1 infections are almost invari-ably detected in contemporary samples, with extremely few if any genotype 2 (or 3) infections (6, 7, 21). This contrasts with the frequent detection of genotype 2 variants in tissue samples or persistently infected (immunosuppressed) individuals (16, 24, 27, 30, 36). The hypothesis that these variants originate from primary infections when genotype 2 was the predominant circulating virus (30) is supported by the unusual age restric-tions of type 2-infected subjects (those born before 1973 and 1963 [27, 30]). These observations are fully consistent with the predicted MRCA of genotype 1 in the late 1950s, which then almost entirely replaced genotype 2 by the early 1970s over large parts of the world. The epidemiological factors and the
possible role of biological differences between genotypes, such as greater infectivity or transmissibility, that may have contrib-uted to its dramatic spread and replacement of other geno-types are entirely unknown (12).
Nature of B19 virus sequence change during persistence.
The observation that the sequence divergence of tissue-asso-ciated variants showed no correlation with sample collection dates demonstrates directly that the evolution of B19 virus during its persistence differs from that of horizontally trans-mitted viruses. However, paired samples from acute infection and after a period of persistence were not available to directly investigate the sequence change, and this study had to rely on estimates of times of infection based on those determined by previous seroepidemiological studies (13, 28, 33, 44). However, the crude model used in the current study (primary infections at the age of 9 and no subsequent sequence change during persistence) actually fitted the evolutionary data closely and restored the correlation between sequence divergence and the estimated year of primary infection (Table 3).
Models A and B compared in this study are extremes, and the observed better fit of model A to the data clearly does not rule out other scenarios, such as the persistence of the virus with a much lower rate of sequence change arising from re-stricted virus replication or ongoing rapid sequence change in a small subset of individuals and an absence in the majority. Observations for maintained strong cytotoxic-T-cell reactivity in B19 virus-seropositive individuals (17) and low-level fluctu-ating viremia in 0.3 to 0.8% of healthy blood donors (20, 35) do indeed imply various degrees of ongoing replication in vivo. It remains uncertain whether individuals with reactivated virus may be infectious; it is therefore possible that the infrequent cases of genotype 2 infections recorded in Europe (7, 21, 24) may have arisen by the transmission of reactivated virus from persistently infected individuals rather than by the continued low-level circulation of this genotype in the community. Understanding the nature of the persistence of B19 virus is therefore important for future investigations of its molecular epidemiology and evolution and of the factors underlying the large-scale population replacements that we have witnessed in the past few decades.
ACKNOWLEDGMENTS
The study was supported by the Academy of Finland (grant number 1122539), the Sigrid Juse´lius Foundation, the Helsinki University Cen-tral Hospital (HUS) Research and Education Fund, the Finnish Fund-ing Agency for Technology and Innovation, the Paulo Foundation, and the Research and Science Foundation of Farmos and BONFOR (grant number 0-151.0021).
We are grateful to Leena-Maija Aaltonen (Helsinki University Cen-tral Hospital [HUS]), Harri Laitinen (Finnish Red Cross), Esa Partio (Dextra Medical Centre), Annamari Ranki (HUS), Jeanne Bell and Francis Carnie (University of Edinburgh Department of Pathology), Kate Templeton (Royal Infirmary of Edinburgh), and Sally Baylis, Jacqueline Fryer, and Anthony Hubbard (National Institute for Bio-logical Standards and Controls, London, United Kingdom) for provi-sion of plasma, the plasma pool, clotting factor, and biopsy tissues used in the study.
REFERENCES
1.Barros de Freitas, R., E. L. Durigon, D. S. Oliveira, C. M. Romano, M. R. Castro de Freitas, A. C. Linhares, F. L. Melo, L. Walshkeller, M. L. Barbosa, E. M. Huatuco, E. C. Holmes, and P. M. Zanotto.2007. The “pressure pan”
evolution of human erythrovirus B19 in the Amazon, Brazil. Virology369:
281–287.
on November 8, 2019 by guest
http://jvi.asm.org/
2.Brown, K. E., S. M. Anderson, and N. S. Young.1993. Erythrocyte P antigen:
cellular receptor for B19 parvovirus. Science262:114–117.
3.Brown, K. E., and P. Simmonds.2007. Parvoviruses and blood transfusion.
Transfusion47:1745–1750.
4.Brown, T., A. Anand, L. D. Ritchie, J. P. Clewley, and T. M. Reid.1984.
Intrauterine parvovirus infection associated with hydrops fetalis. Lancetii:
1033–1034.
5.Bulmer, M., K. H. Wolfe, and P. M. Sharp.1991. Synonymous nucleotide substitution rates in mammalian genes: implications for the molecular clock and the relationship of mammalian orders. Proc. Natl. Acad. Sci. USA
88:5974–5978.
6.Candotti, D., N. Etiz, A. Parsyan, and J.-P. Allain.2004. Identification and characterization of persistent human erythrovirus infection in blood donor
samples. J. Virol.78:12169–12178.
7.Cohen, B. J., J. Gandhi, and J. P. Clewley.2006. Genetic variants of parvo-virus B19 identified in the United Kingdom: implications for diagnostic
testing. J. Clin. Virol.36:152–155.
8.Cotmore, S. F., and P. Tattersall.1995. DNA replication in the autonomous
parvoviruses. Semin. Virol.6:271–281.
9.Drummond, A. J., S. Y. Ho, M. J. Phillips, and A. Rambaut.2006. Relaxed
phylogenetics and dating with confidence. PLoS Biol.4:e88.
10.Drummond, A. J., and A. Rambaut.2007. BEAST: Bayesian evolutionary
analysis by sampling trees. BMC Evol. Biol.7:214.
11.Eis-Hubinger, A. M., U. Reber, T. Abdul-Nour, U. Glatzel, H. Lauschke, and U. Putz.2001. Evidence for persistence of parvovirus B19 DNA in livers of
adults. J. Med. Virol.65:395–401.
12.Ekman, A., K. Hokynar, L. Kakkola, K. Kantola, L. Hedman, H. Bonde´n, M. Gessner, C. Aberham, P. Norja, S. Miettinen, K. Hedman, and M. So ¨der-lund-Venermo.2007. Biological and immunological relations among human
parvovirus B19 genotypes 1 to 3. J. Virol.81:6927–6935.
13.Gilbert, N. L., T. W. Gyorkos, C. Beliveau, E. Rahme, C. Muecke, and J. C. Soto.2005. Seroprevalence of parvovirus B19 infection in daycare educators.
Epidemiol. Infect.133:299–304.
14.Heegaard, E. D., and K. E. Brown. 2002. Human parvovirus B19. Clin.
Microbiol. Rev.15:485–505.
15.Hokynar, K., J. Brunstein, M. Soderlund-Venermo, O. Kiviluoto, E. K. Partio, Y. Konttinen, and K. Hedman.2000. Integrity and full coding se-quence of B19 virus DNA persisting in human synovial tissue. J. Gen. Virol.
81:1017–1025.
16.Hokynar, K., M. Soderlund-Venermo, M. Pesonen, A. Ranki, O. Kiviluoto, E. K. Partio, and K. Hedman.2002. A new parvovirus genotype persistent in
human skin. Virology302:224–228.
17.Isa, A., V. Kasprowicz, O. Norbeck, A. Loughry, K. Jeffery, K. Broliden, P. Klenerman, T. Tolfvenstam, and P. Bowness.2005. Prolonged activation of
virus-specific CD8⫹T cells after acute B19 infection. PLoS Med.2:e343.
18.Jenkins, G. M., A. Rambaut, O. G. Pybus, and E. C. Holmes.2002. Rates of molecular evolution in RNA viruses: a quantitative phylogenetic analysis. J.
Mol. Evol.54:156–165.
19.Kerr, J. R., J. P. Cartron, M. D. Curran, J. E. Moore, J. R. Elliott, and R. A. Mollan.1995. A study of the role of parvovirus B19 in rheumatoid arthritis.
Br. J. Rheumatol.34:809–813.
20.Kleinman, S. H., S. A. Glynn, T. H. Lee, L. Tobler, L. Montalvo, D. Todd, J. E. Kiss, V. Shyamala, and M. P. Busch.2007. Prevalence and quantitation of parvovirus B19 DNA levels in blood donors with a sensitive polymerase
chain reaction screening assay. Transfusion47:1756–1764.
21.Koppelman, M. H., I. G. Rood, J. F. Fryer, S. A. Baylis, and H. T. Cuypers.
2007. Parvovirus B19 genotypes 1 and 2 detection with real-time polymerase
chain reaction assays. Vox Sang.93:208–215.
22.Kuhl, U., M. Pauschinger, M. Noutsias, B. Seeberg, T. Bock, D. Lassner, W. Poller, R. Kandolf, and H. P. Schultheiss.2005. High prevalence of viral genomes and multiple viral infections in the myocardium of adults with
“idiopathic” left ventricular dysfunction. Circulation111:887–893.
23.Kurtzman, G. J., B. J. Cohen, A. M. Field, R. Oseas, R. M. Blaese, and N. S. Young.1989. Immune response to B19 parvovirus and an antibody defect in
persistent viral infection. J. Clin. Investig.84:1114–1123.
24.Liefeldt, L., A. Plentz, B. Klempa, O. Kershaw, A. S. Endres, U. Raab, H. H. Neumayer, H. Meisel, and S. Modrow.2005. Recurrent high level parvovirus B19/genotype 2 viremia in a renal transplant recipient analyzed by real-time
PCR for simultaneous detection of genotypes 1 to 3. J. Med. Virol.75:161–
169.
25.Luo, W., and C. R. Astell.1993. A novel protein encoded by small RNAs of
parvovirus B19. Virology195:448–455.
26.Manning, A., V. Russell, K. L. G. H. Eastick, N. Hallam, K. E. Templeton,
and P. Simmonds.2006. Epidemiological profile and clinical associations of
human bocavirus and other human parvoviruses. J. Infect. Dis.194:1283–
1290.
27.Manning, A., S. J. Willey, J. E. Bell, and P. Simmonds.2007. Comparison of tissue distribution, persistence, and molecular epidemiology of parvovirus B19 and novel human parvoviruses PARV4 and human bocavirus. J. Infect.
Dis.195:1345–1352.
28.Mossong, J., N. Hens, V. Friederichs, I. Davidkin, M. Broman, B. Litwinska, J. Siennicka, A. Trzcinska, P. V. Damme, P. Beutels, A. Vyse, Z. Shkedy, M. Aerts, M. Massari, and G. Gabutti.2007. Parvovirus B19 infection in five European countries: seroepidemiology, force of infection and maternal risk of infection. Epidemiol. Infect. [Epub ahead of print.] doi:10.1017/ S0950268807009661.
29.Nguyen, Q. T., S. Wong, E. D. Heegaard, and K. E. Brown.2002. Identifi-cation and characterization of a second novel human erythrovirus variant,
A6. Virology301:374–380.
30.Norja, P., K. Hokynar, L. M. Aaltonen, R. Chen, A. Ranki, E. K. Partio, O. Kiviluoto, I. Davidkin, T. Leivo, A. M. Eis-Hubinger, B. Schneider, H. P. Fischer, R. Tolba, O. Vapalahti, A. Vaheri, M. Soderlund-Venermo, and K. Hedman.2006. Bioportfolio: lifelong persistence of variant and prototypic erythrovirus DNA genomes in human tissue. Proc. Natl. Acad. Sci. USA
103:7450–7453.
31.Parsyan, A., C. Szmaragd, J. P. Allain, and D. Candotti.2007. Identification and genetic diversity of two human parvovirus B19 genotype 3 subtypes.
J. Gen. Virol.88:428–431.
32.Pond, S. L., S. D. Frost, and S. V. Muse.2005. HyPhy: hypothesis testing
using phylogenies. Bioinformatics21:676–679.
33.Rohrer, C., B. Gartner, A. Sauerbrei, S. Bohm, B. Hottentrager, U. Raab, W. Thierfelder, P. Wutzler, and S. Modrow.2008. Seroprevalence of parvovirus B19 in the German population. Epidemiol. Infect. [Epub ahead of print.] doi:10.1017/S0950268807009958.
34.Sanabani, S., W. K. Neto, J. Pereira, and E. C. Sabino.2006. Sequence variability of human erythroviruses present in bone marrow of Brazilian patients with various parvovirus B19-related hematological symptoms.
J. Clin. Microbiol.44:604–606.
35.Schmidt, M., A. Themann, C. Drexler, M. Bayer, G. Lanzer, E. Menichetti, S. Lechner, D. Wessin, B. Prokoph, J. P. Allain, E. Seifried, and M. K. Hourfar.2007. Blood donor screening for parvovirus B19 in Germany and
Austria. Transfusion47:1775–1782.
36.Schneider, B., A. Hone, R. H. Tolba, H. P. Fischer, J. Blumel, and A. M. Eis-Hubinger.2008. Simultaneous persistence of multiple genome variants
of human parvovirus B19. J. Gen. Virol.89:164–176.
37.Servant, A., S. Laperche, F. Lallemand, V. Marinho, G. De Saint Maur, J. F. Meritet, and A. Garbarg-Chenon. 2002. Genetic diversity within human
erythroviruses: identification of three genotypes. J. Virol.76:9124–9134.
38.Shackelton, L. A., and E. C. Holmes.2006. Phylogenetic evidence for the
rapid evolution of human B19 erythrovirus. J. Virol.80:3666–3669.
39.Shapiro, B., A. Rambaut, and A. J. Drummond.2006. Choosing appropriate substitution models for the phylogenetic analysis of protein-coding
se-quences. Mol. Biol. Evol.23:7–9.
40.Simmonds, P., A. Tuplin, and D. J. Evans.2004. Detection of genome-scale ordered RNA structure (GORS) in genomes of positive-stranded RNA
viruses: implications for virus evolution and host persistence. RNA10:1337–
1351.
41.Soderlund, M., R. von Essen, J. Haapasaari, U. Kiistala, O. Kiviluoto, and K. Hedman.1997. Persistence of parvovirus B19 DNA in synovial
mem-branes of young patients with and without chronic arthropathy. Lancet349:
1063–1065.
42.St. Amand, J., and C. R. Astell.1993. Identification and characterization of a family of 11-kDa proteins encoded by the human parvovirus B19. Virology
192:121–131.
43.Tamura, K., J. Dudley, M. Nei, and S. Kumar.2007. MEGA4: molecular evolutionary genetics analysis (MEGA) software version 4.0. Mol. Biol. Evol.
24:1596–1599.
44.Vyse, A. J., N. J. Andrews, L. M. Hesketh, and R. Pebody.2007. The burden of parvovirus B19 infection in women of childbearing age in
England and Wales. Epidemiol. Infect.135:1354–1362.
45.Yang, Z.1997. PAML: a program package for phylogenetic analysis by
maximum likelihood. Comput. Appl. Biosci.13:555–556.
46.Zhi, N., I. P. Mills, J. Lu, S. Wong, C. Filippone, and K. E. Brown.2006. Molecular and functional analyses of a human parvovirus B19 infectious clone demonstrates essential roles for NS1, VP1, and the 11-kilodalton
protein in virus replication and infectivity. J. Virol.80:5941–5950.