This is a repository copy of Effect of temperature-dependent air properties on the accuracy
of numerical simulations of thermal airflows over pinned heat sinks.
White Rose Research Online URL for this paper:
http://eprints.whiterose.ac.uk/106551/
Version: Accepted Version
Article:
Al-Damook, A, Summers, JL, Kapur, N et al. (1 more author) (2016) Effect of
temperature-dependent air properties on the accuracy of numerical simulations of thermal
airflows over pinned heat sinks. International Communications in Heat and Mass Transfer,
78. pp. 163-167. ISSN 0735-1933
https://doi.org/10.1016/j.icheatmasstransfer.2016.08.020
© 2016. This manuscript version is made available under the CC-BY-NC-ND 4.0 license
http://creativecommons.org/licenses/by-nc-nd/4.0/
[email protected] https://eprints.whiterose.ac.uk/ Reuse
Unless indicated otherwise, fulltext items are protected by copyright with all rights reserved. The copyright exception in section 29 of the Copyright, Designs and Patents Act 1988 allows the making of a single copy solely for the purpose of non-commercial research or private study within the limits of fair dealing. The publisher or other rights-holder may allow further reproduction and re-use of this version - refer to the White Rose Research Online record for this item. Where records identify the publisher as the copyright holder, users can verify any specific terms of use on the publisher’s website.
Takedown
If you consider content in White Rose Research Online to be in breach of UK law, please notify us by
1
Effect of temperature-dependent air properties on the accuracy of numerical simulations of thermal airflows over pinned heat sinks
Amer Al-Damook1,2, J.L. Summers1, N. Kapur1, H. Thompson1
1School of Mechanical Engineering, University of Leeds, UK
2Mechanical Engineering Department, University of Anbar, MOHESR, HCED, Iraq
Abstract
The importance of accounting for the temperature-dependence of air properties in numerical simulations of air flows over pinned heat sinks is demonstrated by comparisons with recently published experiments. Numerical simulations, based on a conjugate heat transfer analysis, using the RANS-based modified k- turbulence model, with temperature-dependent air properties are shown to be in significantly better agreement with experimental measurements of pressure drop, heat transfer coefficient and heat sink base temperature, than those which employ constant air properties.
Keywords: temperature-dependent air properties, conjugate heat transfer, turbulent airflow, pinned heat sink.
_______________________________ *Corresponding author: Email:[email protected] Nomenclatures Reynolds number Re
cross-sectional area of the flow passage of the heat sink, m2
Ac
temperature, oC T
pin diameter of the pin fin heat sink, mm D
Base temperature, 0C Tbase
perforation diameter of the pin fin, mm d
temperature difference, oC
∆T hydraulic diameter, m
h D
air velocity, m/s U
pin fin height, mm H
Greek heat transfer coefficient, W/m2.K
H
fluid thermal diffusivity, m2/s turbulence kinetic energy, m2s-2
k
turbulence model constant
, , *
number of perforations n
fluid viscosity, Pa·s number of pins
N
turbulent eddy viscosity, Pa.s t
heat sink length, mm L
fluid density, kg/m3 Nusselt number
Nu
kinematic viscosity, m2/s fan power, W
fan P
turbulent kinematic viscosity, m2/s t
pressure drop, Pa
∆P
k- turbulence model constant Prandtl number
Pr
turbulence model constant for the k-equation
turbulent Prandtl number t
Pr
k- turbulence model constant power applied on the base, W
Q
pin pitch in streamwise direction, mm Sz
2
1. INTRODUCTION
Rising heat flux densities are presenting the micro-electronics industry with a number of
formidable challenges in providing adequate cooling to avoid thermally-induced failure modes [1].
This paper considers the most popular approach to micro-electronics cooling, recently shown to
account for more than 80% of its thermal management solutions, namely convective heat transfer
to air as it flows over a network of extended surface fins on a heat sink [2]. Although plate fin heat
sinks (PFHSs) are the most common heat sink designs [3], a number of recent studies have
demonstrated the benefits of employing strip [4], and pin fins are more effective turbulence
promoters which break up the thermal boundary layer that would otherwise form over the heat
sink [5] and [6].
These studies have also shown that perforating the fins in heat sinks can offer substantial
performance benefits for micro-electronics cooling, enabling lower processor temperatures to be
achieved with less mechanical power consumption. Al-Damook et al [7], for example, used
complementary experimental and numerical methods to explore the benefits of using multiple pin
perforations in pinned heat sinks (PHSs) and Al-Damook et al [8] have reported the benefits of
optimum rectangular slotted and notched pin perforations, while Al-Sallami et al [4] extended this
work to consider the benefits of multiple perforations and fin arrangement for heat sinks with strip
fins. However, as in previous numerical simulations of thermal air flows over heat sinks, both
studies ignored the variation in air flow properties that inevitably results from the temperature
variation across heat sinks and proposed that the discrepancies of up to 15% that they found
between their experimental measurements and numerical predictions may be due to the practical
difficulties of achieving exact perforation alignment and additional thermal resistance and surface
roughness induced during the manufacturing process.
This paper demonstrates that the discrepancies between experiment and theory for thermal
airflows over heat sinks can be reduced significantly by accounting for temperature-dependent air
properties in the numerical simulations. The paper is organised as follows. Section 2 describes
the conjugate heat transfer model for the thermal airflows past the PHS under consideration and
the numerical methods to solve them. Numerical solutions for with and without
temperature-dependent air properties are compared with the recently-published experimental data of
3
2. NUMERICAL METHODS
2.1 Geometry description and governing equations
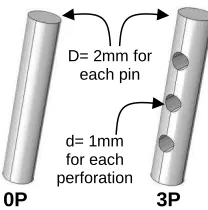
The aluminium PHS configurations considered here are those studied experimentally by
Al-Damook et al [7], with base dimensions 50mm x 50mm x 2mm an array of equally spaced pins
(with 6.5mm separation in the longitudinal and transverse directions) of circular cross-section of
diameter and height 2mm and 10mm respectively. Thermal airflows past PHS configurations with
solid pins (0P) and perforated pins (3P), as defined in Figure 1, are considered.
A conjugate heat transfer model is used, where the thermal airflow through the PHS is analysed
using Computational Fluid Dynamics (CFD). The inlet air temperature is set to 18oC and the inlet
air velocity is varied between 6.5m/s and 12m/s leading to Reynolds numbers in the range
3500-6580 based on a length scale given by the hydraulic diameter of the duct Dh=2H.B/(H+B), where
H and B are height and width of duct in which the heat sink is located, respectively. The rate of
heat conduction through the aluminium heat sink is balanced by heat transfer by convection into
the moving air stream, through a coupled boundary condition at the solid/fluid interface, as
illustrated in Figure 2.
In the solid heat sink the temperature field Ts is obtained by solving the steady heat conduction
equation
0
)
.(
k
sT
s (1)where ks=202W/m.K is the thermal conductivity of the aluminium heat sink. Turbulent airflow
through the PHSs is modelled using Reynolds-Averaged Navier-Stokes (RANS) equations, Zhou
& Catton [9], where the continuity, momentum and energy equations have variables decomposed
into mean and fluctuating components, leading to:
0
.
U
t
(2)
'
'
.
.
U
U
U
U
t
U
(3)
where
T
U U I
p
andU'U't
U
U
T
2 3(kI) are the Newtonianand Reynolds Stress tensors respectively, is the air viscosity, its density, U and
U
'
the4
tensor. The RANS equations are solved with the energy equation for the temperature field in the
fluid, Tf, with a heat source Watts, using the following equation
Q T C k T C U t T C f t t p f p f p Pr ) ( .
(4)
where Cp is the specific heat capacity of the air, Pr and are the Prandtl number and kinematic
viscosity of the air respectively and the subscript t indicates their turbulent counterparts.
Following Al-Damook et al [7] and Zhou & Catton [9] the thermal airflow through the heat sink is
modelled using the k- SST model and the effects of radiative heat transfer are neglected. The
equations for the SST model are not reproduced here for reasons of brevity.
2.2 Computational domain and boundary conditions
The computational problem is reduced in size by exploiting the symmetry of the PHS to apply
symmetry boundary conditions along the sides of the channel (Figure 3). This domain should be
far enough at the entrance and exit regions of heat sinks to avoid any reverse flow and the side
effects of boundaries. Therefore, the entrance and exit regions are a distance of 12.5d away from
the heat sink in the X-direction of flow.
The fluid and thermal conditions are assumed to be:
1- At inlet airflow: 6.5m/s ≤ Uair ≤ 12m/s, and the inlet air temperature: Tin=18oC.
2- Interface solid-fluid surfaces (pinned heat sink): no-slip condition Uin=0m/s, and heat flux
is conserved dn dT k dn dT k s s f
f. .
3- At the bottom base wall of heat sinks: no-slip condition Uair=0m/s, and a uniform heat flux
of Q=20000W/m2.
4- At the outlet pressure airflow: P=Pgage=0Pa,
0
dx
dT
5- Top wall and other surfaces: Uair=0m/s,
0
dz
dT
6- Right and left sides: Symmetry surfaces
0
dy
du
,
0
dy
dT
2.3 Solution Methods and Convergence Criteria
The finite volume method-based code, ANSYS FLUENT [10] is used to solve the fully coupled
momentum and energy equations, using second order upwinding, while continuity is satisfied
5
quality of the numerical prediction near curved pin surfaces. Computation is started first by solving
the continuity, momentum, k and equations to determine the flow field and then the energy
equation to find the thermal field in the computational region. The procedure continues until the
sum of the residuals of continuity and momentum equations in each cell is less than 10-4 and for
energy equation is taken smaller than 10-6. The variation of viscosity ( ), density ( ), thermal
conductivity (k), and thermal capacity (Cp) with temperature is accounted for using the data from
̧engel et al [11] shows in Table 1. The CFD model accounts for their variation by calculating their values at specific temperatures by linear interpolation between the data points in Table 1.
3. Results and Discussion
The conjugate heat transfer model used here has been validated previously against a range of
experimental and numerical data, see Al-Damook et al [7], [8] and [12]. A brief set of results is
now presented which demonstrate the benefits of incorporating temperature-dependent viscosity
( ), density ( ), thermal conductivity (k), and thermal capacity (Cp) into numerical simulations of
thermal airflows over heat sinks. Inlet air velocities are varied from 6.5m/s to 12m/s for the range
of Reynolds number is 3500-6580. Numerical results are presented for both constant
thermo-physical properties evaluated at 18oC (Num.) and variable thermo-physical properties (Num.
Variable), where the air properties , , k, and Cp are approximated by linear interpolation from
the data presented in Table 1. These are compared against the experimental data of Al-Damook
et al [7] for PHSs with solid (0P) pins and pins with three circular perforations (3P).
3.1 Effect of variable air properties on pressure drop
Mechanical energy is required to overcome the pressure drop, P, that results from flow over a
heat sink. It is therefore important to reduce P and the associated fan power required to
overcome the pressure drop, Pfan=U.Ac. P, whereU is the inlet air velocity and Ac is the
cross-sectional area of the flow passage of the heat sink=H.Sz.(N-1), where Sz is the uniform pin
spacing. Figure 5(a) compares predictions of P against the experimental data. Note that the use
of perforated pins results in reductions in P of up to 9%, Al-Damook et al [7]. For the solid and
perforated pins, the pressure drops predicted using constant air properties are typically 10% lower
than the experimental data, whereas for predictions using variable air properties the error has
halved to around 5%. It is likely that this improvement is due to the increase in viscosity as the air
temperature raises that required higher pressure drop to push the air through the heat sink. Figure
5(b) shows the effect that this improvement has on predictions of the fan power consumption,
6
3.2 Effect of variable air properties on heat transfer
Figure 6 compares experimental measurements of Nusselt number, Nu and CPU temperature
Tcase, for heat sinks with the 0P and 3P pin designs against numerical calculations using either
constant or variable air properties. Nusselt number is defined by Nu = h.L/kair, in terms of the heat
transfer coefficient, h (W/m2K), the length of the heat sink in the flow direction , L (m), and kair
(W/mK), the thermal conductivity of the air. The heat transfer coefficient is defined by
, where AT is the total surface area including the pin and perforation surface areas (m2),
Ts is the heat sink pin surface temperature and Tm is the average bulk mean temperature
Tm=(Tin+Tout)/2.
Figure 6 presents the corresponding experimental measurements and numerical predictions of
Nusselt number. The data shows that both Nu increases approximately linearly with the inlet air
velocity and that the 3P pin fins design achieves a significant enhancement in heat transfer. The
experimental values of Nu is typically 10% smaller than those predicted numerically with constant
air properties, whereas for those with variable air properties, discrepancy is reduced to 5%.
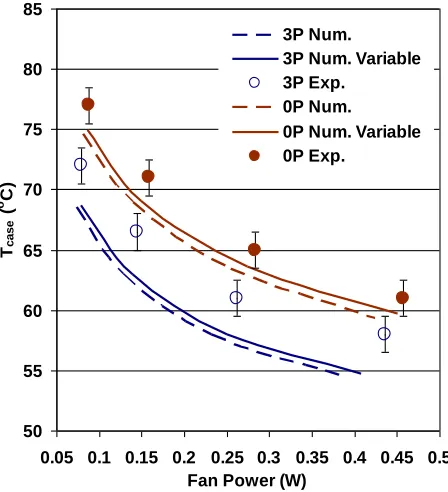
Figure 8 compare experimental measurements and numerical predictions for the CPU
temperature, Tcase. Since the experimental heat transfer coefficients are lower than the
predictions, it follows that the experimental Tcase values will be larger. Experimental Tcase values
for a heat sink with the perforated 3P pins are typically around 6% smaller than for solid pin fins.
The error numerical predictions of Tcase with constant thermo-physical properties is nearly 3% and
5% for 0P and 3P heat sink models respectively, while with variable thermo-physical properties
are typically 2% and 4% for 0P and 3P heat sink models respectively (1.5oC larger) and therefore
closer to the experimental results than with constant air properties.
4. Conclusion
This paper is the first to quantify the benefits of accounting for thermal variations of air properties
on the accuracy of numerical predictions of thermal airflows over heat sinks. It has shown that the
discrepancies between the experimental and the numerical prediction with constant air properties
of up to 15% can be reduced to between 5-10% when variable air properties are incorporated into
numerical simulations, as shown on Table 2. It is likely that the main factor that should be
accounted for is the air viscosity which rises significantly with temperature, causing increased
pressure losses and reduced heat transfer over the heat sink, in line with the recent experimental
data of Al-Damook et al [7]. Based on this study, it is recommended that the variable air properties
7
5. Acknowledgements
The authors would like to thank the Higher Committee for Education Development in Iraq (HCED),
Iraqi Ministry of Higher Education and Scientific Research (MOHE), and Mechanical Engineering
Department University of Anbar, Iraq for financial support of this work (Amer Al-Damook:
8
References
1. S. Gurrum, S. Suman, Y. Joshi and A. Fedorov, "Thermal Issues in Next-Generation
Integrated Circuits", IEEE Transactions on Device and Materials Reliability, vol. 4, no. 4,
pp. 709-714, 2004.
2. A. McWilliams, "The Market for Thermal Management Technologies - SMC024G",
Bccresearch.com, 2015. [Online]. Available:
http://www.bccresearch.com/market-
research/semiconductor-manufacturing/thermal-management-technologies-market-smc024g.html. [Accessed: 22- Dec- 2015].
3. M. Shaeri and M. Yaghoubi, "Numerical analysis of turbulent convection heat transfer
from an array of perforated fins", International Journal of Heat and Fluid Flow, vol. 30, no.
2, pp. 218-228, 2009.
4. W. Al-Sallami, A. Al-Damook, H.M. Thompson, ‘A Numerical Investigation of Thermal Airflows over Strip Fin Heat Sinks, International Communications in Heat and Mass
Transfer, 75, 183-191, 2016.
5. B. Sahin and A. Demir, “Thermal performance analysis and optimum design parameters
of heat exchanger having perforated pin fins”, Energy Conversion and Management, vol.
49, no. 6, pp. 1684-1695, 2008.
6. B. Sahin and A. Demir, “Performance analysis of a heat exchanger having perforated
square fins”, Applied Thermal Engineering, vol. 28, no. 5-6, pp. 621-632, 2008.
7. A. Al-Damook, N. Kapur, J. Summers and H. Thompson, “An experimental and computational investigation of thermal air flows through perforated pin heat sinks”, Applied Thermal Engineering, vol. 89, pp. 365-376, 2015.
8. A. Al-Damook, N. Kapur, J. Summers and H. Thompson, Computational Design and
Optimisation of Pin Fin Heat Sinks with Rectangular Perforations, Applied Thermal
Engineering Journal, 2016
9. F. Zhou and I. Catton, “Numerical Evaluation of Flow and Heat Transfer in Plate-Pin Fin Heat Sinks with Various Pin Cross-Sections”, Numerical Heat Transfer, Part A: Applications, vol. 60, no. 2, pp. 107-128, 2011.
10. ANSYS FLUENT User's Guide, 2011
9
12. A. Al-Damook, N. Kapur, J. Summers and H. Thompson, Effect of Different Perforations
Shapes on the Thermal-hydraulic Performance of Perforated Pinned Heat Sinks. Journal
of Multidisciplinary Engineering Science and Technology, vol.3, no. 4, pp. 4466-4474,
10
Table Captions
Table 1 : The variation air properties with increasing air temperature.
Table 2: The errors percentage between the experimental and numerical data at constant and
[image:11.612.101.513.184.338.2]variable air properties.
[image:11.612.96.511.445.526.2]Table 3 : The variation air properties with increasing air temperature.
Table 4: The errors percentage between the experimental and numerical data at constant and variable air properties.
Type of properties P (Pa) NuT Tcase (oC)
Constant air properties 10% 10% 0P 3P
3% 5%
Variable air properties 5% 5% 0P 3P
2% 4%
Air temperature (oC)
Dynamic Viscosity
(kg/m.s)
Density (kg/m3)
Thermal Conductivity
(W/m.K)
Specific Heat (J/kg.K)
15 1.802 × 10⁵ 1.225 0.02476 1007
25 1.849 × 10⁵ 1.184 0.02551 1007
45 1.941 × 10⁵ 1.109 0.02699 1007
60 2.008 × 10⁵ 1.059 0.02808 1007
80 2.096 × 10⁵ 0.9994 0.02953 1008
100 2.181 × 10⁵ 0.9458 0.03095 1009
11
[image:12.612.252.356.319.424.2]Figure captions
Figure 1: Solid (0P) and perforated (3P) perforations considered [7].
Figure 2: Conjugate heat transfer model for the PHS [7].
Figure 3: Schematic diagram of the flow domain used in the CFD analyses, shown eight
perforated pin fins [12].
Figure 4: Effect of pin perforations on (A) pressure drop and (B) fan power as a function function
of airflow speed..
Figure 5: Effect of inlet velocity on Nusselt number based on total surface area.
Figure 6: Comparison between experimental and numerical predictions of influence of fan power
[image:12.612.177.447.490.576.2]on Tcase.
Figure 1: Solid (0P) and perforated (3P) perforations considered [7].
Figure 2: Conjugate heat transfer model for the PHS [7]. 3P
0P
D= 2mm for each pin
d= 1mm for each perforation
Constant Heat Flux Cool Inlet
Flow Conjugate Heat Transfer
12
Inlet
Constant Heat Flux
Outlet
Perforated Pin Fins
Symmetry right side surface Symmetry left
side surface
Adiabatic other walls
[image:13.612.162.462.79.265.2]Perforated Pinned Heat Sink
Figure 3: Schematic diagram of the flow domain used in the CFD analyses, shown eight perforated pin fins [12].
Figure 4: Effect of pin perforations on (A) pressure drop and (B) fan power as a function of airflow speed. 33 43 53 63 73 83 93 103 113
6 7 8 9 10 11 12 13
U (m/s)
∆P
(P
a)
3P Num.
3P Num. Variable 3P Exp.
0P Num.
0P Num. Variable 0P Exp. 0.05 0.1 0.15 0.2 0.25 0.3 0.35 0.4 0.45 0.5
6 7 8 9 10 11 12 13
U (m/s) F a n P o w e r (W ) 3P Num.
3P Num. Variable 3P Exp.
0P Num.
0P Num. Variable 0P Exp.
[image:13.612.79.561.352.597.2]13
Figure 5: Effect of inlet velocity on Nusselt number based on total surface area.
Figure 6: Comparison between experimental and numerical predictions of influence of fan power on Tcase.
220 240 260 280 300 320 340 360 380 400 420
3250 3750 4250 4750 5250 5750 6250 6750
Re
Nu
3P Num.
3P Num. Variable 3P Exp.
0P Num.
0P Num. Variable 0P Exp.
50 55 60 65 70 75 80 85
0.05 0.1 0.15 0.2 0.25 0.3 0.35 0.4 0.45 0.5 Fan Power (W)
Tcase
(
o C)
3P Num.
3P Num. Variable 3P Exp.
0P Num.
[image:14.612.187.411.358.604.2]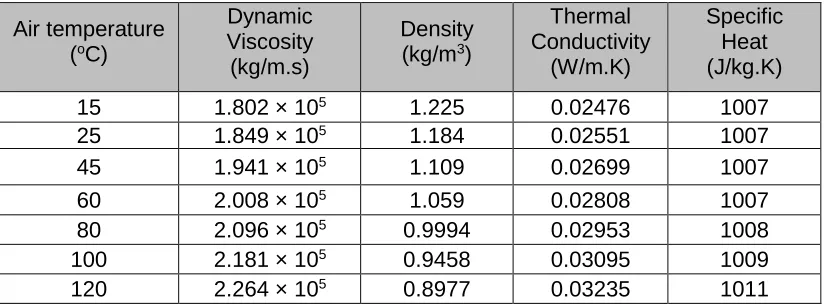
![Figure 3: Schematic diagram of the flow domain used in the CFD analyses, shown eight perforated pin fins [12]](https://thumb-us.123doks.com/thumbv2/123dok_us/7805611.171136/13.612.79.561.352.597/figure-schematic-diagram-flow-domain-analyses-shown-perforated.webp)