This is a repository copy of Web-based visualization for 3D data in archaeology : The ADS 3D viewer.
White Rose Research Online URL for this paper: http://eprints.whiterose.ac.uk/102438/
Version: Accepted Version
Article:
Galeazzi, Fabrizio, Callieri, Marco, Dellepiane, Matteo et al. (3 more authors) (2016) Web-based visualization for 3D data in archaeology : The ADS 3D viewer. Journal of archaeological science. pp. 1-11. ISSN 0305-4403
https://doi.org/10.1016/j.jasrep.2016.06.045
[email protected] https://eprints.whiterose.ac.uk/
Reuse
This article is distributed under the terms of the Creative Commons Attribution-NonCommercial-NoDerivs (CC BY-NC-ND) licence. This licence only allows you to download this work and share it with others as long as you credit the authors, but you can’t change the article in any way or use it commercially. More
information and the full terms of the licence here: https://creativecommons.org/licenses/
Takedown
If you consider content in White Rose Research Online to be in breach of UK law, please notify us by
Web-based Visualization for 3D Data in Archaeology: The ADS 3D Viewer
Journal of Archaeological Science: Reports
Fabrizio Galeazzi1, Marco Callieri2, Matteo Dellepiane2, Michael Charno1, Julian Richards1, Roberto Scopigno2
1. Archaeology Data Service, University of York.
2. Visual Computing Lab, ISTI – CNR, Pisa.
Abstract
The solid geometry of archaeological deposits is fundamental to the interpretation of their
chronological sequence. However, such stratigraphic sequences are generally viewed as static
two-dimensional diagrammatic representations which are difficult to manipulate or to relate
to real layers. The ADS 3D Viewer is a web-based resource for the management and analysis
of archaeological data. The viewer was developed to take advantage of recent developments
in web technology, namely the adoption of WebGL (Web Graphics Library) by current web
browsers. The ADS 3D Viewer combines the potential of the 3D Heritage Online Presenter
(3DHOP), a software package for the web-based visualization of 3D geometries, with the
infrastructure of the Archaeology Data Service (ADS) repository, in the attempt to create a
platform for the visualization and analysis of 3D data archived by the ADS.
Two versions of the viewer have been developed to answer the needs of different users. The
first version, the Object Level 3D Viewer, was implemented to extend the browsing capability
of ADS project archives by enabling the visualization of single 3D models. The second
version, the Stratigraphy 3D Viewer, is an extension which allows the exploration of a
specific kind of aggregated data: the multiple layers of an archaeological stratigraphic
sequence. This allows those unable to participate directly in the fieldwork to access, analyse and
re-interpret the archaeological context remotely. This has the potential to transform the
discipline, allowing inter-disciplinary, cross-border and ‘at-distance’ collaborative workflows,
and enabling easier access to and analysis of archaeological data.
Keywords: 3D documentation; archaeological excavation; archaeological stratigraphy;
1. Introduction
The analysis and interpretation of archaeological stratigraphic sequences is a complex process
which requires specific skills and expertise. The interpretation made on site is subjective and
cannot be repeated, since the archaeological excavation is a destructive and one-off process. It is
therefore important to develop innovative methodologies and tools that allow archaeologists or
other specialists unable to participate in the fieldwork to re-interpret the data collected on-site,
by preserving the stratigraphic sequence by means of digital 3D metric sampling. It is also
valuable to document individual excavation finds accurately and to allow remote visualization
and inspection. The active integration of traditional and innovative 3D practices can increase the
accuracy and realism of documentation, enabling richer and more complete recording.
Interest in digital visualization systems to facilitate the creation, exploration and presentation
of stratigraphic relationships began in 1975 with Wilcock’s STRATA program (1975). A
decade later, Ryan prepared the foundation for several subsequent developments, developing
an interactive system called gnet, which allowed interaction with and exploration of the
stratigraphic matrix diagram (Ryan 1985: 404-414), and this later evolved into jnet (Ryan
2001: 11). Several 2D applications for stratigraphic data presentation were developed in the
late 1980s (Alvey 1989; Boast and Chapman 1991; Herzog and Scollar 1991) but these had
limited take-up.
In 2004, researchers from the Department of Computer Science of Columbia University
developed VITA (Visual Interaction Tool for Archaeology; Benko et al. 2004: 132-140), a
collaborative mixed reality system for off-site visualization of an archaeological dig (Benko
et al. 2004: 132). The system supported the interaction of multiple users with the 3D replica
of the archaeological site, giving information about artefact location within the represented
space. It had great potential in terms of visualization, interaction and engagement, but lacked
a well-designed and solid database.
During the International Conference on Computer Applications and Quantitative Methods in
Archaeology 2007, Bobowski et al. (2008) presented a dynamic 3D visualization of Harris
matrix data. This tool, inspired by jnet and Strat (Bobowski et al. 2008: 2) is simple in terms of
visualization, but challenging in its attempt to combine 3D visualization and analysis.
Bobowski et al. (2008) created a virtual reality application that could access a database server
to integrate the vertical stratigraphy with horizontal topography of 3D Harris Matrix
visualization data.
Together, these projects developed 3D visualization for stratigraphic analysis, allowing
taken up in day-to-day archaeological practice. Whilst the majority of the visualization
systems were underpinned by well-made and solid databases, they provided only a schematic
3D graphic representation of the layers (Ryan 2001; Bobowski et al. 2008; Mills and Baker
2009). Others had powerful visualization systems but lacked a solid database (Benko et al.
2004). No one was able to create a solid database linked to a visualization system that could
display realistic 3D representations of archaeological stratigraphy, although there have been
some attempts to create prototype management systems for the visualization of 3D
representations of archaeological stratigraphy (Losier et al. 2007; Doneus et al. 2011; Stal et
al. 2014), or for visualizing 3D data using WebGL technology in other adjacent fields, such
as palaeontology (Michaux et al. 2015; Michaux et al. 2012), geology (Herzig et al. 2013;
Silvestre et al 2013) and digital humanities (Bozia et al. 2014; Matsushita et al. 2014).
The advent of WebGL brought to the availability of free or commercial solutions (i.e.
Sketchfab, Autodesk Smithsonian X3D) that provide high quality visualization and
interaction. Nevertheless, the features provided may not be enough to cover for the
necessities of peculiar applications, and no strong customization is possible. For this reason,
and ad-hoc system (possibly built on existing, more flexible tools) can be the solution.
Presently, a major challenge for Information Technology (IT) specialists and for
archaeologists working with archaeological 3D data consists of the long-term preservation
and dissemination of those data. It is essential that 3D visualisation tools are integrated within
stable long-term digital archives. In archaeology, the creation of digital data archives began in
the late 1980s (Richards 1998: 333-335), but the potential to visualize data in an interactive
and simple way has not yet been realized. Up to now, a large number of 3D digital data
archives have been produced but most focus on data preservation issues without considering
the accessibility of these data for the scientific community. The projects discussed above, for
instance, highlight increased interest in 3D aspects of data sharing and archaeological
analysis. Yet, most of these projects are conceived using off-line platforms, such as GIS. The
project developed by Stal et al. (2014) is the only example of a management system
accessible using a web browser.
Today, when developing an online interactive visualization system it is critical to integrate it
with existing databases and to provide access to the archived data in a simple way for all
kinds of users, including those unfamiliar with these technologies. To meet this need the ADS
3D Viewer, a 3D web-based environment for the management and analysis of archaeological
the Archaeology Data Service (ADS), a UK-based cyber-infrastructure hosted at the
University of York.
The extensive experience of the ADS in long term data preservation and access was an
essential element for the development of a robust 3D web-based platform. Solid
cyber-infrastructures such as ADS can facilitate the long term use of this new 3D tool not only in
academia but also among professional archaeologists and the general public. In this paper two
resources implemented in the ADS Viewer project are presented: the Object Level 3D
Viewer, which extends the browsing functionality of ADS project archives and allows the
dynamic visualization of single 3D models directly in the project webpage; and the
Stratigraphy 3D Viewer, which allows the visualization and analysis of a very specific kind
of aggregated data such as the different layers of an archaeological stratigraphic sequence.
The development of a 3D web-based platform for the analysis and visualization of
archaeological records is important for various reasons:
1. It facilitates decision-making about the continuation of archaeological campaigns,
since the holistic interaction with 3D metric reproductions of archaeological
sequences can facilitate the selection of new areas of interest and adjustments to
excavation strategies;
2. It simplifies the real-time interaction between excavators and other specialists
working out of the field. The possibility to upload online a 3D metric reproduction of
archaeological stratigraphy with related information enables archaeologists who
excavated the site a real-time remote interaction with other specialists who did not
take part in the fieldwork, establishing a collaborative interpretative process;
3. It builds upon existing 2D software and approaches for the analysis and visualization
of archaeological excavation sequences (i.e. Harris Matrix composer software),
adding realism and the third dimension;
4. It provides a new and more effective way to interrogate archives. The possibility to
link the archive dataset to a dynamic and realistic 3D reproduction of the excavation
enhances the understanding of the spatial relationship between units, features and
finds contained in the stratigraphic sequence. It provides a more user-friendly and
effective means of navigating stratigraphic and associated data than lists of isolated
2. Design
The advancement of web technology has caused a paradigm shift in the use of the web,
especially for 3D contents. Web browsers have become an effective computation platform, as
they are able to execute JavaScript code quite efficiently, and the HTML5 standard now
includes WebGL, a porting of the OpenGL 3D graphics library that runs directly inside the
browsers. The advent of WebGL has made possible the creation of many JavaScript graphics
libraries and 3D applications, transforming the way in which it is possible to access and
visualize 3D data on the web. This new technology allows the creation of platforms where
data archived in repositories can be viewed and explored dynamically, and used for data
analysis and interpretation directly within the web browser. WebGL produces an advance in
usability with respect to the obsolete explicit data download mode, which requires the use of
an appropriate application to open the specific data file type. The ADS 3D Viewer was
therefore developed so as to combine the expertise of ADS in digital data archiving with the
potential of the 3D Heritage Online Presenter (3DHOP; Potenziani et al. 2015). This permits
web-based visualization of 3D geometries in a simple way without the need for specific
computer graphic skills, whilst ensuring long-term preservation of the data.
3DHOP was preferred to other common tools for displaying 3D contents on the web, such as
Unity (Unity 2015), Sketchfab (Sketchfab 2015) and X3DOM (Behr et al. 2009), because it
seemed the best solution for the web-integrated visualization of single, high-resolution 3D
representations of artefacts and archaeological stratigraphy (for a more detailed comparison
between 3DHOP and other platforms see Potenziani et al. 2015 and Ponchio et al. 2015). This
choice is reinforced when looking at examples of interactive visualization systems for
archaeological stratigraphy developed using Unity (Trautner 2015). The viewer developed by
Thomas Trautner (2015) is a real-time renderer which allows the comparison of Harris
Matrix with measured 3D data and their manipulation. This research highlights Unity’s limit
in vertex count per mesh (65.534). When a high-resolution mesh is imported in Unity, the
software will automatically divide it into sub-meshes (Trautner 2015). This approach
represents a significant limitation when dealing with high-resolution 3D models, since the
fragmentation of the data is not recommended for their optimal long-term preservation and
archiving. 3DHOP was also preferred over the Adobe 3D navigation tool (Adobe 3D 2015).
Whilst providing a very powerful instrument for the publication and basic visualization of 3D
data, the Adobe tool does not allow fast and dynamic visualization of complex 3D data and
One of the most important aspects of 3DHOP is its ability to manage very high resolution 3D
meshes and point-clouds using a multi-resolution approach. The goal of a Multiresolution
approach is to convert a standard 3D model into a different data structure, which can be
effectively rendered at a specific optimized resolution and accuracy for each single frame. For
each view position and direction, the Multiresolution structure produces an optimal
representation based on a minimal number of triangles/points. Most of these methods divide the
model into multiple small portions of the input mesh (patches), build up other patches which
more synthetically represent the patch or groups of patches (i.e. having a reduced resolution),
and finally organize all those data with a representation structure (usually a graph) that is
consulted at rendering time to produce a specific view-dependent representation. 3DHOP
adopts the Nexus (2015) multi-resolution representation and rendering library. Nexus is a
documented, open source library (2015) and it has been integrated in a WebGL context in the
framework of the 3DHOP project. The Nexus multiresolution library provides very good
performances in terms of rendering speed and data compression. Since the 3D model is divided
in smaller patches, and only a small amount of patches is needed to render the model at any
given time, the use of the Nexus multiresolution structure also reduces the data loading time
and bandwidth, thanks to a progressive transmission feature (Potenziani et al. 2015).
2.1. Object Level 3D Viewer
Recent development of tools such as 3DHOP or Sketchfab demonstrate that it is now
technically possible to upload and visualize complex 3D models on the web. Nevertheless,
the integration of this type of media in the context of archaeological datasets is still difficult
to achieve. For this reason, the first step tried to find a way to include interactive visualization
in a standard archive. This had to be obtained in an automatic way, without any intervention
by the user. Hence, starting from the standard ADS project archives layout, the project
browsing functionality was extended to provide on-demand visualization of the data. Each
standard ADS project archive has a short introduction and a download section at the very
least. In the download section it is possible to view project data produced in different file
formats, such as JPG (2D images) and ASCII and OBJ (3D data). Before the development of
the ADS 3D Viewer it was only possible to interrogate archives by downloading individual
files on the user’s computer and reassembling the 3D geometry locally, which demands
medium-/high-level IT skills and access to software by the end user.
Since the granularity of the data preserved in the repository is at object level, an automatic
which contains all the other information related to the digital model. This was easily achieved
by exploiting the features of the 3DHOP tool (Potenziani et al. 2015) and was tested on the
Virtual Amarna project’s 3D data archived in ADS (DOI: 10.5284/1011330).
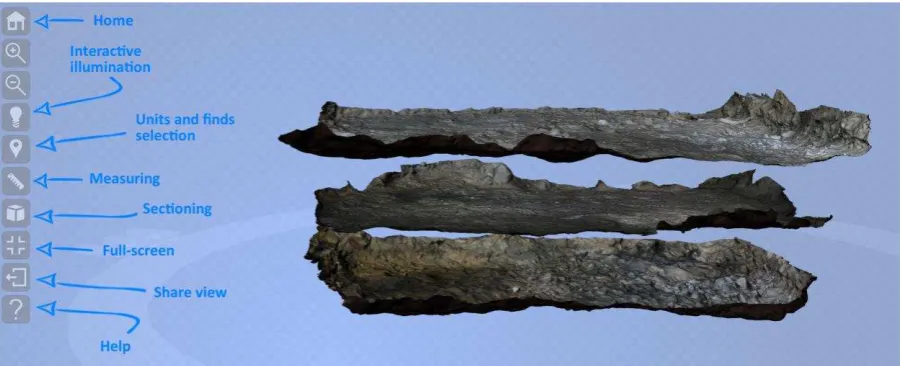
The ADS 3D Viewer, following the features of the 3DHOP tool, allows the user to browse 3D
geometry using a simple trackball-style functionality directly in the webpage, and contains all
the information related to the digital model without the need for plugins. The 3D viewer offers
users the possibility to interact with, manipulate and analyse the 3D model in the 3D window
embedded in the download web-page of the project, but also in full-screen mode using a
trackball and different features (viewpoint, zoom, solid colour and lighting; see fig.1).
The 3D viewer also allows users to take point-to-point measurements on the 3D model and,
using a "share view" feature, export the current settings of the 3D viewer (viewpoint, zoom,
and lighting) as a link that can be shared with other users (in the same way it is done in
Google Maps). Simple as they may seem, these features are nevertheless a way to directly use
the 3D models in the repository without having to download them and download/install/use
specialized 3D software.
The implementation of the ADS 3D Viewer was also simplified by creating reusable
components that could easily be deployed in other archives containing 3D data and models.
The middleware solution used by the ADS, as with most other middleware choices, allows
for the creation of components that can accept variables which are applied to a template. This
approach ensured that there is minimal effort required by the archivist when deploying the
ADS 3D Viewer and consistency across archives is guaranteed. A workflow was devised
which guides archivists through the process of enabling a deposited 3D model to be deployed
in the ADS 3D Viewer, with as much automation as possible. This ensured that the usability
and creation of the ADS 3D Viewer interface is simple and practical.
2.2. The Stratigraphy 3D Viewer.
Once a simple visualization tool was reached the next goal was to provide a more specialized
set of functionalities to achieve the goal of performing visual analysis of a very specific kind
of “aggregated” data such as the different layers of archaeological stratigraphy.
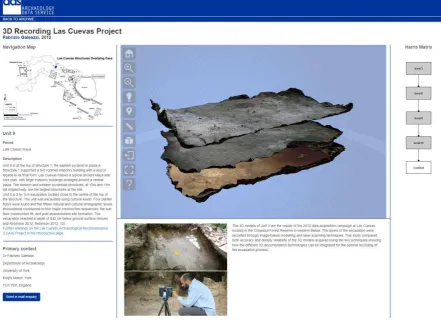
The Stratigraphy 3D Viewer was developed and tested using the 3D data of the 3D Recording
Las Cuevas Project (Galeazzi 2015). Before the development of the 3D viewer the ADS
repository stored the 3D models of each stratigraphic unit as single objects, without the
possibility to explore their spatial and temporal relationships. The Stratigraphy Viewer
aggregates the different geometric layers in a single 3D environment, whereby the user may
turn layers on and off, control their transparency, and explore the layered geometry using a
simple mouse- or touch-based navigation mechanism, especially designed to manipulate this
kind of geometries. The Stratigraphy Viewer not only permits exploration and interaction
with the different stratigraphic layers, but it also provides the option to take measurements
and to select hyperlinks that provide extra information about the features contained in the
Figure 2. Screenshot of the Stratigraphy 3D Viewer: 3D Recording Las Cuevas Project (DOI: 10.5284/1036099).
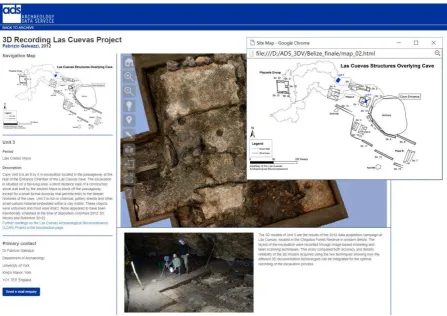
Archaeological sites characterized by complex archaeological sequences may require the
integration of high-resolution 3D representation of stratigraphic units from different areas of
the site or acquired in different fieldwork seasons. For this reason a 2D interactive map
interface was developed to support easier and faster selection and loading of the different
models and to allow the user to more easily interact with units coming from different areas of
the site (Fig. 3).
The partition of 3D data by area also allows the integration of new models over time, making
this tool suitable for archaeological projects characterized by multiple fieldwork seasons. In
this way the 3D representations of the units can be grouped either by fieldwork seasons or
areas (including units of the same area acquired in different seasons).
The 3D viewer also allows the simultaneous visualization of different areas of the site in case
it is required by a specific case study, to help the analysis and interpretation of adjacent areas
of the excavation. During tests, the infrastructure managed the simultaneous visualization of
3D models from two areas selected for the 3D Recording Las Cuevas Project (combining a
[image:10.595.73.515.77.398.2]rendering performances. Nonetheless, the ADS 3D Viewer should be tested with more
complex stratigraphic sequences to give a complete and effective assessment of its
performance and limitations. The Graphical User Interface (GUI) of the Stratigraphy Viewer
[image:11.595.73.521.172.488.2]is presented in figure 4.
Figure 3. Screenshot of the Stratigraphy 3D Viewer while selecting the area on the 2D interactive map of the site.
Table 1
Number of vertices and faces of the units’ 3D models.
Number of vertices Number of faces
Unit3_level2 5,232,038 10,456,690
Unit9_level3 3,969,735 7,928,481
Unit9_level6 1,638,052 3,270,816
Unit9_level9 1,112,204 2,220,257
Unit9_level10 1,532,443 3,060,647
[image:11.595.69.530.578.714.2]Figure 4. Screenshot of the Stratigraphy 3D Viewer GUI (Graphical User Interface).
3. Advanced features
3.1 Dynamic Harris Matrix
The Harris Matrix is a graph-based structure which enables the description of topological and
chronological relations between archaeological objects and stratigraphic units (Harris 1979).
Harris introduced the term “unit” stressing the physical relationships between the elements,
creating a system recognizable everywhere as stratigraphic entities (Harris 1979: 120). The
stratigraphic excavation method and Harris’suse of the term “unit” or “context” to describe the
individual deposition events revealed by the excavation process is in widespread usage today.
However, there are some exceptions where the method of excavating in arbitrary spits (or
“levels” in American archaeology) is still frequently used. The use of this method is common on sites which lack any visible or reconstructable stratigraphy, or when excavating through
intrusive or fill deposits (Roskams 2001: 112). For example, one of the main reasons for the use
of the arbitrary excavation unit in the arid western United States or in a cave environment,
where material coming from the roof over many years may bury artefacts and features, is that
many such sites are not physically stratified (Praetzellis 1993: 72).
Starting from the assumption that an arbitrary excavation method is frequently used in those
archaeological contexts where it is not possible to recognize physical layers and interfaces
between the strata (Carandini 1981: 51; Harris 1975: 20), the ADS 3D Viewer structure was
developed considering both methods. The viewer can easily be adapted to cases that use
The Harris Matrix element of the interface has been built dynamically using the D3 library
(http://d3js.org/) and JavaScript Object Notation (JSON) data files. Each context is
represented by a rectangle (or node in D3 parlance) and then relationships are represented by
lines (or vertices). The nodes and relationships are defined in a simple data structure using
JSON format (basically nested key-value pairs) which is then read by the D3 JavaScript
library. Basic JavaScript actions are wired to the nodes that represent the contexts in the
matrix, so that when a user clicks on the node the corresponding layer or context in the model
is made visible or hidden. This approach enables data-driven interface design, and therefore a
more loosely-coupled interface and model in the sense that data can be generated to represent
the Harris Matrix and so the interface to represent that matrix does not have to be manually
generated for each viewer. The Las Cuevas exemplar provides a very basic matrix, but this
approach can support more complex matrices with forking vertices and multiple branches.
The only current limitation is screen real-estate and readability, but that could easily be
addressed by sophisticated scaling and zooming if required.
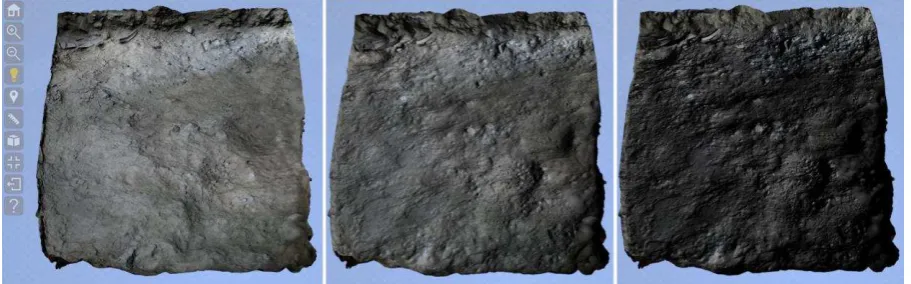
3.2. Visualization: interactive illumination, solid colour & transparency
Previous studies have demonstrated the importance of flexible visualization for the
understanding of textural information while analysing 3D replicas (Di Giuseppantonio et al.
2015). In the absence of a tactile experience with the real object, the possibility to use
different light settings, zooming in and out and removing original colour from the 3D models
helps users to grasp geometrical, textural or high-frequency detail information. One of the
first aims of this research is to give the user the possibility to interact with digital 3D replicas,
allowing the remote analysis and interpretation of the archaeological record. For this reason
visualization features that allow a better understanding of the 3D object texture qualities such
as lighting and solid colour, were integrated in the 3D viewer.
The interaction with the object can be greatly enhanced by adding some basic interaction
mechanism. The first one is the possibility to change the light direction: a controllable light
makes the surface details more visible in a straightforward way (Fig. 5).
The different 3D models associated with the layers can be rendered in a variety of ways, in
addition to the photorealistic rendering. For example, it is possible to make a layer (partially)
transparent, providing the option to analyse underlying layers without losing the relationship
with the current one. It is also possible to disable the colour information (acquired while
sampling the real archaeological site and encoded in the 3D model with recent texture or
colour information is useful in many situations, it is also true that the “naked” geometry may
reveal important information about the shape of the layer. These features have been easily
[image:14.595.71.527.156.298.2]integrated in the tool, being part of the set of basic features of 3DHOP.
Figure 5. Screenshot of the Stratigraphy 3D Viewer: interactive illumination feature.
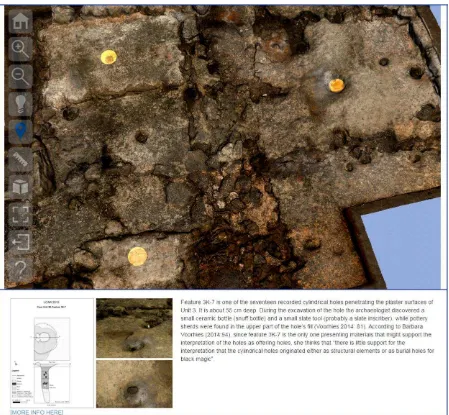
3.3. Units and finds selection tool (hotspots)
The 3DHOP hotspot feature was implemented and integrated in the Stratigraphy Viewer to
allow the user to interrogate the 3D units and have access to related information in the ADS
project archive. This information is represented by spots of different colours (the same colour
is assigned to finds of similar material). The transparency and size of the spots can be
changed based on the different needs of the case study. By selecting the spot (clicking on
them) the user can extract the associated information from the project archive (i.e. text,
images, unit recording sheets, etc.), viewing this data in a dedicated section of the ADS 3D
Viewer webpage (Fig. 6). This feature was integrated in the Stratigraphy Viewer, because the
development of new and more effective ways to interrogate archived data is a crucial element
in current archaeological practice. The units and finds selection tool, increasing the
understanding of the spatial relationship between units, features and finds contained in the
stratigraphic sequence, will allow the development of a more effective methodology to
interrogate digital archives.
The hotspot can be created as an independent geometrical entity or it could be a portion of the
3D model itself. In the example, a small sphere was used, but any geometry may be utilised.
The event of the user clicking a hotspot can be easily linked to several possible
functionalities, like presenting textural description, images, activating a link to other web
Figure 6. Screenshot of the Stratigraphy 3D Viewer: Units and finds selection tool (hotspots).
3.4. Measuring and section tools
Several operations that may be useful when excavating a site cannot be put in practice with
the usual documentation. One of them is the possibility to take measurements directly on the
geometry. Since 3D acquisition techniques (either active 3D scanning or image-based
modelling) can provide accurate metric models of the excavation, a simple interactive
measurement tool is part of the viewer (Fig. 7).
The measurement tool works in a very simple way: the user can pick two points on the
models, and the corresponding point-to-point (Euclidean) distance is calculated. This simple
tool can provide valuable information; other more advanced functionalities, like surface area,
volume measurement, or “on-the-surface” length measurement (geodesic distance) will be
Figure 7. Screenshot of the Stratigraphy 3D Viewer: Measuring feature.
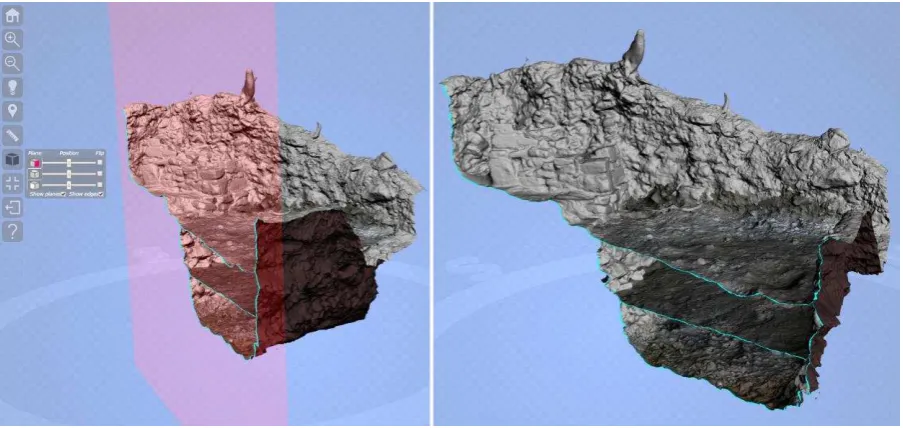
Working in the digital realm allows operations which are not possible when working on the
site. One of these is the sectioning of the excavation, in order to compare the different layers
and analyse their evolution.
The sectioning tool lets the user cut the stratigraphy along the three cardinal planes (the planes
orthogonal to X, Y and Z); with a simple interface, the user may activate either one, two or all
of three section planes at the same time, flip the section (cut the positive or the negative side of
[image:16.595.73.525.537.751.2]3.5. Share view feature
The share view feature was also implemented for the Stratigraphy Viewer and works
similarly to the corresponding feature of the Single Object Viewer. The user may share their
current view with a colleague, who will be able to see the excavation from the same point of
view, the same illumination and the same layer visibility and rendering parameters.
The idea is that the state of the visualization is exported as a string containing a series of
couples property:value, and the link is provided in a format such as:
http://www.domain/pagename. html?propetry1=value1&property2=value2
This solution follows the standard web protocol of webpage parameters. It enhances the
capability to support remote collaborative work between scholars, favouring remote
discussion of specific features/finds described in the 3D reproduction of the stratigraphic
sequence.
4. Data capture and 3D data pre-processing preparation
The first stage of the implementation of the ADS 3D Viewer was 3D data optimization and
conversion. The 3D data of the 3D Recording Las Cuevas project were acquired using both
active laser scanning and image-based modelling techniques, further processed using the
open source software MeshLab (MeshLab 2015; Galeazzi 2015). 3D data were exported and
archived in OBJ and PLY formats. Those initial data were standard triangle meshes encoded
at a single resolution (the full quality model produced from the sampled raw data). As already
presented before, the ADS 3D Viewer uses 3DHOP technology and thus the Nexus
multi-resolution format (Nexus 2015). Therefore, input data have to be converted from plain PLY
files to the Nexus format; this is accomplished entirely within Nexus with an automatic
process. The data conversion is a pre-processing operation, which has to be performed once
at the beginning of the page creation. The amount of time needed for the conversion is
proportional to the size of the mesh: a 9M triangle mesh is processed in less than 10 minutes.
There's is no need for strong hardware resources, being the process parallelized and
characterized by low memory usage. Additionally, the Visual Media Service of the Ariadne
EU Infrastructure (http://visual.ariadne-infrastructure.eu/) can provide a conversion in a
web-service fashion.
Nexus builds the multiresolution encoding by applying controlled geometric simplification to
small patches and stores all intermediate results in a data structure. Nexus supports also
compression of geometric data and progressive transmission (view-dependent, driven by each
optimal model for each single frame, by assembling different portions of the multi-resolution
model on-the-fly and building view-dependent representations at variable resolutions
(Potenziani et al. 2015). Thanks to the Nexus rendering library, the ADS 3D Viewer can
render a large variety of 3D data, from low resolution models (manual or image-based
modelling) to very high-resolution geometries (laser scanning or Structure-from-Motion
technologies). Nexus support both triangulated meshes, textured meshes and point-clouds.
File-naming standards were developed to make data management and archiving as
independent and compact as possible. File-naming is flexible and changes according to the
excavation method used by each case study (i.e. arbitrary or stratigraphic excavation
methods). For the 3D Recording Las Cuevas project the data were preserved using a
hierarchical description. The file name always starts with the name of the site and continues
with unit (area) and level (layer/unit) numbers, e.g. LasCuevas_Unit1_Level3.
The webpage was designed in order to be re-usable: all the data definition, in terms of names
of the files, names and ID of the layers, hotspots, and all the structured description of the
stratigraphy are stored in a JSON JavaScript data structure. When the page is first loaded, the
data structure is parsed and most of the page components are dynamically created, following
the content of the structure. This structure may be easily edited, as it is human-readable, and
it can also be generated directly from a database query. This, ideally, should make it easier to
create other Stratigraphy Visualization pages. In order to make the visualization more
effective, some excavations might need a specific set of features and some customization, but
the strategy described in this paper can cover most of the standard situations, providing a
reusable page template.
5. Sustainability
Working in the context of a digital archive requires sustainability to be at the forefront of
every technical decision that is made. Whilst the ADS is less concerned with the
sustainability of interfaces compared with the preservation of the underlying data,
undertaking work on interfaces that have a short life expectancy makes little business sense.
The official policy regarding the life-span of an ADS interface is that it should be functional
for 10 years from creation and then supported under a ‘best-efforts’ basis beyond that. This is
because the reality of working on the web is that interfaces beyond basic HTML can be
difficult to maintain, given the rate at which web technologies change and in particular the
to web standards can have inconsistent support across browsers, and relying on externally
developed JavaScript libraries or frameworks can lead to problems when those libraries or
frameworks are abandoned for whatever reason. The only time the ADS has been unable to
sustain an interface was in regard to the ArcIMS mapping interfaces it developed between
2002 and 2007. Here the issue was due to the commercial and proprietary nature of the
ArcIMS application produced by ESRI. When ESRI decided to discontinue support and
licensing for ArcIMS in 2013 (effectively making the software unusable), it meant that all the
ADS mapping interfaces that relied on ArcIMS were redundant. This lesson has led the ADS
to pursue technologies that are not commercial or proprietary to help minimise the potential
of a similar situation occurring again.
CNR has already demonstrated that sustainability and preservation of a 3D-enabled web
repository is possible, with the development and maintenance of the CENOBIUM system
(Corsini et al, 2010). This web system is a joint effort of Max Plank and CNR, started in 2006
and still alive and regularly updated (http://cenobium.isti.cnr.it/).
Therefore, the ADS 3D Viewers have been developed to ensure the greatest possible
sustainability. Each interface is dependent upon HTML5, CSS, WebGL, and JavaScript, all
standards with widespread support across most browsers. Therefore no plugins are required
and any middleware or backend applications required for the ADS 3D Viewers
implementation are proprietary or closed source. Likewise, the workflows and
implementation have been designed to be as technology agnostic as possible, so middleware
or applications currently used can be replaced as required. Because of all this, the interfaces
will be usable and functional for many years, although there are variables outside of our
control, such as browser support for WebGL and backwards compatibility for all
technologies employed in this project.
Considering the long-term sustainability of the infrastructure, we decided to leave the file
extraction and downloading at archive level. A link will direct the user from the 3D viewer
interface to the 3D model’s download page in the project archive. Since the 3D viewer allows
the visualization of multiple 3D models archived as separate files, the downloading from the
project archive instead than from the 3D viewer interface guarantees an easier management
of the data and duration of the infrastructure. The metadata associated with the 3D data
archived in ADS follow the Dublin Core metadata schema.
The ADS 3D Viewer open-source visualization platform could be easily adapted to other
online repositories and extended to different stakeholders. This characteristics, which are the
have on the discipline. First, the ADS 3D Viewer is based on a documented open-source
platform (3DHOP); therefore, managers of archaeological archives interested in replicating
the experience of ADS can start from the same basic platform and implement the same or
similar approaches. Moreover, there is a strong interest of ADS in sharing his experience and
internal developments with the community: the work done to design and implement the two
viewers presented in this paper can be shared with other archives, in case they found our
solution effective. Due to the overall architecture of the basic 3DHOP platform, interfacing a
different archive can be solved with a simple configuration fixing work.
6. Conclusions and future work
The ADS 3D Viewer infrastructure aims to contribute to an ongoing commitment of the
European Research Council to support cyber-infrastructures which enhance and promote
access to and preservation of European Cultural Heritage.
The ADS 3D Viewer is the first example of a web-based visualization system for the
preservation and analysis of archaeological stratigraphy integrated within the framework of a
trusted digital repository. One of the main strengths of the viewer is its flexibility and
adaptability. As described above, the ADS Stratigraphy 3D Viewer can be adapted and
applied to case studies that use different excavation methods (i.e. arbitrary or stratigraphic).
Moreover the structure of the viewer and the partition of 3D data can be adapted to case
studies that require different visualization and organisation of the archived data. In the case
study selected for this research 2D and 3D data were organized and divided by excavation
areas, but this can be easily changed if required by a specific project.
By increasing the accessibility of digital and metric 3D representations of the excavation
process and facilitating the interpretations made by different scholars of the same context on
the web, the ADS 3D Viewer will be a useful instrument for the remote, collaborative study
of complex archaeological datasets, promoting the use of 3D representations for the analysis,
interpretation and knowledge production in Archaeology.
One of the primary goals of the ADS 3D Viewer project was the development of a tool that
could have a significant impact upon archaeological practice, integrating both traditional and
innovative data acquisition methods. The ADS 3D Viewer will help us understand if the
effective integration of 3D technologies in day-to-day fieldwork practice is really possible,
favouring the ‘digital turn’ in the archaeological recording on site.
visualization platform, rather than a commercial component, will allow ADS to further
extend the supported features, addressing the specific needs of the community. Future
extensions include the following: (1) The infrastructure developed so far enables the
simultaneous and smooth visualization of the 3D models from the case study selected for
testing the viewer (3D Recording Las Cuevas Project, consisting of a total of 6
high-resolution 3D models, Table 1). The ADS 3D Viewer will be further tested with more
complex stratigraphic sequences to assess its performance and limitations. (2) Inclusion of
support for managing annotations, to allow members of a working group to insert
geo-localized comments. In the meantime it will be important to monitor user behaviour and
feedback to assess if we have indeed met the challenge of visualising solid archaeological
geometries.
Acknowledgements
The ADS 3D Viewer project was made possible thanks to funding from the ‘Marie Curie
Actions’ Seventh Framework Programme (http://cordis.europa.eu/programme/rcn/848_en.
html). We would like to thank the ADS team in York (http://archaeologydataservice.ac.uk/
about/contact) and the other members of the Visual Computing Lab (ISTI-CNR;
http://vcg.isti.cnr.it) in Pisa for their support. The collaboration between ADS and the Visual
Computing Lab was possible in the framework of the ARIADNE European project
(Niccolucci and Richards 2013; http://www.ariadne-infrastructure.eu/).
The 3D data used for testing the stratigraphy viewer were collected as part of Fabrizio
Galeazzi’s PhD dissertation (http://escholarship.org/uc/item/5718511j) during the
archaeological excavation at Las Cuevas (Belize) in 2012. We would like to thank the
director of the Las Cuevas Archaeological Reconnaissance (LCAR) project, Holley Moyes,
References
Adobe 3D, 2015. Adobe 3D Navigation Tools. Electronic document,
https://helpx.adobe.com/ acrobat/using/displaying-3d-models-pdfs.html#3d_preferences,
accessed November 15, 2015.
Alvey, B., 1989. Hindsite. Archaeological Computing Newsletter 19, 4-5.
Behr J, Eschler P, Jung Y, Zollner M., 2009. X3dom: a dom-based html5 ¨ /x3d 1160
integration model. In: Proceedings of the 14th International Conference 1161 on 3D Web
Technology. Web3D ’09; New York, NY, USA: ACM, p. 127–35.
Benko, H., Ishak, E.W., Feiner, S., 2004. Collaborative Mixed Reality Visualization of an
Archaeological Excavation. In: Proceedings of the International Symposium on Mixed and
Augmented Reality (ISMAR '04), November 2-5, 132-140. DOI>10.1109/ISMAR.2004.23
Boast R., Chapman, D., 1991. SQL and hypertext generation of stratigraphic adjacency
matrices. In: Lockyear, K., Rahtz, S. P. Q. (Eds.), Computer Application and Quantitative
methods in Archaeology. CAA Conference, Southampton, GB, March 1990. Oxford UK:
BAR International Series 565, 29–37.
Bobowski, B., Krzysztof W., Miroslaw S., 2008. Hybrid 3D Visualizations of Archaeological
Sites: Dynamic 3D Visualisations of Harris Matrix Data for Rescue Town Excavations,
Gda sk / Szafarnia Site, Poland. In: Posluschny, A., Lambers, K. and Herzog, I. (Eds.), Layers of Perception. Proceedings of the 35th International Conference on Computer
Applications and Quantitative Methods in Archaeology (CAA). Berlin, Germany, April 2–6,
2007. Kolloquien zur Vor- und Frühgeschichte 10, Bonn, 1–5.
Bozia, E., Barmpoutis, A. and Wagman, R. S., 2014. Open-Access Epigraphy: Electronic
Dissemination of 3D-digitized Archaeological Material. In: Orlandi, S., Santucci, R.,
Casarosa, V. and Liuzzo, P. M. (Eds.), Proceedings of the First EAGLE International
Conference on Information Technologies for Epigraphy and Cultural Heritage. Rome, IT:
Sapienza Università Editrice, 421-436.
Carandini, A., 1981. Storia della terra. Manuale di scavo archeologico. Torino: Giulio
Corsini M., Dellepiane M., Dercks U., Ponchio F., Keultjes D., Marinello A., Sigismondi R.,
Scopigno R., Wolf G. CENOBIUM - Putting together the romanesque cloister capitals of the
mediterranean region. B.A.R. - British Archaeological Reports International Series, vol. 2118
pp. 189 - 194. Archaeopress, 2010.
Di Giuseppantonio Di Franco, P., Camporesi, C., Galeazzi, F., Kallmann, M., 2015. 3D
Immersive Visualization and 3D Printing for Improved Perception/Interaction with Past
Material Culture. Presence: Teleoperators and Virtual Environments. Special Issue on Living
Virtual Heritage, MIT Press (in press).
Doneus, M., Verhoeven, G., Fera, M., Briese, C., Kucera, M., Neubauer, W., 2011. From
deposit to point cloud. A study of low-cost computer vision approaches for the
straightforward documentation of archaeological excavation. In: XXIII International CIPA
Symposium on Geomatics 6, 81–88.
Galeazzi, F., 2015. Towards the Definition of Best 3D Practices in Archaeology: Assessing 3D
Documentation Techniques for Intra-site Data Recording. Journal of Cultural Heritage.
DOI:10.1016/j.culher.2015.07.005
Harris, E. C., 1979. Principles of archaeological stratigraphy. London and New York:
Academic Press.
Herzig, P., Englert, M., Wagner, S., Jung, Y. and Bockholt, U., 2013. X3D-EarthBrowser:
visualize our earth in your web browser. In: Web3D ’13, Proceedings of the 18th International Conference on 3D Web Technology, 121-128. New York, USA: ACM Digital Library.
Herzog, I., Scollar, I., 1991. A new Graph Theoretic Oriented Program for Harris Matrix
Analysis. In: Lockyear, K. and Rahtz, S. P. Q. (Eds.), Computer Application and Quantitative
methods in Archaeology. CAA Conference, Southampton, GB, March 1990. Oxford UK:
BAR International Series 565, 53–59.
Losier, L.-M., Pouliot, J., Fortin, M., 2007. 3D geometrical modeling of excavation units at
the archaeological site of Tell ‘Acharneh (Syria). Journal of Archaeological Science 34, 272–
288.
MeshLab, 2015. MeshLab. Electronic document, http://meshlab.sourceforge.net/, accessed
Matsushita, R., Suita, H. and Yasumuro, Y., 2014. Digital Archive System with 3D Web
Portal Interface. In Ioannides, M., Magnenat-Thalmann, N., Fink, E., Žarnić, R., Yen, A.-Y.
and Quak, E. (Eds.), Digital Heritage. Progress in Cultural Heritage: Documentation,
Preservation, and Protection, Proceedings of the 5th International Conference, EuroMed 2014,
Limassol, Cyprus, November 3-8, 2014. Lectures Notes in Computer Science 8740, 564-571.
Michaux, J., Hautier L., Hutterer, R., Lebrun, R., Guy, F. and Garcia-Talavera, F., 2015. 3D
fossil reconstruction related to the publication: Body shape and life style of the extinct rodent
Canariomys bravoi from Tenerife, Canary Islands. MorphMuseumM 1 (4).
Michaux, J., Hautier L., Hutterer, R., Lebrun, R., Guy, F. and Garcia-Talavera, F., 2012.
Body shape and life style of the extinct rodent Canariomys bravoi (Mammalia, Murinae)
from Tenerife, Canary Islands (Spain). Comptes Rendus Palevol 11, 485-494.
Mills, H., Baker, M., 2009. The VERA Information Environment. In: Frischer, B., Crawford,
J.W. and Koller, D. (Eds.), Making History Interactive. Computer Application and
Quantitative methods in Archaeology (CAA): proceedings of the 37th international
conference, Williamsburg, Virginia, USA, March 22-26, 2009. Online Proceedings:
http://www.caa2009.org/articles/Mills_Contribution277_a.pdf, 1–10.
Nexus, 2015. Nexus, Multiresolution Visualization. Electronic document, http://vcg.isti.
cnr.it/nexus/, accessed October 28, 2015.
Niccolucci, F., Richards, J.D., 2013. ARIADNE: Advanced Research Infrastructures for
Archaeological Dataset Networking in Europe. International Journal of Humanities and Arts
Computing 7 (1-2), 70–88.
Ponchio, F., Dellepiane, M., 2015. Fast decompression for web-based view-dependent 3D
rendering. In: Jia, J., Hamza-Lup, F., Schreck, T. (Eds.), Web3D 2015. Proceedings of the 20th
International Conference on 3D Web Technology, 199-207. New York: ACM Digital Library.
Potenziani, M., Callieri, M., Dellepiane, M., Corsini, M., Ponchio, F., Scopigno, R., 2015.
3DHOP: 3D Heritage Online Presenter. Computer & Graphics 52, 129–141.
Praetzellis, A., 1993. The limits of arbitrary excavation. In: Harris, E. C., Brown M. R.,
Brown G. J. (Eds.), Practices of archaeological stratigraphy, 68-86. London and San Diego:
Richards, J.D., 1998. Recent Trends in Computer Applications in Archaeology. Journal of
Archaeological Research 6 (4), 331-382.
Roskams, S., 2001. Excavation. Cambridge and New York: Cambridge University Press.
Ryan, N.S., 1985. Interactive Tools in the Social Sciences. In: Johnson, P. and Cook, S.
(Eds.), People and Computers: Designing the Interface, Proc. British Computer Society
Human Computer Interaction Specialist Group Conference, University of East Anglia, 17–20
September, 1985. Cambridge, UK: Cambridge University Press, 404–414.
Ryan, N., 2001. JNet: A Successor to gnet. Proceedings Conference 6, Archaeologie und
Computer 2001.
Silvestre, I., Rodrigues, J. I., Figueiredo, M. and Veiga-Pires, C., 2013. Framework for 3D
data modelling and web visualization of underground caves using open source tools. In:
Web3D ’13, Proceedings of the 18th
International Conference on 3D Web Technology,
121-128. New York, USA: ACM Digital Library.
Sketchfab, 2009. Publish and find the best 3d content. Electronic document:
https://sketchfab.com/, accessed 15 October 2015.
Stal C., Van Liefferinge, K., De Reu, J., Docter, R., Dierkens, G., De Maeyer, P., Mortier, S.,
Nuttens, T., Pieters, T., van den Eijnde, F., van de Put, W., De Wulf, A., 2014. Integrating
geomatics in archaeological research at the site of Thorikos (Greece). Journal of
Archaeological Science 45, 112–125.
Trautner, T., 2015. Visualizin Archaeological Excavations based on Unity3D. In:
Proceedings of CESCG 2015: The 19th Central European Seminar on Computer Graphics.
Electronic document: http://www.vrvis.at/publications/pdfs/PB-VRVis-2015-014.pdf,
accessed 15 October 2015.
Unity, 2015. Unity: Create the games you love with unity. Electronic document:
http://unity3d.com/, accessed 15 October 2015)
Wilcock, J.D., 1975. Archaeological Context Sorting by Computer. In: Laflin, S. (Ed.),
Computer Applications in Archaeology 1975. Proceedings of the Annual Conference,