This is a repository copy of Size is everything: Explaining SIFI designations. White Rose Research Online URL for this paper:
http://eprints.whiterose.ac.uk/120779/ Version: Accepted Version
Article:
Irresberger, F, Bierth, C and Weiß, GNF (2017) Size is everything: Explaining SIFI designations. Review of Financial Economics, 32. pp. 7-19. ISSN 1058-3300 https://doi.org/10.1016/j.rfe.2016.09.003
© 2016 Elsevier Inc. This manuscript version is made available under the CC-BY-NC-ND 4.0 license http://creativecommons.org/licenses/by-nc-nd/4.0/
[email protected] https://eprints.whiterose.ac.uk/
Reuse
Items deposited in White Rose Research Online are protected by copyright, with all rights reserved unless indicated otherwise. They may be downloaded and/or printed for private study, or other acts as permitted by national copyright laws. The publisher or other rights holders may allow further reproduction and re-use of the full text version. This is indicated by the licence information on the White Rose Research Online record for the item.
Takedown
If you consider content in White Rose Research Online to be in breach of UK law, please notify us by
Size is everything: Explaining SIFI designations
Felix Irresberger
∗ TU Dortmund UniversityChristopher Bierth
† TU Dortmund UniversityGregor N.F. Weiß
‡ University of Leipzig21st September 2016
ABSTRACT
In this paper, we study the determinants of the systemic importance of banks and insurers
dur-ing the financial crisis. We investigate the methodology of regulators to identify global systemi-cally important financial institutions and find that firm size is the only significant predictor of the
decision of regulators to designate a financial institution as systemically important. Further,
us-ing a cross-sectional quantile regression approach, we find that Marginal Expected Shortfall and
ΔCoVaR as two common measures of systemic risk produce inconclusive results concerning the systemic relevance of banks and insurers during the crisis.
Keywords: Systemic risk, interconnectedness, systemic relevance, financial stability.
JEL Classification: G01, G20, G28.
∗Corresponding author: Otto-Hahn-Str. 6, D-44227 Dortmund, Germany, telephone:+49 231 755 8212, e-mail:[email protected].
†Otto-Hahn-Str. 6, D-44227 Dortmund, Germany, telephone:+49 231 755 8212, e-mail:
‡Grimmaische Str. 12, D-04107 Leipzig, Germany, telephone: +49 231 755 4608, e-mail:
1
Introduction
At the climax of the financial crisis of 2007-2009, American International Group (AIG)
be-came the first international insurer that required (and ultimately received) a bailout as regulators
considered AIG to be too systemically important to default. At the time, AIG’s near-collapse came
to the surprise of most analysts and financial economists as systemic risk was considered to be a
problem confined to banking, but not insurance. As a response to this wakeup-call, regulators have
recently started to realign the regulation of international insurance companies towards a
macropru-dential supervision. Most prominently, on July 18, 2013, the Financial Stability Board (FSB) in
collaboration with the International Association of Insurance Supervisors (IAIS) published a list
of nine Global Systemically Important Insurers (G-SIIs) which will ultimately face higher capital
and loss absorbency requirements. In essence, regulators deem insurers to be globally systemically
important in the views of regulators if they are of such size and global interconnectedness that their
default would trigger severe adverse effects on the financial sector. Previously, in November 2011,
the FSB had similarly identified a set of 29 banks as Global Systemically Important Financial
Insti-tutions (G-SIFIs). However, the validity of these classifications and the actual determinants of the
decision of regulators to designate a financial institution as global systemically important remain
relatively unknown.
Until the financial crisis, economists had never expected systemic risks to arise from the
insur-ance sector. In contrast to banking, insurinsur-ance companies are not vulnerable to runs by customers
and thus are not subject to sudden shortages in liquidity. Although theoretically, one could think of
runs on life insurance policies, there has not been a single example in history for such a run to take
place and cause systemwide defaults of insurers (see, e.g., Eling and Pankoke, 2014).1
Further-more, even the largest international insurers are significantly smaller in size, less interconnected,
and hold more capital (see Harrington, 2009) than the largest global banks. In light of this, the case
of AIG seems to have been a major exception to the rule that insurers do not cause systemic risks.
1 An “insurer run” is regarded as unlikely by most economists as customers are often protected by guarantees that
As insurers do not accept customer deposits, they do not face the risk of a sudden shortage in
liquidity due to a bank run. In addition, insurers in contrast to banks often rely more strongly on
long-term liabilities thus further decreasing their exposure to liquidity risk. Furthermore, insurers
are said to be less interconnected than banks resulting in a lower probability of contagion among
insurers (see Bell and Keller, 2009). Based on the experiences from the financial crisis, the IAIS
(2013) published a methodology for assessing the systemic risk of international insurers. In this
methodology, the key determinants of systemic risk in insurance are non-core and non-insurance
activities, insurer size and interconnectedness.2
However, the empirical evidence on the questions whether insurers can become systemically
relevant and whether these factors drive systemic risk is limited. Shortly after the financial
cri-sis, Acharya et al. (2009), Harrington (2009), and Cummins and Weiss (2014) discussed the role
of insurers during the financial crisis.3 More recently, due to the increased attention regulators
are giving this topic, several studies have analyzed different aspects of systemic risk in
insur-ance. For example, Cummins and Weiss (2014) and Weiß and M¨uhlnickel (2014) study the effect
of different factors from the IAIS methodology on the systemic risk of U.S. insurers. In addition,
M¨uhlnickel and Weiß (2015) support the too-big-to-fail conjecture for insurers by showing that
insurer mergers tend to increase the systemic risk of the acquiring insurers.
In this paper, we analyze the question whether common measures of systemic risk are
signif-icantly driven by the size, the interconnectedness, and the leverage of global banks and insurers.
As systemic risk measures, we employ the institutions’ Marginal Expected Shortfall (MES) (see
Acharya et al., 2010) and their∆CoVaR (see Adrian and Brunnermeier, 2014). We then perform
separate quantile regressions for both a sample of the world’s largest banks and insurers of these
two measures of systemic risk on size, interconnectedness, leverage, and a set of control variables.
2 The non-core activities listed by the IAIS include credit default swaps (CDS) transactions for non-hedging
pur-poses, leveraging assets to enhance investment returns, as well as products and activities that concern bank-type (or investment bank-type) activities. Furthermore, the IAIS argues that insurance companies which engage in non-traditional insurance activities are more affected to financial market developments and contribute more to systemic risk of the insurance sector.
3 Additional analyses of systemic risk in insurance are due to Eling and Schmeiser (2010); Lehmann and Hofmann
For both banks and insurers, the results of these quantile regressions are counterintuitive to the
current standpoint of regulators. The extreme quantiles of both MES and ∆CoVaR (i.e.,
institu-tions that are most exposed and contribute the most to systemic risk) are not significantly affected
by size. Higher leverage and interconnectedness are only weakly significantly related to systemic
risk and seem to decrease the systemic relevance of financial institutions. We then turn to probit
regressions of the probability of membership in the groups of G-SIFIs and G-SIIs. Our results are
extremely revealing: the decision of regulators to declare a financial institution (bank or insurer)
as systemically relevant is only driven by the institution’s size.
The rest of this paper is structured as follows. Related literature is presented in Section 2. The
data and variables used in our empirical study are discussed in Section 3. The outline and the
results of our analysis are given in Section 4. Section 5 concludes.
2
Related literature
The case of systemic risk in the banking sector has been discussed extensively in the recent
literature. However, the question whether insurers can actually become systemically relevant for
the financial system and the question whether the IAIS’s proposed methodology is suitable for
identifying G-SIIs remain relatively unanswered in the literature so far. Only few studies focus on
the exposure and contribution of insurers to systemic risk and the key determinants that could cause
severe consequences for insurers. Reviewing the academic literature, Trichet (2005) argued that
the traditional insurance business is not vulnerable to “insurance runs” and that interconnectedness
in the insurance sector is weak in contrast to the banking sector. After the financial crisis this view
changed significantly. For example, Baluch et al. (2011) conclude that systemic risks exist in the
insurance sector even though they are smaller than in banking. More importantly, systemic risk in
insurance appears to have grown partially as a consequence of the increasing interconnectedness
of insurers to other financial institutions and their activities outside of the traditional insurance
writing credit derivatives, can cause contagion in the financial sector. A warning that came almost
three years before the near-collapse of AIG.
In the empirical literature, several studies have focused on the the interconnectedness of
in-surers as a primary driver of systemc risk. Billio et al. (2012) analyze the interconnectedness of
global financial institutions based on their stock prices. They argue that illiquid assets of insurers
could create systemic risks in times of financial crisis. In a related study, Chen et al. (2014) analyze
the interconnectedness of banks and insurers but find in their analysis of credit default swap and
intraday stock price data that the insurance sector is exposed to but does not contribute to systemic
risks in the banking sector.
While the former two studies only address the interconnectedness of banks and insurers, the
effect of additional factor like size, leverage, and profitability on systemic risk in the insurance
sector is studied by Weiß and M¨uhlnickel (2014).4 Most importantly, they find that insurer size
has been a major driver of the systemic risk exposure and contribution of U.S. insurers. Several of
the IAIS indicators (e.g., geographical diversification), however, do not appear to be significantly
related to the systemic risk of insurers. The hypotheses behind these suspected causal relations
are similar to arguments brought forward in banking. Insurer size, for example, could have an
increasing effect on systemic risk in the insurance sector, because larger insurance companies have
a wider range of different risks covered and thus are less prone to suffer from cumulative losses (see
Hagendorffet al., 2014). Yet, larger insurance companies could become too-interconnected-to-fail
and thus systemically relevant (see Acharya et al., 2009).
Additionally, the IAIS has also argued that high leverage could increase the systemic
impor-tance of individual insurers (especially in combination with size and interconnectedness). High
leverage incentivizes managers into excessive risk-taking to increase a firm’s profitability (see,
e.g., Acharya et al., 2010; Fahlenbrach et al., 2012). However, leverage is obviously not bad per
se. For example Vallascas and Hagendorff (2011) stress the disciplining function of leverage as
it pressures managers into securing the payments of interest to investors and to secure a firm’s
4 In a related study, Cummins and Weiss (2014) also analyze the characteristics of U.S. insurers that are
liquidity. In addition, insurers that engage too heavily in non-core activities such as derivatives
trading could also single-handedly destabilize the financial sector. For example, one of these
non-traditional activities identified by the IAIS is the use of catastrophe bonds to hedge against severe
losses induced by natural catastrophes. The assumption that these hedging vehicle could make
insurers more interconnected with financial markets and thus more systemically relevant is
con-futed in Weiß et al. (2013). Concerning derivatives trading, Cummins and Weiss (2014) note that
excessive derivatives trading by insurers was a major source of systemic risk in insurance during
the financial crisis.
Probably the most fundamental question, however, remains whether systemic risk in insurance
companies (if it even exists) is large enough to destabilize the whole financial sector. In this
respect, Bierth et al. (2015) find systemic risk in the international insurance sector to be small
in comparison to previous findings in the literature for banks. However, confirming the results
of Baluch et al. (2011), they find a strong upward trend in both the exposure and contribution of
insurers to the fragility of the global financial sector during the financial crisis. In further panel
regressions, they find the interconnectedness of large insurers with the financial sector to be a
significant driver of the insurers’ exposure to systemic risk. In contrast, the contribution of insurers
to systemic risk appears to be primarily driven by the insurers’ size and leverage.
3
Data
This section describes the construction of our sample of banks and insurers and presents the
choice of our dependent and main independent variables as well as descriptive statistics of our
data.
3.1
Sample construction
Balance sheet and income statement data are retrieved from the Thomson Worldscope database
as a result from currency risk. To construct our sample, we select all publicly listed international
insurers from the dead and active firm list in Thomson Reuters Financial Datastream and omit
all firms for which stock price data are unavailable in Datastream. We exclude Berkshire
Hath-away due to its unusual high stock price, although it is listed as an insurer in Datastream. For
our analysis we restrict our dataset to the one hundred largest insurance companies, measured by
their total assets at the end of the fiscal year 2006. A similar procedure is used for the construction
of our international sample of banks. Initially, we start with a sample of all firms in the active
and dead-firm “banks” and “financial services” lists in Thomson Reuters Financial Datastream. 5
As in Fahlenbrach and Stulz (2011), we then select all companies with SIC codes between 6000
and 6300 (i.e., we eliminate insurers, real estate operators, holding and investment offices as well
as other non-bank companies in the financial service industry from our sample of banks). It is
crucial for our analysis that we have accounting price and stock price data available in Thomson
Worldscope and Datastream. Therefore, we therefore exclude firms for which these data are not
available. We exclude a stock from our sample if it is identified in Datastream as a non-primary
quote or if it is an American Depositary Receipt (ADR). All OTC traded stocks and preference
shares are also removed. Similar to the insurer sample, we restrict our data set to the 150 largest
banks, measured by their total assets at the end of the fiscal year 2006. Due to secondary listings,
we have to remove another two banks and two insurers from the samples. The geographical
dis-tribution of our sample banks and insurers covers 36 countries with most banks (25 out of 148)
and insurers (27 out of 98) being from the United States. Following the U.S., the four most
promi-nent countries in our samples are China (10 banks/2 insurers), Japan (16/6), the United Kingdom
(11/8), and Germany (8/11). The geographical spread of our sample firms is shown in Table I.6
For increased transparency, the names of the 98 insurers and 148 banks in our final sample can be
found in Appendix A.1 and A.2.
[Insert Table I about here.]
5 Since we cannot rule out that some banks are erroneously listed in the “financial services” instead of the “banks”
category in Datastream, we use both lists to generate our final sample.
Next, we define and discuss the main dependent and independent variables for our analysis
in the subsequent sections. Appendix A.1 gives an overview of all variable definitions and data
sources used in our empirical study. To minimize the possibly biasing effect of extreme outliers in
our sample on our results, all data are winsorized at the 1% and 99% levels.
3.2
Systemic risk measures
This study employs two different measures of systemic risk that proxy for an institution’s
sensitivity or exposure and contribution to systemic risk in a larger financial system. Systemic
risk is calculated for the crisis period which we define as the period between July 2007 and the
end of december 2008 (see Fahlenbrach et al., 2012). Similar to the recent literature (see, e.g.,
Anginer and Demirg¨uc¸-Kunt, 2014; Anginer et al., 2014; Weiß and M¨uhlnickel, 2014), we use as
our measures of systemic risk the unconditional∆CoVaR as defined by Adrian and Brunnermeier
(2014) and the Marginal Expected Shortfall as defined by Acharya et al. (2010).
One of the more established measures of systemic risk that is also used by regulators is the
unconditional∆CoVaR measured as the difference of the Value-at-risk (VaR) of a financial sector
index7conditional on the distress of a particular insurer and the VaR of the sector index conditional
on the median state of the insurer. Therefore,∆CoVaR can be interpreted as the actual contribution
to systemic risk in the financial system by the respective observed company.
In contrast, the Marginal Expected Shortfall is defined as the negative average return on a firm’s
stock on the days an index (in our case the MSCI World index) experienced its 5% worst outcomes.
8 A positive MES thus indicates a positive exposure to systemic risk rather than a stabilizing effect.
7 In our main analysis, we employ the MSCI World Index. For further robustness checks, we also employ the the
World DS Full Line Insurer Index, the MSCI World Banks Index, and the MSCI World Insurance index for the calculation of∆CoVaR and Marginal Expected Shortfall.
8 Additionally, we employ the Dynamic Marginal Expected Shortfall calculated following the procedure laid out
3.3
Explanatory variables
The focus of our analyses is to shed more light on the interplay of systemic risk and possible
determining factors proposed by the Financial Stability Board and the IAIS (2013). Thus, we
concentrate on size, leverage, and the interconnectedness of banks and insurers. We intend to show
whether these factors can explain the decisions of regulators to propose global systemic relevance
for some of the banks and insurers in the financial system. Furthermore, we compare the predictive
power of these factors for explaining the cross-sectional variation in both the institutions’ MES and
∆CoVaR.
As a standard proxy for size we employ the natural logarithm of an institution’s total assets at
the end of the fiscal year 2006. The effect of size on systemic risk could be ambiguous. On the
one hand, if a bank or insurer is deemed “too-big-to-fail”, and hence might receive subsidies from
safety net policies in a situation of undercapitalization, this could incentivize managers to take
more risks than socially optimal. Consequently, large banks or insurers are more likely to
con-tribute significantly more to systemic risk than smaller institutions (see, e.g., O’Hara and Shaw,
1990; Acharya and Yorulmazer, 2008; Anginer et al., 2014). Additionally, Gandhi and Lustig
(2015) find that, in contrast to non-financial firms, size is a priced factor in the cross-section of
bank stock return. According to their study this is due to the pricing of implicit bailout guarantees
by stock market investors. On the other hand, a larger firm generally has more opportunities to
di-versify and thus hedge against times of financial turmoil, which could decrease the firm’s systemic
risk.
As the next main variable of interest, we measure a firm’s leverage as the book value of assets
minus the book value of equity plus the market value of equity, divided by the market value of
eq-uity (see Acharya et al., 2010). High leverage is a factor that incentivizes managers into excessive
risk-taking to increase a firm’s profitability.9 In contrast, managers could be disciplined by higher
leverage since they could feel more pressured to provide enough liquid assets to cover interest
pay-9 Support for this view is found by Acharya et al. (2010), Fahlenbrach et al. (2012) and Hovakimian et al. (2012)
ments (see, e.g., Vallascas and Hagendorff, 2011). This could in turn decrease a bank’s or insurer’s
total risk. We therefore include leverage as a main independent variable in our regressions with no
prediction for the sign of the coefficient.
The third important factor entering our analyses is the interconnectedness of banks and insurers
within the financial system. Since we do not have information on, e.g., interbank lending markets,
we make use of the measure of interconnectedness of a financial institution proposed by Billio et al.
(2012) based on standardized stock returns of individual banks and insurers.
Billio et al. (2012) propose an univariate measure PCAS of an institution’s interconnectedness
with the system (using all types of financial institutions) which is based on a principal
compo-nent analysis of the correlations between all institutions’ stocks. The measure then computes the
contribution of an individual institution to the overall risk of the financial system. The more
inter-connected an insurer or bank is with the rest of the financial sector, the higher its systemic relevance
will be. We therefore suspect PCAS to enter our regressions with a significant increasing effect on
systemic risk (see Arnold et al., 2012; Black et al., 2013; IAIS, 2013). An interconnected financial
institution will be more exposed to shocks within the system. However, being more intertwined
with the system does not automatically translate into a higher contribution to the systemic risk
itself. Furthermore, similar to the too-big-to-fail argument, the too-interconnected-to-fail
hypoth-esis (see Arnold et al., 2012; Black et al., 2013; IAIS, 2013) states that institutions that are
too-interconnected-to-fail are guaranteed a safety net by governments to fall back on. Consequently,
our expectations for the impact of the interconnectedness variable are unrestricted.
In addition to our three main independent variables that cover the most important (presumed)
driving factors of systemic relevance, we include in our regressions several firm-specific
charac-teristics that have shown to be significant drivers of performance and systemic risk of banks and
insurers in the recent literature. An overview of all the variable definitions, data sources and our
hypotheses regarding the analyses is given in Appendix A.1.
We include a firm’s annual buy-and-hold stock returns in 2006, since institutions that took on
2012) and increase their exposure and contribution to systemic risk. Next, we include standard
proxys for a firm’s valuation (market-to-book ratio) and its profitability (return on assets) and
expect them to decrease a bank’s and insurer’s systemic risk. The literature suggests that banks and
insurers that relied heavily on short-term funding were exposed to liquidity risks during the recent
financial crisis and increased their overall systemic risk (see Brunnermeier and Pedersen, 2009;
Cummins and Weiss, 2014; Fahlenbrach et al., 2012). Consequently, we control for the degree to
which an insurer or bank relied on long-term debt before the crisis (debt maturity).
Turning to the variables specifically related to the insurance business, we control for the
suc-cess of an insurer’s asset management (investment sucsuc-cess) and whether the form of generated
income (fixed income) influences systemic risk. If an insurance companies relies more on asset
management rather than underwriting it could be more intertwined with the global financial
mar-kets and could thus contribute and be more exposed to global systemic risk. To check for other
possible non-core activities we also include the variables non-policyholder liabilities and other
in-come. Additional risk could arise in the form of poor management of the company which could
also manifest itself in the quality of the insurance portfolio. We therefore include the variables loss
ratio and operating expenses. Regarding our sample of banks, we use the composition of the bank’s
liabilities (deposits) to control whether banks with more deposit financing are in fact more stable.
Next, we include the natural logarithm of expenses set aside as an allowance for uncollectable
or troubled loans (loan loss provisions) to proxy for a bank’s credit risk. A larger buffer against
troubled loans should serve as a stabilizing factor for a bank’s systemic risk. Also, we control for
the loans-to-assets ratio (loans) of a bank, since it could indicate a business model that focuses on
lending rather than more risky activities, which reduces systemic risk. With a similar reasoning, we
include the ratio of non-interest income to total interest income (non-interest income) as a variable
in our analysis. A bank relying more on non-deposit taking activities like, e.g., investment banking,
could also be riskier than banks with a focus on traditional lending (see, e.g., Brunnermeier et al.,
2012). Finally, we employ a bank’s Tier-1-capital ratio (tier-1-capital) to check whether higher
financial sector.
3.4
Descriptive statistics
Table II shows summary statistics for our two dependent variables for the time period July
2007 to the end of 2008 (crisis period) and for our three main explanatory variables of interest:
total assets, leverage, and interconnectedness in the year 2006.10
[Place Table II about here.]
The summary statistics for the banks in our sample are given in Panel A and for the insurers
in Panel B of Table II. First, we notice that the means of the variables of the banking sector differ
substantially from the insurance sector. The average MES is higher for insurers than for banks
while the opposite is true for∆CoVaR. One explanation for this finding could be the fact that both
measures are purely based on stock market data. As insurers will most likely have a higher
sensi-tivity of their asset side to downturns in equity markets, so will their own equity. Consequently, the
higher estimates for MES of insurers could be indicative of a) a higher overall (average) systemic
importance of insurers or b) a higher sensitivity of their equity to market crashes (which in part
could also indicate a higher systemic risk). Conversely, the sheer size of the asset management
activities of the larger insurance companies and crisis-related shifts in their asset portfolios could
also explain the lower average∆CoVaR in our sample.
Insurers have a mean of total assets of $ 158 billion while banks are significantly larger with
a mean of total assets of $ 350 billion. Furthermore, the leverage of banks is on average 13.430
whereas the insurers have a mean leverage of 9.285, which underlines the increased leverage in
banking compared to other industries. As expected, on average, banks had significantly higher
total assets, leverage and were more interconnected than insurers. Additionally, we find only little
evidence of strong interconnectedness of the insurers in our sample compared to the bank sample.
Based on the univariate analysis, we hypothesize that size and leverage are the driving systemic
10 Note that the sample size is slightly reduced by the unavailability of some balance sheet items for smaller banks
risk while interconnectedness does not play such an important role for explaining differences in
MES and∆CoVaR.
4
The determinants of systemic relevance
This section investigates which (possibly differential) factors determine the systemic relevance
of banks and insurers. We first present the results of our cross-sectional OLS and quantile
regres-sions of the institutions’ MES and∆CoVaR during the crisis. Afterwards, we report and comment
on the results of our probit regressions for the determination of factors that influence systemic
relevance as stated by regulators.
4.1
Cross-sectional regressions
Instead of only using the standard OLS approach for cross-sectional regressions, we perform
the multivariate analysis of the determinants of extreme values of MES and∆CoVaR in two ways.
In particular, we employ cross-sectional quantile regressions with bootstrapped standard errors11
and simple OLS regressions with robust standard errors of our systemic risk proxies during the
cri-sis on our (lagged) main independent and the various control variables in 2006. The use of quantile
regressions benefits us with reasonable benefits compared to OLS regressions. OLS models the
re-lationship between the conditional mean of the dependent variable and the independent variables.
We do not include all active Banks and insurance companies with available data in Datastream
because the values of our systemic risk measures (or the dummy variables for our probit
regres-sions) would be distorted by the inclusion of too many firms in a mechanical way. The quantile
regression approach by Koenker and Basset (1978) circumvents the problems that arise in OLS
due to heteroskedasticity in the data by estimating the change in a specified quantile of the
de-pendent variable given the covariates produced by the indede-pendent variables. Quantile regression
models the quantiles of the dependent variable’s distribution and therefore does not suffer from the
11 By using bootstrapped standard errors, we are able to partially obviate possible biases by the non-i.i.d. character
usual heteroskedasticity problem. For the MES, we analyze the 95%-percentile and for∆CoVaR
we analyze in the 5%-percentile, with both indicating extreme systemic risk. The results of our
cross-sectional analysis for banks are shown in Table IV and III.
[Insert Tables III and IV about here.]
The first three regressions in all settings are concerned with the individual effects of our three
main dependent variables: size, leverage, interconnectedness with the financial system, as well as
systemic risk.
In the OLS regressions of banks we find no significant effect of the variables total assets and
leverage on our systemic risk measures except for a strong significance at the 1% level of
inter-connectedness on∆CoVaR. Surprisingly, the variable enters the quantile regression with a positive
coefficient and thus increases the value of∆CoVaR (i.e., decreases the systemic risk contribution
of the bank). We interpret this result as an indication that the market-based measure of
intercon-nectedness that we use may be an imperfect proxy for a bank’s interconintercon-nectedness. For example,
it could be that our proxy does not adequately capture the risk concentration in the banking sector
caused by banks’ purchasing and holding similar assets like, e.g., mortgage-backed securities. By
adding our control variables, we only lose some of the significance of the coefficient of
intercon-nectedness and find no statistically significant influence of any other variable on∆CoVaR. Looking
at the respective quantile regressions on the 5%-quantile of∆CoVaR reveals that only bank size is
a slightly statistically significant predictor of extreme contribution of banks to systemic risk. The
variable enters the quantile regression with a positive sign of the coefficient at a 10% level, which
indicates the counterintuitive impression that larger banks contribute less to systemic risk. Again,
this result points at the possibility that both our proxies for size and interconnectedness do not fully
capture the main drivers of a bank’s systemic risk.
The OLS regressions of MES on our main variables of interest show that only the
intercon-nectedness influenced the exposure of banks to external shocks during the crisis. The coefficient
of interconnectedness enters both the OLS and the quantile regression with a negative sign that is
regression of the 95%-quantile. Thus, we find the result that being more interconnected does not
necessarily increase the exposure of banks to systemic risk. Interestingly, we note a slightly
signif-icant decreasing effect of the variable deposits on MES which leaves us with the interpretation that
banks with higher deposit financing were more stable and less sensitive to external shocks during
the financial crisis.
The regressions of banks’ systemic risk on the indicators of systemic relevance reveal that only
the interconnectedness of banks with the financial sector helps in explaining the magnitude of the
contribution or exposure to systemic risk. In Tables V and VI, we show the results from the OLS
and quantile regressions of ∆CoVaR and MES on the proposed factors of systemic relevance for
insurers.
[Insert Tables V and VI about here.]
Table V shows that an insurer’s size decreases∆CoVaR (significant at the 10% level) and thus,
indicates a higher contribution to systemic risk by larger insurers. This significance, however,
vanishes when including other control variables and is also never significant when regressing the
conditional quantile of systemic risk. A very similar pattern can be found in Table VI concerning
insurer size, where total assets to increase the exposure to systemic risk. On the other hand, we
find that a higher leverage induces a lower systemic risk contribution. For the interconnectedness
variable, we find the same effects on systemic risk as in the models involving our sample of banks,
although with statistically less significant results.
Turning to the quantile regressions for our insurer sample, we notice that interconnectedness
exhibits a strong influence on systemic risk. Although the actual values of interconnectedness of
insurers are much lower than those for the sample of banks, we notice that being interconnected
with the financial system as an insurer has a much stronger impact on the systemic risk of the
insurer than for banks. The coefficients in the quantile regressions are positive for∆CoVaR and
negative for MES which indicates a decrease in the contribution and the exposure to systemic risk.
This holds true at the 1% level. Again, this counterintuitive result could be due to our proxies
Alternatively, it could be that our market-based proxy of interconnectedness does not pick up all
causes of interbank linkages (e.g., due to ubiquitously held risky securities). Additionally, we find
that profitability and higher loss ratios also have a decreasing effect on the contribution to systemic
risk. Throughout all of the regressions neither size nor leverage consistently enter the analysis with
a significant coefficient. Consequently, a simple analysis of MES and∆CoVaR could lead to the
conclusion that both size and leverage are not significant drivers of systemic risk in banking and
insurance.
As mentioned earlier, the set of explanatory variables that we use in our regressions is strongly
motivated by arguments of regulators that size, leverage, and interconnectedness are the main
drivers of systemic risk. The weak explanatory power of these variables, together with the fact
that the variables often have a counterintuitive effect on systemic risk, are indicative of a possible
omitted variable bias in both our analysis as well as in the logic of regulators. As seen during the
financial crisis, a major driver of systemic risk in the financial sector was the common practice
of institutions to invest in asset- and mortgage-backed securities that caused a dangerous
concen-tration of risk despite these instruments’ top ratings. However, our analysis suggests that these
potential drivers of systemic risk are neither reflected in size nor our market-based proxy for an
institution’s interconnectedness.
4.2
Probit regressions
In this section, we explain the probability of being declared a global systemically important
bank or insurer by regulators. Employing a probit regression model allows us to explain the
proba-bility that a bank or an insurer will be declared systemically relevant or not. To this end, we employ
the same set of explanatory variables as before in our quantile regressions.
The results of the probit regressions for the 148 largest banks, measured by their total assets in
2006, are presented in Table VII.
Table VII shows the results of several probit regressions on dummy variables that take on the
value of one if a bank was declared global systemically important by the Financial Stability Board
and zero otherwise.
Starting with probit regressions (1) to (3) of systemic relevance of banks, we can see that
neither the banks’ leverage nor their interconnectedness are significant indicators of an institution’s
systemic importance. This first finding is in striking contrast to the hypotheses formulated by
the Financial Stability Board on the pivotal role of leverage and interconnectedness for a bank’s
systemic relevance. It is, however, in line with the notion that risk concentrations in financial
institutions’ assets as seen during the financial crisis rather than leverage or interconnectedness
alone could be responsible for systemic crises. Interestingly, our results in regression (4) imply that
the banks’ Marginal Expected Shortfalls has a significant influence on the global importance of a
bank as perceived by regulators (from model (5) we see that∆CoVaR is not statistically significant).
In model specifications (6) and (7), we include several control variables in our regressions but only
find size to be a driving factor for systemic importance. More precisely, the MES of the banks
which previously entered the regression with a significant positive coefficient now loses all its
statistical significance. Consequently, we find strong evidence that the nomination as a G-SIFI is
only driven by the institution’s size. As such, regulators appear to have based their decision to
declare an institution as systemically relevant solely on the notion of a bank being too-big-to-fail.
The probit regression results for the sample of insurers are shown in Table VIII.
[Place Table VIII about here]
Similar to the results for the banks, we can see from the probit regressions (1) to (5) that neither
the insurers’ leverage nor their interconnectedness are significant indicators of the nomination as a
G-SII by the FSB and the IAIS. These findings are also in striking contrast to the hypotheses of the
pivotal role of leverage and interconnectedness for an insurer’s systemic importance. In regression
(5) we find an insurer’s∆CoVaR to be a significant determinant of the probability to be included
in the list of G-SIIs. However, this effect vanishes as soon as we add total assets and other controls
size is the only reliable predictor of systemic relevance according to regulators. This holds true
even when we include various control variables.
In summary, the results of our probit regression analyses show that the inclusion of an
institu-tion in the list of G-SIFIs or G-SIIs is only a quesinstitu-tion of size. While MES and∆CoVaR do appear
to capture some of aspects of systemic risk, these measures cannot explain the methodology
pro-posed by regulators. They determine the systemic importance of a financial institution (regardless
whether it is a bank or insurer) only by the institutions’ size.
4.3
Robustness checks
To underline the validity of our results, we perform additional robustness checks. First, our
results could be biased by the manner in which we calculate the systemic risk measures∆CoVaR
and Marginal Expected Shortfall. Reestimating the measures using the MSCI World Banks
In-dex and MSCI World Insurance InIn-dex does not significantly change our main results. For our
cross-sectional analysis, we reestimate the OLS and quantile regression models with alternative
definitions of our key variables leverage (ratio of total liabilities to total assets) and size (natural
logarithm of net revenues). Except for the OLS regression for banks of MES on control variables,
where we find a statistical significance of leverage at the 10% level, our main inferences are robust
to these changes. Also, to control for an insurer’s line of business, we include a dummy variable
in our cross-sectional analyses that is one if the company is a life insurer (SIC code 6311), and
zero otherwise. Including this variable neither changes our main inferences, nor do we find it to
be significant in most of the regressions. However, in the regression of an insurer’s∆CoVaR on
the control variables, we find a positive relation of the life insurer dummy and ∆CoVaR that is
significant at the 10% level indicating that life insurers in our sample have a lower contribution to
systemic risk than non-life insurers. Finally, we reestimate our probit regressions for banks and
insurers using data from later years, i.e., 2009 and 2010 (if available) as it could be argued that
reg-ulators identified systemically relevant financial institutions based on post-crisis data rather than
5
Conclusion
In this paper, we study the determinants of the systemic importance of the world’s largest banks
and insurers during the financial crisis. Using a sample of the largest 148 banks and 98 insurers
in the world, we analyze the cross-sectional variation in two popular measures of systemic risk
of financial institutions during the crisis. In the second step of our analysis, we try to explain
the decision of regulators to include certain banks and insurers in the lists of global systemically
important financial institutions and global systemically important insurers.
Our results show that our quantile regressions of banks’ and insurers’ MES and ∆CoVaR as
our systemic risk proxies mainly produce counterintuitive results. We find little to no evidence
that higher leverage and interconnectedness increase the exposure or contribution of individual
institutions to systemic risk. However, both measures are based purely on balance-sheet and stock
market data and thus could be missing other drivers of systemic risk. For example, the standard
proxy for a financial institution’s interconnectedness might not capture the risk concentrations
caused by risky securitized assets at banks as seen during the financial crisis.
As our second main finding, we show that regulators only seem to care about an institution’s
size proxied by its total assets in their decision to declare the institution global systemically
im-portant. We find some correlation between the probability of being a G-SIFI and G-SII, and the
institution’s MES (banks) and∆CoVaR (insurers). Nevertheless these proxies of systemic risk
can-not explain the classification by regulators as soon as size is included in our probit regressions. We
thus conclude that despite the methodologies published by regulators themselves, the decision to
include a bank in the G-SIFI list was purely a question of bank size. Global systemically important
Acknowledgements
We thank Etti Baranoff, Thomas Berry-St¨olzle, Elia Berdin, Enrico Biffis, David Cummins, Daniel
Ferreira, Helmut Gr¨undl, Tarun Mukherjee (the co-editor), Loriana Pelizzon, Mary Weiss, and an
anonymous referee for comments on ealier versions of this paper. Judith Lameyer, Anne-Christine
Schmidt, and Sara Schmidt provided outstanding research assistance. Financial support from the
Table A.1: Sample insurers.
The table shows the names of the 98 international insurers used in our study. Insurers were selected by their respective total assets at the end of the fiscal year 2006 and availability of stock price data from Datastream.
ACE LIMITED LOEWS CORPORATION
AEGON N.V. MANULIFE FINANCIAL CORPORATION
AFLAC INCORPORATED MAPFRE SA
AGEAS SA MARSH & MCLENNAN COMPANIES, INC. AIOI INSURANCE COMPANY LIMITED MBIA INC.
ALLEANZA ASSICURAZIONI S.P.A. MEDIOLANUM S.P.A ALLIANZ LEBENSVERSICHERUNG-AG METLIFE, INC.
ALLIANZ SE MS & AD INSURANCE GROUP HOLDINGS, INCORPORATED ALLSTATE CORPORATION (THE) MUENCHENER RUCKVERSICHERUNGS-GESELLSCHAFT AG AMBAC FINANCIAL GROUP, INC. NATIONWIDE FINANCIAL SERVICES INC
AMERICAN FINANCIAL GROUP, INC. NIPPONKOA INSURANCE COMPANY LIMITED AMERICAN INTERNATIONAL GROUP, INC. NUERNBERGER BETEILIGUNGS-AG
AMERICAN NATIONAL INSURANCE COMPANY OLD MUTUAL PLC
AMP LIMITED PERMANENT TSB GROUP HOLDINGS PLC
AON PLC PHOENIX COMPANIES INC
ASSICURAZIONI GENERALI SPA PING AN INSURANCE (GROUP) COMPANY OF CHINA LTD ASSURANCES GENERALES DE FRANCE (AGF) SA POWER CORPORATION OF CANADA
ASSURANT, INC. POWER FINANCIAL CORP
AVIVA PLC PREMAFIN FINANZIARIA SPA
AXA ASIA PACIFIC HOLDINGS LIMITED PRINCIPAL FINANCIAL GROUP, INCORPORATED AXA KONZERN AG PROGRESSIVE CORPORATION (THE)
AXA LEBENSVERSICHERUNG AG PROTECTIVE LIFE CORPORATION
AXA SA PRUCO LIFE INSURANCE COMPANY
BALOISE HOLDING AG PRUDENTIAL FINANCIAL, INCORPORATED CATHAY FINANCIAL HOLDING COMPANY LIMITED PRUDENTIAL PLC
CATTOLICA ASSICURAZIONI S.C.A.R.L. QBE INSURANCE GROUP LIMITED CHALLENGER FINANCIAL SERVICES GROUP LTD REINSURANCE GROUP OF AMERICA, INC. CHINA LIFE INSURANCE CO LTD RSA INSURANCE GROUP PLC
CHUBB CORPORATION (THE) SAMPO OYJ CNA FINANCIAL CORPORATION SANLAM LIMITED CNO FINANCIAL GROUP, INCORPORATION SCOR SE
CNP ASSURANCES SHIN KONG FINANCIAL HOLDING COMPANY LIMITED DBV-WINTERTHUR HOLDING AG SOMPO JAPAN INSURANCE INC
ERGO VERSICHERUNGSGRUPPE AG ST. JAMES’S PLACE PLC FAIRFAX FINANCIAL HOLDINGS LIMITED STOREBRAND ASA
FUBON FINANCIAL HOLDING COMPANY LIMITED SUN LIFE FINANCIAL INCORPORATED GENERALI DEUTSCHLAND HOLDING AG SWISS LIFE HOLDING AG
GENWORTH FINANCIAL, INC. SWISS RE LTD
GREAT EASTERN HOLDINGS LTD TOKIO MARINE HOLDINGS INCORPORATED GREAT-WEST LIFECO INC TRAVELERS COMPANIES, INC. (THE) HANNOVER RUECK SE UNIPOL GRUPPO FINANZIARIO SPA HARTFORD FINANCIAL SERVICES GROUP, INC. (THE) UNIPOLSAI ASSICURAZIONI SPA HELVETIA HOLDING AG UNIQA INSURANCE GROUP AG INDUSTRIAL ALLIANCE INSURANCE AND FINANCIAL
SER-VICES INCORPORATED
UNUM GROUP
ING GROEP N.V. VIENNA INSURANCE GROUP
LEGAL & GENERAL GROUP PLC WHITE MOUNTAINS INSURANCE GROUP LTD LIBERTY GROUP LIMITED WURTTEMBERGISCHE LEBENSVERSICHERUNG AG LIBERTY HOLDINGS LIMITED XL GROUP PLC
Table A.2: Sample banks.
The table shows the names of the 148 international banks used in our study. Banks were selected by their respective total assets at the end of the fiscal year 2006 and availability of stock price data from Datastream.
ABN AMRO HOLDING N.V. DANSKE BANK AS
ALLIANCE & LEICESTER PLC DBS GROUP HOLDINGS LTD ALLIED IRISH BANKS PLC DEPFA BANK PLC
ALPHA BANK SA DEUTSCHE BANK AKTIENGESELLSCHAFT AMERIPRISE FINANCIAL, INC. DEUTSCHE BOERSE AG
ANGLO IRISH BANK CORPORATION PLC DEUTSCHE POSTBANK AG AUSTRALIA AND NEW ZEALAND BANKING GROUP LIMITED DEXIA SA
BANCO BILBAO VIZCAYA ARGENTARIA SA DNB ASA
BANCO COMERCIAL PORTUGUES, S.A. ECOBANK NIGERIA PLC BANCO DO BRASIL SA ERSTE GROUP BANK AG
BANCO ESPANOL DE CREDITO, S.A. ESPIRITO SANTO FINANCIAL GROUP S.A. BANCO ESPIRITO SANTO SA EUROBANK ERGASIAS SA
BANCO POPOLARE FIFTH THIRD BANCORP
BANCO POPULAR ESPANOL FIRSTRAND LIMITED BANCO SABADELL GOLDMAN SACHS GROUP INC BANCO SANTANDER SA HANA FINANCIAL GROUP BANK AUSTRIA CREDITANSTALT AG HANG SENG BANK LIMITED
BANK HAPOALIM B.M. HBOS PLC
BANK LEUMI LE-ISRAEL B.M. HSBC HOLDINGS PLC
BANK OF AMERICA CORPORATION HUA XIA BANK COMPANY LTD BANK OF CHINA LIMITED HYPO REAL ESTATE HOLDING BANK OF COMMUNICATIONS CO LTD HYPOTHEKENBANK FRANKFURT AG
BANK OF IRELAND ICAP PLC
BANK OF MONTREAL ICICI BANK LIMITED
BANK OF NEW YORK MELLON CORP. INDUSTRIAL AND COMMERCIAL BANK OF CHINA LTD BANK OF NOVA SCOTIA (THE) INDUSTRIAL BANK CO LTD
BANK OF YOKOHAMA LIMITED (THE) INDUSTRIAL BANK OF KOREA BANQUE NATIONALE DE BELGIQUE INTESA SANPAOLO SPA
BARCLAYS AFRICA GROUP LTD JAPAN SECURITIES FINANCE CO LTD BARCLAYS PLC JOYO BANK LIMITED (THE)
BAYERISCHE HYPO- UND VEREINSBANK AG JPMORGAN CHASE & CO. BB & T CORPORATION KAUPTHING BANK HF
BNP PARIBAS SA KB FINANCIAL GROUP INCORPORATION BRADFORD & BINGLEY PLC KBC GROUP NV
CANADIAN IMPERIAL BANK OF COMMERCE KEYCORP
CAPITAL ONE FINANCIAL CORPORATION KOREA EXCHANGE BANK
CAPITALIA SPA LANDESBANK BERLIN HOLDING AG CHIBA BANK LTD (THE) LLOYDS BANKING GROUP PLC CHINA CITIC BANK CORPORATION LIMITED M & T BANK CORPORATION CHINA CONSTRUCTION BANK CORP MACQUARIE GROUP LIMITED CHINA MERCHANTS BANK CO LTD MALAYAN BANKING BERHAD CHINA MINSHENG BANKING CORPORATION LIMITED MARSHALL & ILSLEY CORPORATION
CITIGROUP INC. MEGA FINANCIAL HOLDING COMPANY LIMITED COMERICA INCORPORATED MITSUBISHI UFJ FINANCIAL GROUP INCORPORATED COMMERZBANK AKTIENGESELLSCHAFT MIZUHO FINANCIAL GROUP INC
CREDIT AGRICOLE SA MORGAN STANLEY
CREDIT INDUSTRIEL ET COMMERCIAL SA NATIONAL AUSTRALIA BANK LIMITED CREDIT SUISSE GROUP AG NATIONAL BANK OF CANADA
Table A.2: Sample banks (continued).
NATIONAL CITY CORPORATION NATIXIS
NIKKO CORDIAL CORPORATION
NISHI-NIPPON CITY BANK LIMITED (THE) NOMURA HOLDINGS INCORPORATED NORDEA BANK AB
NORTHERN ROCK PLC
NORTHERN TRUST CORPORATION OSTERREICHISCHE VOLKSBANKEN - AG
OVERSEA-CHINESE BANKING CORPORATION LIMITED PNC FINANCIAL SERVICES GROUP INCORPORATED RAIFFEISEN BANK INTERNATIONAL AG
REGIONS FINANCIAL CORPORATION RESONA HOLDINGS INC
ROYAL BANK OF CANADA
ROYAL BANK OF SCOTLAND GROUP PLC (THE) SAN PAOLO IMI SPA
SBERBANK ROSSII OAO
SCHWEIZERISCHE NATIONALBANK SHANGHAI PUDONG DEVELOPMENT BANK SHINHAN FINANCIAL GROUP COMPANY LIMITED SHINSEI BANK LIMITED
SHIZUOKA BANK LTD (THE)
SKANDINAVISKA ENSKILDA BANKEN SLM CORPORATION
SOCIETE GENERALE
SOVEREIGN BANCORP INCORPORATED ST. GEORGE BANK LIMITED
STANDARD BANK GROUP LIMITED STANDARD CHARTERED PLC STATE BANK OF INDIA STATE STREET CORPORATION
SUMITOMO MITSUI FINANCIAL GROUP INC
SUMITOMO TRUST AND BANKING COMPANY LIMITED (THE) SUNTRUST BANKS, INC.
SVENSKA HANDELSBANKEN AB SWEDBANK AB
TAISHIN FINANCIAL HOLDING COMPANY LIMITED TAIWAN COOPERATIVE BANK
TORONTO-DOMINION BANK (THE) TURKIYE IS BANKASI A.S. U.S. BANCORP
UBI BANCA UBS AG UNICREDIT SPA
Table A.1: Variable definitions and data sources.
The appendix presents data sources, definitions and expected signs in our regression analyses for all dependent and independent variables that are used in the empirical study. The expected sign of each independent variable on the systemic risk of a bank or insurer is shown in the last column with a “+” indicating an expected increasing (and a “-” a decreasing) impact on systemic risk. The bank and insurer controls were taken from the Thomson Reuters Financial Datastream and Thomson Worldscope databases.
Variable name Definition Data source Hypotheses Expected sign
Panel A: Systemic risk measures
∆CoVaR Unconditional ∆CoVaR as defined by Adrian and Brunnermeier (2014), measured as the difference of the Value-at-risk (VaR) of a financial sector index conditional on the distress of a particular insurer and the VaR of the sector index conditional on the median state of the firm.
Datastream, own calc.
MES Marginal Expected Shortfall as defined by Acharya et al. (2010) as the negative average re-turn on an individual firm’s stock on the days the MSCI World index experienced its 5% worst outcomes.
Datastream, own calc.
Panel B: Main independent variables
Interconnectedness PCAS measure as defined in Billio et al. (2012). PCAS is constructed using a decomposition of the variance-covariance matrix of the firms’ daily, stan-dardized stock returns.
Datastream, own calc. More exposure to other banks and insurers. +
Market-to-book Market value of common equity divided by book value of common equity.
Worldscope (WC07210, WC03501)
Greater charter value incentivizes bank managers to keep their bank’s capital ratio and to limit their risk-taking (see Keeley, 1990 and Fahlenbrach et al. (2012)).
-Total assets Natural logarithm of a firm’s total assets. Worldscope (WC02999) Too-big-to-fail vs. more diversification. +/
-Leverage Book value of assets minus book value of equity plus market value of equity, divided by market value of equity.
Worldscope (WC02999, WC03501, WC08001), own calc.
Disciplining effect of leverage vs. greater vulnera-bility during financial crises (see Adrian and Shin, 2010).
+/
-Performance Annual buy-and-hold stock returns computed from the first and last trading day in the year 2006.
Datastream, own calc. Firms that performed well in the past will continue to perform well over time VS. institutions that took on too many risks in the past could also stick to their cul-ture of risk-taking (see Fahlenbrach et al., 2012) and increase their exposure and contribution to systemic risk.
+/
-Return on assets Return of the firm on it’s total assets after taxes (in %).
Worldscope (WC08326). Higher profits can shield banks from the adverse ef-fects of a financial crisis
-Debt maturity Total long-term debt (due in more than one year) di-vided by total debt.
Worldscope (WC03251, WC03255).
A less fragile funding structure of a bank makes it less vulnerable to sudden shortages in liquidity during a crisis (see Brunnermeier and Pedersen, 2009).
Table A.2: Variable definitions and data sources (continued).
Variable name Definition Data source Hypotheses Expected sign
Panel C: Bank characteristics
Deposits Total deposits divided by total liabilities. Worldscope (WC03019, WC03351).
Banks with more deposit financing are more stable in times of crises.
-Loan loss provisions Natural logarithm of expenses set aside as an al-lowance for uncollectable or troubled loans.
Worldscope (WC01271). A larger buffer against troubled loans should serve as a stabilizing factor reducing a bank’s total risk.
-Loans Ratio of total loans to total assets. Worldscope (WC02271, WC02999).
A higher loans-to-assets ratio of a bank could indicate a business model that focuses on lending rather than more risky activities.
-Tier-1-capital Ratio of a bank’s Tier-1-Capital to total assets. Worldscope (WC18228, WC02999).
Higher regulatory bank capital acts as a buffer against losses and should stabilize both an individual bank and the financial sector.
-Non-interest income Non-interest income divided by total interest income. Worldscope (WC01021, WC01016).
Higher values of non-interest income relative to to-tal interest income could be indicative of a busi-ness model that concentrates more on non-deposit taking activities (like, e.g., investment banking) and thus more risk-taking (see, e.g., Brunnermeier et al., 2012).
+
Panel D: Insurer characteristics
Investment success Ratio of insurer’s investment income to net revenues. Worldscope (WC01001, WC01006), own calc.
Insurers become more intertwined with financial mar-kets through asset management.
+
Loss ratio Ratio of claim and loss expenses plus long term insur-ance reserves to earned premiums.
Worldscope (WC15549). High loss ratio indicates bad quality of the insurance portfolio and increases default risk.
+
Non-Policyholder Liabilities Total on balance sheet liabilities divided by total in-surance reserves.
Worldscope (WC03351, WC03030).
Non-core insurance activities increase the risk to suf-fer from other sources in the financial market (see IAIS, 2013).
+
Operating expenses Ratio of operating expenses to total assets. Worldscope (WC01249, WC02999).
Poor management reflects the total risk of the insur-ance company.
+
Other income Other pre-tax income and expenses besides operating income.
Worldscope (WC01262). Non-core insurance activities increase the risk to suf-fer from other sources in the financial market (see IAIS, 2013).
+
Fixed income Natural logarithm of fixed income. Worldscope (WC01262). Engagement in other asset classes than fixed income could suffer more profoundly from plummeting asset prices.
References
Acharya, V. V., J. Biggs, M. Richardson, and S. Ryan (2009): “On the Financial Regulation of
Insurance Companies,” Working paper, New York University.
Acharya, V. V., L. H. Pedersen, T. Philippon, and M. Richardson (2010): “Measuring Systemic
Risk,” Working paper, New York University.
Acharya, V. V.andT. Yorulmazer(2008): “Cash-in-the-market pricing and optimal resolution of
bank failures,” Review of Financial Studies, 21, 2705–2742.
Adrian, T.and M. K. Brunnermeier (2014): “CoVaR,” Federal Reserve Bank of New York Staff
Reports 348.
Anginer, D.and A. Demirguc¨¸-Kunt (2014): “Bank Capital and Systemic Stability,” World Bank
Policy Research Paper, 6948.
Anginer, D., A. Demirguc¨¸-Kunt, and M. Zhu (2014): “How does Bank Competition Affect
Sys-temic Stability?” Journal of Financial Intermediation, 23, 1–26.
Arnold, B., C. Borio, L. Ellis,and F. Moshirian(2012): “Systemic risk, macroprudential policy
frameworks, monitoring financial systems and the evolution of capital adequacy,” Journal of
Banking and Finance, 36, 3125–3132.
Baluch, F., S. Mutenga, and C. Parsons (2011): “Insurance, Systemic Risk and the Financial
Crisis,” The Geneva Papers on Risk and Insurance, 36, 126–163.
Bell, M.and B. Keller(2009): “Insurance and Stability: The Reform of Insurance Regulation,”
Zurich Financial Services Group Working Paper.
Bierth, C., F. Irresberger, and G. Weiß (2015): “Systemic Risk of Insurers around the Globe,”
Journal of Banking and Finance, 55, 232–245.
Billio, M., A. W. Lo, M. Getmansky, and L. Pelizzon(2012): “Econometric Measures of
Con-nectedness and Systemic Risk in the Finance and Insurance Sectors,” Journal of Financial
Eco-nomics, 104(3), 535–559.
Black, L., R. Correa, X. Huang, andH. Zhou (2013): “The Systemic Risk of European Banks
during the Financial and Sovereign Debt Crises,” Working Paper.
Brownlees, C. T.andR. Engle(2012): “Volatility, Correlation and Tails for Systemic Risk
Mea-surement,” Working Paper.
Brunnermeier, M. K., G. N. Dong, andD. Palia(2012): “Banks’ Non-Interest Income and
Sys-temic Risk,” Working paper, Princeton University.
Brunnermeier, M. K. and L. H. Pedersen (2009): “Market Liquidity and Funding Liquidity,”
Chen, H., J. D. Cummins, K. S. Viswanathan, and M. A. Weiss (2014): “Systemic Risk and the
Interconnectedness between Banks and Insurers: An Econometric Analysis,” Journal of Risk
and Insurance, 81(3), 623–652.
Cummins, J. D.andM. A. Weiss(2014): “Systemic Risk and the U.S. Insurance Sector,” Journal
of Risk and Insurance, 81(3), 489–528.
Eling, M.and D. Pankoke(2014): “Systemic risk in the insurance sector - What do we know?”
Working paper, St. Gallen University.
Eling, M.andH. Schmeiser(2010): “Insurance and credit crisis: Impact and ten consequences for
risk management supervision,” Geneva Papers on Risk and Insurance - Issues and Practice, 35, 9–34.
Fahlenbrach, R., R. Prilmeier, and R. M. Stulz (2012): “This Time is the Same: Using Bank
Performance in 1998 to Explain Bank Performance During the Recent Financial Crisis,” Journal
of Finance, 67, 2139–2185.
Fahlenbrach, R.andR. M. Stulz(2011): “Bank CEO incentives and the credit crisis,” Journal of
Financial Economics, 99, 11–26.
Gandhi, P. and H. Lustig(2015): “Size Anomalies in U.S. Bank Stock Returns,” Journal of
Fi-nance, 70, 733–768.
Hagendorff, B., J. Hagendorff, K. Keasey, and A. Gonzalez (2014): “The risk implications of
insurance securitization: The case of catastrophe bonds,” Journal of Corporate Finance, 25, 387–402.
Harrington, S. E. (2009): “The Financial Crisis, Systemic Risk, and the Future of Insurance
Regulation,” Journal of Risk and Insurance, 76, 785–819.
Hovakimian, A., E. J. Kane,andL. Laeven(2012): “Variation in systemic risk at US banks during
1974-2010,” Tech. rep., National Bureau of Economic Research.
IAIS (2013): “Global Systemically Important Insurers: Proposed Assessment Methodology,” In-ternational Association of Insurance Supervisors.
Koenker, R.andG. Basset(1978): “Regression Quantiles,” Econometrica, 46(1), 33–40.
Lehmann, A. P.and D. M. Hofmann (2010): “Lessons learned from the financial crisis for risk
management: Contrasting developments in insurance and banking,” Geneva Papers on Risk and
Insurance - Issues and Practice, 35, 63–78.
M ¨uhlnickel, J. and G. N. Weiß (2015): “Consolidation and systemic risk in the international
insurance industry,” Journal of Financial Stability, 18, 187–202.
O’Hara, M. and W. Shaw (1990): “Deposit Insurance and Wealth Effects: The Value of Being
Trichet, J.-C. (2005): “Financial Stability and the Insurance Sector,” The Journal of Risk Finance,
30, 65–71.
Vallascas, F.and J. Hagendorff (2011): “The Impact of European Bank Mergers on Bidder
De-fault Risk,” Journal of Banking and Finance, 35, 902–915.
vanLelyveld, I., F. Liedorp, and M. Kampman (2011): “An empirical assessment of reinsurance
risk,” Journal of Financial Stability, 7(4), 191–203.
Weiß, G., D. Bostandzic, and F. Irresberger (2013): “Catastrophe Bonds and Systemic Risk,”
Working paper.
Weiß, G.and J. M ¨uhlnickel(2014): “Why Do Some Insurers Become Systemically Relevant?”
Table I: Geographic sample distribution
The table shows the geographic spread for the sample of the largest 148 banks and for the 98 largest international insurers. The minimum and maximum values for the total assets in 2006 are given in billion US$.
Banks Insurer
Table II: Descriptive statistics: banks and insurers
The table shows summary statistics for the sample of the largest 148 banks and for the 98 largest international insurers. The values for the systemic risk measures MES and∆CoVaR are given for the crisis period (July 2007 to December 2008) and the values for the three independent variables are calculated for the fiscal year 2006. Variable definitions and data sources are documented in Appendix A.1. All data are winsorized at the 1% and 99% levels.
Banks
No. Obs. Min. 10% 25% Median Mean 75% 90% Max.
MES 148 -0.166 -0.048 0.001 0.033 0.025 0.064 0.097 0.137
∆CoVaR 148 -0.021 -0.015 -0.010 -0.001 -0.005 0.000 0.000 0.001
Total assets (in billions) 148 56.620 65.278 85.010 151.200 350.800 345.500 1046.447 1841.000
Leverage 146 4.071 5.221 6.585 9.046 13.430 14.110 22.114 96.060
Interconnectedness (in 10−9) 148 0.000 0.000 0.012 15950.000 108900.000 149556.000 328951.000 1211000.000
Insurer
No. Obs. Min. 10% 25% Median Mean 75% 90% Max.
MES 98 0.009 0.020 0.034 0.051 0.056 0.073 0.098 0.150
∆CoVaR 98 -0.021 -0.019 -0.018 -0.015 -0.015 -0.013 -0.011 -0.004
Total assets (in billions) 98 17.910 23.187 27.080 56.390 158.700 147.300 405.449 131.000
Leverage 98 1.729 3.322 5.273 7.309 9.285 11.350 17.265 42.260
Interconnectedness (in 10−9) 98 0.000 0.003 0.012 0.078 0.078 0.211 0.368 1.001
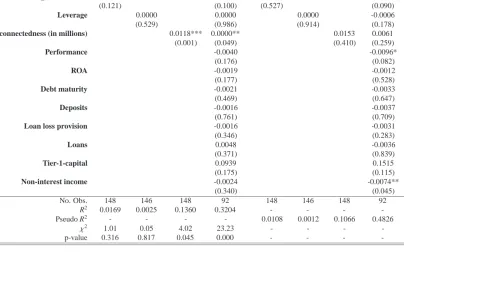
Table III: Cross-sectional regression of systemic risk of banks.
The table shows the OLS and quantile regression results using a sample of the 148 largest banks. Independent variables are calculated for the fiscal year 2006 and the systemic risk measures are calculated for the crisis period (July 2007 to December 2008). Regressions on MES are on the 95%-percentile. The OLS regressions are estimated using heteroskedasticity-robust standard errors and the quantile regression uses bootstrapped standard errors. P-values are given in parentheses. ***,**, and * denote statistical significance at the 1%-,5%- and 10%-level respectively. Variable definitions and data sources are documented in Appendix A.1. Test statistics and p-values for Breusch-Pagan tests on heteroskedasticity are reported below.
Dependent variable: ∆CoVaR ∆CoVaR ∆CoVaR ∆CoVaR ∆CoVaR ∆CoVaR ∆CoVaR ∆CoVaR
Estimation: OLS regression Quantile regression
Log(Total assets) 0.0008 0.0022 0.0008 0.0034*
(0.121) (0.100) (0.527) (0.090)
Leverage 0.0000 0.0000 0.0000 -0.0006
(0.529) (0.986) (0.914) (0.178)
Interconnectedness (in millions) 0.0118*** 0.0000** 0.0153 0.0061
(0.001) (0.049) (0.410) (0.259)
Performance -0.0040 -0.0096*
(0.176) (0.082)
ROA -0.0019 -0.0012
(0.177) (0.528)
Debt maturity -0.0021 -0.0033
(0.469) (0.647)
Deposits -0.0016 -0.0037
(0.761) (0.709)
Loan loss provision -0.0016 -0.0031
(0.346) (0.283)
Loans 0.0048 -0.0036
(0.371) (0.839)
Tier-1-capital 0.0939 0.1515
(0.175) (0.115)
Non-interest income -0.0024 -0.0074**
(0.340) (0.045)
No. Obs. 148 146 148 92 148 146 148 92
R2 0.0169 0.0025 0.1360 0.3204 - - -
-Pseudo R2 - - - - 0.0108 0.0012 0.1066 0.4826
χ2 1.01 0.05 4.02 23.23 - - -
-p-value 0.316 0.817 0.045 0.000 - - -
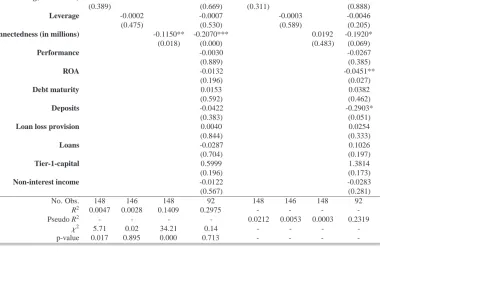
Table IV: Cross-sectional regression of systemic risk of banks.
The table shows the OLS and quantile regression results using a sample of the 148 largest banks. Independent variables are calculated for the fiscal year 2006 and the systemic risk measures are calculated for the crisis period (July 2007 to December 2008). Regressions on ∆CoVaR are on the 5%-percentile. The OLS regressions are estimated using heteroskedasticity-robust standard errors and the quantile regression uses bootstrapped standard errors. P-values are given in parentheses. ***,**, and * denote statistical significance at the 1%-,5%- and 10%-level respectively. Variable definitions and data sources are documented in Appendix A.1. Test statistics and p-values for Breusch-Pagan tests on heteroskedasticity are reported below.
Dependent variable: MES MES MES MES MES MES MES MES
Estimation: OLS regression Quantile regression
Log(Total assets) 0.0042 0.0062 0.0071 0.0022
(0.389) (0.669) (0.311) (0.888)
Leverage -0.0002 -0.0007 -0.0003 -0.0046
(0.475) (0.530) (0.589) (0.205)
Interconnectedness (in millions) -0.1150** -0.2070*** 0.0192 -0.1920*
(0.018) (0.000) (0.483) (0.069)
Performance -0.0030 -0.0267
(0.889) (0.385)
ROA -0.0132 -0.0451**
(0.196) (0.027)
Debt maturity 0.0153 0.0382
(0.592) (0.462)
Deposits -0.0422 -0.2903*
(0.383) (0.051)
Loan loss provision 0.0040 0.0254
(0.844) (0.333)
Loans -0.0287 0.1026
(0.704) (0.197)
Tier-1-capital 0.5999 1.3814
(0.196) (0.173)
Non-interest income -0.0122 -0.0283
(0.567) (0.281)
No. Obs. 148 146 148 92 148 146 148 92
R2 0.0047 0.0028 0.1409 0.2975 - - -
-Pseudo R2 - - - - 0.0212 0.0053 0.0003 0.2319
χ2 5.71 0.02 34.21 0.14 - - -
-p-value 0.017 0.895 0.000 0.713 - - -