White Rose Research Online URL for this paper:
http://eprints.whiterose.ac.uk/110518/
Version: Published Version
Proceedings Paper:
Deans, I, Dimas, I and Velis, CA (2016) Modelling of Solid Recovered Fuel (SRF)
Properties Based on Material Composition – Chloride Quality. In: Thomé-Kozmiensky, KJ
and Thiel, S, (eds.) Waste Management: Volume 6 - Waste to Energy. IRRC
Waste-to-Energy 2016, 05-06 Sep 2016, Vienna, Austria. TK Verlag , pp. 389-399. ISBN
978-3-944310-29-9
[email protected] https://eprints.whiterose.ac.uk/ Reuse
Unless indicated otherwise, fulltext items are protected by copyright with all rights reserved. The copyright exception in section 29 of the Copyright, Designs and Patents Act 1988 allows the making of a single copy solely for the purpose of non-commercial research or private study within the limits of fair dealing. The publisher or other rights-holder may allow further reproduction and re-use of this version - refer to the White Rose Research Online record for this item. Where records identify the publisher as the copyright holder, users can verify any specific terms of use on the publisher’s website.
Takedown
If you consider content in White Rose Research Online to be in breach of UK law, please notify us by
MBT and SRF
Modelling of Solid Recovered Fuel (SRF) Properties
Based on Material Composition – Chloride Quality
Innes Deans, Ioannis Dimas and Costas A. Velis
1. Introduction ...389
2. Chloride and SRF quality ...390
3. Chloride in waste materials ...391
3.1. Chloride in consumer market products ...391
3.2. Chloride data for waste materials ...392
4. Methods ...394
4.1. Monte Carlo simulation ...394
4.2. Chloride probability distributions ...394
4.3. SRF composition scenarios ...394
5. Results ...395
6. Discussion ...396
7. Conclusions ...398
8. References ...398
1. Introduction
Producing solid recovered fuels (SRF) is a well-established route for recovering energy resources from municipal solid waste (household and/or commercial) [17]. Chloride content critically impacts the quality of SRF [19]. It directly inluences operation of thermal processes, having deleterious efects through the high temperature corrosion of the boilers [16] and through demands placed on the lue gas treatment (FGT) system, which could impact emissions control.MBT and SRF
Understanding the sources of chloride in SRF along with the processing and technology factors which inluence its concentration, and to what extent it can be inluenced and controlled, is important for waste operators; particularly of mechanical biological treat-ment (MBT) plants. At the motreat-ment, SRF is mainly utilized in the cetreat-ment industry and this market is well established [11]. Whilst the cement industry, despite the variations in thermal recovery technologies in place – feeding SRF into the pre-calciner, main burner or low-heat end of the kiln; presence of chloride by pass or not – represents perhaps a uniquely robust technical solution for using SRF, extending the market for SRF outlets requires producing SRF of a quality that is acceptable for a broader selection technology options, perhaps on a smaller scale, and which may have more stringent fuel speciications. For these reasons the efective control of SRF quality is critical for the development of the related waste industry in Europe.
Quality control requires the production of a clearly speciied product, characterised by a known and acceptable range of properties across all key parameters, controlling both the average target values and the variability. Chloride is one of the key parameters impacting SRF quality, and its suitability for end-user market outlets. Yet, anecdotal evidence from producers of SRF producers indicates that it remains a problem for the waste industry. he challenge is characterised by a low level of understanding as to how SRF producers can implement an efective quality assurance (QA) system to manage chloride within acceptable boundaries which are understood, and communicated in a transparent manner to an end-user of the SRF, and what techniques are available to operators to inluence and control fuel quality.
his paper illustrates the potential for adopting Monte Carlo simulations to develop an understanding of the key issues impacting chloride concentration in SRF. It uses diferent modelled scenarios to illustrate the extent of uncertainty surrounding chlo-ride content in SRF and how this compares with modern recognised fuel standards.
2. Chloride and SRF quality
he Committee of European Standardisation (CEN) has developed speciications regarding terminology, quality assurance, classes, fuel speciications, sampling, phy-sical and chemical tests for SRF. A key determinant of the class of SRF depends on its chloride content. he CEN speciications for SRF quality based chloride content are shown in the Table 1 [5].
Table 1: CEN/TS 15359 speciied values for chloride content (Cl) in SRF classes
Classification Statistical Unit Class
Property Measure 1 2 3 4 5
Chloride (Cl) Arithmetic mean wt.% d ≤ 0.2 ≤ 0.6 ≤ 1.0 ≤ 1.5 ≤ 3
MBT and SRF
3. Chloride in waste materials
3.1. Chloride in consumer market products
Chloride can be found in waste in two broad forms: organic chloride as associated with the inclusion in organic compounds e.g. plastics; and inorganic chloride e.g. salts.
Approximately 1/3rd of industrially produced chlorine production goes to chemical formation of ethylene dichloride (EDC), which is the precursor of polyvinyl chloride (PVC) [4]. PVC is used in plastic manufacturing for products such as tubes, pipes, ilms, packaging material and many others. PVC is commonly recognised in the waste industry as being an acute, concentrated source of chloride that can be problematic for thermal treatment processes.
Inorganics
1,406 kt/year
Solvents
265 kt/year
PVC
3,196 kt/year Other organics
890 kt/year
Chloromethanes
403 kt/year Epichlorohydrin
494 kt/year
Isocyantes and Oxygenates
3,077 kt/year
[image:4.439.45.398.242.443.2]However, a comparable quantity of the industrial chlorine produced each year is used in the production of isocynates and oxygenates [4]. Isocyantes are intermediates used to produce polyurethane polymers, which in turn are used in products such as che-micals, foam, insulation materials, surface coatings, furniture, under-carpet padding, packaging materials, shoes, and adhesives. At end of life, all of these may contain substantial quantities of chloride, and add to the total chloride load found in mixed waste containing such items. Whereas chloride in this chemical form may not be as concentrated as PVC, the breadth of the products which includes these compounds is signiicant and widespread.
Figure 1: Major industry uses for industrially produced chloride in Europe
MBT and SRF
Inorganic chloride can be found in such products as table salt (NaCl). In solid wastes it is identiiable in such materials as biological wastes, including kitchen waste and garden waste (bio waste). Whilst, the speciic concentration of chloride as inorganic chloride in these wastes is lower for example, than that found in PVC, the overall composition of the waste may mean that inorganic chloride contributes a greater proportion of the overall chloride load – i.e. there may be more biological waste than PVC in a mixed waste stream.
Inorganic chloride and organic chloride exhibit distinctly diferent thermal behaviour, but both will largely volatilise the temperatures required for waste combustion and therefore they both are likely to be found mainly in the lue gas [9].
3.2. Chloride data for waste materials
Studies sought to quantify the concentration of chloride (organic and inorganic) in representative materials that comprise mixed (municipal: household or commercial) solid waste [1, 2, 3, 6, 7, 10, 12, 13, 14, 15, 18, 20, 21]. A summary of the data from a review of the literature on chloride is presented in Table 2.
he data illustrate a couple of key aspects regarding the current state of knowledge regarding chloride in solid waste. Firstly, some material categories exhibit large va-riation in potential chloride content. his is best exempliied by the data for Plastic (hard) where the range of chloride concentration spans 5 orders of magnitude from 16.8 percent to 0.001 percent.
Secondly, the lack of research data for the majority of material categories resulting in a corresponding high degree of uncertainty associated with our understanding and ability to predict chloride content in any SRF subsequently produced. here are 4 material types which stand out as contrary to this general observation regarding data paucity due to having signiicantly more data associated with them – these are: Biological waste; Paper & Card; Plastics (sot); and Plastics (hard); each of which has over 20 data.
MBT and SRF
Chloride Data
Material wt.% d No.
Max. Min. Count
Ash 0.070 0.000 2
Batteries 1.580 0.000 2
Biological 1.492 0.119 27
Cartons 0.060 0.001 3
Composites 0.740 0.530 2
Fe Metals 0.760 0.000 3
Fines < 10 mm 0.740 0.020 3
Fluff 1.080 0.170 2
Glass 0.008 0.000 4
Non-Fe Metals 0.000 0.000 3
Other Combustibles 2.290 0.000 6
Paper & Card 0.630 0.002 22
Plastic (soft) 3.880 0.020 29
Plastic (hard) 16.80 0.001 30
Rubber 9.380 0.355 4
Shoes/leather 6.050 1.940 3
Stones/ceramics 2.190 0.000 3
Textiles/fabrics 1.690 0.011 9
Tissues 0.240 0.008 2
Wood 0.400 0.050 9
All Materials 16.800 0.000 168
d: dry reporting basis
Sources:
Velis, C. A.; Longhurst, P. J.; Drew, G. H.; Smith, R.; Pollard, S. J. T.: Production and Quality Assurance of Solid Recovered Fuels Using Mechanical – Biological Treatment (MBT) of Waste: A Comprehensive Assessment. Critical Reviews in Environmental Science and Technology, 40: 12, 2010, pp. 979-1105
Guo, X.F.; Yang, X.L.; Li, H.; Wu, C.Z.; Che, Y.: Release of Hydrogen Chloride from Combustibles in Municipal Solid Waste. Envi-ronmental School of Science and Technology. 35:(10), 2001, pp. 2001-2005
Sørum, L.; Gran, I.R.: Characterisation of MSW for Combustion Systems. Kolbjørn Hejes: SINTEF Energy Research. 2001, pp. 6-20 Rasmus, E.; Christensen, T.H.: Characterization of household waste in Greenland. In: Waste Management, 31:(7), 2011, pp. 1461-1466 Riber, C.; Petersen, C.; Christensen, T.H.: Chemical composition of material fractions in Danish household waste. Waste Management, 29:(4), 2009, pp. 1251-1257
Watanabe, N.; Yamamoto, O.; Sakai, M.; Fukuyama J.: Combustible and incombustible speciation of Cl and S in various components of municipal solid waste. In: Waste Management 24:(6), 2004, pp. 623-632
Österlund, H.; Rodushkin, I.; Ylinenjärvi, K.; Baxter, D.: Determination of total chlorine and bromine in solid wastes by sintering and inductively coupled plasma-sector ield mass spectrometry. In: Waste Management, 29:(4), 2009, pp. 1258-1264
Wang, K.S.; Chiang, K.Y.; Tsai, C.C.; Sun, C.J.: Efects of chlorides on emissions of Hydrogen Chloride formation in waste incineration. In: Chemosphere, 38:(7), 1999, pp. 1571–1582
Burnley, S.J.: he use of chemical composition in waste management planning – A case study. In: Waste Management, 27:(3), 2007, 327-326 Domalski, E.S.; Ledford, A.E.; Bruce, S.S., JR.; Churney, K.L.: he chlorine content of municipal solid waste from Baltimore County, Maryland and Brooklyn, New York. A report prepared for Oice of Renewable Technology Energy from Municipal Waste Division. Chemical hermodynamics Division, Center for Chemical Physics and National Bureau of Standards, Gaithersburg, Maryland. US. Depart. Of Energy, NBSIR 85-3213, 1985
Schirmer, M.; Bilitewski, B.; Rotter, V.S.: Sources of chlorine in MSW and RDF – Species, analytical methods and behaviour in treat-ment processes. Proceedings Philadelphia 2005, Twentieth International Conference in Solid Waste Technology and Managetreat-ment, Philadelphia, U.S.A, 2005
Chiemchaisr, C.; Charnnok, B.; Visvanathan, C.: Recovery of plastic wastes from dumpsite as refuse-derived fuel and its utilization in small gasiication system. Bioresource Technology, 101:(5), 2010, pp. 1522-1527
Kanters, M.J.; Van Nipsen, R.; Louw, R.; Mulder, P.: Chlorine input and chlorophenol emission in the lab-scale combustion of municipal solid waste. Centre of Chemistry and the Environment, Leiden Institute of Chemistry, Leiden University. Leiden, the Netherlands. In: Environmental Science and Technology, 30:(7), 1996, pp. 2121-2126
Table 2:
MBT and SRF
4. Methods
4.1. Monte Carlo simulation
It is evident that we need to explicitly address the issue of uncertainty in assessing, monitoring and predicting chloride concentration in any methodology seeking to address SRF quality issues. Monte Carlo simulation [8], with its inherent ability to accommodate and quantify uncertainties in data, is therefore ideally suited as a tool to examine and address these issues.
Monte Carlo techniques allow for consideration of uncertainty by generating input va-lues randomly from a range of possible vava-lues associated with a probability distribution based upon the available input data. his allows quantiication of the conidence limits (upper and lower) associated with any conclusion derived from the model’s results.
4.2. Chloride probability distributions
he data set out in Table 2 were used as the basis to create probability distributions that describe the likely chloride content of each waste material. he approach assumes that chloride concentrations for each material category followed a normal distribution. In order to it the normal distribution to the data, the mean value was speciied to the midpoint of the range and the spread of data was taken to be equivalent to 4 standard deviations. his is to say: 95 percent of all expected values were forecast to be within the range of chloride distributions identiied within the literature, and that the values were normally distributed around the centre of the range.
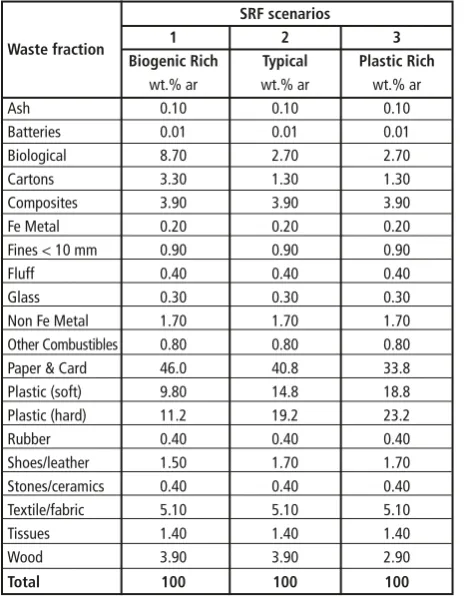
4.3. SRF composition scenarios
he Monte Carlo simulation was repeated for 3 diferent scenarios, each with diferent assumptions regarding SRF material composition. he composition for each scenario was deined to relect diferent types of SRF, as follows (Table 3):
• Biogenic Rich – comprised of a relatively high proportion of biogenic materials including paper & car, and biological waste.
• Typical – comprised of a composition representative of that which might be expect from an MBT treating municipal wastes.
• Plastic Rich – comprised of a composition with a higher plastic component, as might be associated with commercial wastes – for example material recycling (MRF) plant residues.
MBT and SRF
5. Results
he Monte Carlo models for each scenario were each run with 32,000 iterations in order to provide a smooth result. he Monte Carlo models (frequency curves) for each scenario are displayed in Figure 2. Key numeric parameters of each scenario’s results are displayed in Table 4:SRF scenarios
Waste fraction 1 2 3
Biogenic Rich Typical Plastic Rich
wt.% ar wt.% ar wt.% ar
Ash 0.10 0.10 0.10
Batteries 0.01 0.01 0.01 Biological 8.70 2.70 2.70
Cartons 3.30 1.30 1.30
Composites 3.90 3.90 3.90
Fe Metal 0.20 0.20 0.20
Fines < 10 mm 0.90 0.90 0.90
Fluff 0.40 0.40 0.40
Glass 0.30 0.30 0.30
Non Fe Metal 1.70 1.70 1.70
Other Combustibles 0.80 0.80 0.80
Paper & Card 46.0 40.8 33.8
Plastic (soft) 9.80 14.8 18.8
Plastic (hard) 11.2 19.2 23.2
Rubber 0.40 0.40 0.40
Shoes/leather 1.50 1.70 1.70
Stones/ceramics 0.40 0.40 0.40
Textile/fabric 5.10 5.10 5.10
Tissues 1.40 1.40 1.40
Wood 3.90 3.90 2.90
Total 100 100 100
ar: as received reporting basis
Table 3:
SRF composition scenarios
0.16
0.14
0.12
0.10
0.08
0.06
0.04 Frequency
1.6 0.2
0.0 1.2
0.0 0.02
0.4 0.6 0.8 1.0 1.4 1.8
Chloride wt.% d
[image:8.439.45.278.56.355.2]Typical Biogenic rich Plastic rich
Figure 2:
MBT and SRF
6. Discussion
he results of the Monte Carlo simulations illustrates the impact of diferent scenarios (compositions) on the chloride concentration of SRF. Firstly, as might be intuitively expected looking at the data for chlorine concentrations in individual materials, in-creasing concentration of plastics increases the predicted chlorine content of SRF. he highest Mean value (Table 4) is associated with the Plastic Rich scenario, and the lowest Mean value with the Biogenic Rich scenario.
However, the Monte Carlo methodology provides further insights into the inluence that SRF composition has on chloride concentrations: it also illustrates the impact of uncertainty, how uncertainty varies, and how uncertainty might be related to SRF composition (scenarios). he modelling illustrates that the spread of chloride values also changes between the diferent scenarios. his is visible when comparing the plots in Figure 2 – with the plot for the Plastic Rich scenario being wider than that for the
Biogenic Rich scenario – and this is numerically quantiied via the SD values (Table 4).
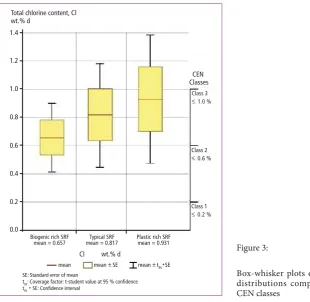
he SD ranges from 0.122 for Biogenic Rich SRF to 0.228 for Plastic Rich SRF. he lar-ger values signify a greater spread of chloride values, and with it a greater to degree of uncertainty. Such increases in uncertainty in a key fuel characteristic, such as chloride, have a direct impact on the quality control achieved by a process producing SRF. To illustrate this, and the potential impact of the uncertainty values indicated by the Monte Carlo simulations, the results of the modelling can be compared to the bands deined within the CEN standard for chloride concentrations, an application of compliance statistics (Figure 3).
Figure 3 illustrates if, for example, an end user’s requirements for an SRF includes a speciication for chloride content of ≤ 1.0 percent, which would be consistent with that expected for a cement kiln [9], whilst all scenarios achieve this value on the expected arithmetic mean, only the Biogenic Rich scenario is capable of producing such an SRF with greater than a 95 percent conidence. hat is to say, in a sizeable number of cases the average SRFs that could be produced under the Typical and Plastic Rich scenarios may not meet the required standard for chloride.
Table 4: Statistical characteristics of chloride concentration for each SRF scenario
SRF scenarios
1 2 3
Biogenic Rich Typical Plastic Rich
wt.% d wt.% d wt.% d
Arithmetic mean 0.657 0.817 0.931
Standard deviation (SD) 0.122 0.185 0.228
LCL (95 %) 0.418 0.455 0.484
UCL (95 %) 0.896 1.179 1.378
Q1 0.573 0.690 0.773
Q3 0.740 0.941 1.084
UCL (95 %) = upper conidence limit Q3 = 3rd quartile
MBT and SRF
As the composition to an SRF producing facility varies, a proportion of the SRF may not meet the standard for chloride, if the processing cannot alleviate for such input changes. Whether this non-compliance becomes important, in that it constitutes an unacceptable problem for SRF acceptance and recovery, would be down to end-user and could depend on various factors e.g. further processing technology, or regulatory compliance. However, the data for chloride concentration will also be impacted by issues inherent to the sampling regime itself e.g. sampling techniques, sampling rate/ frequency, and averaging period, sample lot, etc. and it is important that these are understood by both the SRF producer and its end-market SRF user and a common understanding is adopted, or issues could arise within Fuel Supply Agreements (FSAs) between the parties.
In all cases, in the planning/designing phase of a SRF producing facility or in the prepa-ration of a FSA, Monte Carlo simulations may be able to assist with demonstrating that it may or may not be probable to produce an SRF product that consistently satisies the quality requirements of an end-user of the fuel – e.g. thermal process plant. Employing such analytical tools can minimise the potentially detrimental impacts to the technical and inancial viability of a facility producing SRF which would result if it cannot meet the standard required by its market outlets. his preliminary tool is currently further developed by the University of Leeds to a fuller suite with a view to assist a quantiied quality assurance of SRF production and use.
1.4
Total chlorine content, Cl wt.% d
1.2
1.0
0.8
0.6
0.4
0.2
0.0
Biogenic rich SRF mean = 0.657
Class 3 <_ 1.0 % Class 2 <_ 0.6 % Class 1 <_ 0.2 %
[image:10.439.49.360.53.355.2]CEN Classes
mean mean + SE mean +_ t_ 95*SE Plastic rich SRF mean = 0.931 Typical SRF
mean = 0.817
Cl wt.% d
SE: Standard error of mean
t95: Coverage factor: t-student value at 95 % confidence t95 * SE: Confidence interval
Figure 3:
MBT and SRF
7. Conclusions
he data and discussion presented in Section 4.2 demonstrates the uncertainty with respect to deining the chlorine content of individual waste categories – i.e. within Paper & Card, Plastics etc. – as illustrated by the broad range of chloride values observed within the literature and, frequently, the paucity of data for many individual material types. Monte Carlo simulation is a tool ideally suited to assessing and forecasting SRF quality as it address and quantify uncertainty within the methodology and results. he application of Monte Carlo simulation, as illustrated by this paper, shows how the methodology can be used to assess the impact of diferent SRF scenarios will have on SRF quality – in this case through the manipulation of SRF composition, and comparing chloride concentration with industry standard speciication for SRF quality classes.
Given the signiicant technical, commercial and resource implications that can be involved in seeking to manage and monitor SRF quality on an industry scale, it is be-lieve that Monte Carlo simulation is an important tool which could be used to ensure that resources are appropriately directed when addressing quality aspects, and that the measurement and performance of MBT processes is understood in a transparent and easily communicated way.
8. References
[1] Burnley, S.J.: he use of chemical composition in waste management planning – A case study. In: Waste Management, 27:(3), 2007, 327-326
[2] Chiemchaisr, C.; Charnnok, B.; Visvanathan, C.: Recovery of plastic wastes from dumpsite as refuse-derived fuel and its utilization in small gasiication system. Bioresource Technology, 101:(5), 2010, pp. 1522-1527
[3] Domalski, E.S.; Ledford, A.E.; Bruce, S.S., JR.; Churney, K.L.: he chlorine content of municipal solid waste from Baltimore County, Maryland and Brooklyn, New York. A report prepared for Oice of Renewable Technology Energy from Municipal Waste Division. Chemical hermody-namics Division, Center for Chemical Physics and National Bureau of Standards, Gaithersburg, Maryland. US. Depart. Of Energy, NBSIR 85-3213, 1985
[4] Eurochlor: European Chlorine Industry Review 2012-13. Towards a new European Industrial Policy for more competitiveness. Eurochlor, 2013
[5] European Committee for Standardization: Solid Recovered Fuels – Speciication and Classes, CEN/TS 15359:2006
[6] Guo, X.F.; Yang, X.L.; Li, H.; Wu, C.Z.; Che, Y.: Release of Hydrogen Chloride from Combustibles in Municipal Solid Waste. Environmental School of Science and Technology. 35:(10), 2001, pp. 2001-2005
[7] Kanters, M.J.; Van Nipsen, R.; Louw, R.; Mulder, P.: Chlorine input and chlorophenol emission in the lab-scale combustion of municipal solid waste. Centre of Chemistry and the Environment, Leiden Institute of Chemistry, Leiden University. Leiden, the Netherlands. In: Environmental Science and Technology, 30:(7), 1996, pp. 2121-2126
MBT and SRF
[9] Ma, W.; Rotter, V.S.: Overview on the chlorine origin of MSW and Cl-originated corrosion during MSW &RDF combustion process. Institute of Electrical and Electronics Engineers. Bioinforma-tics and Biomedical Engineering, 2008. 2nd ICBBE 2008, pp. 4255-4258
[10] Österlund, H.; Rodushkin, I.; Ylinenjärvi, K.; Baxter, D.: Determination of total chlorine and bromine in solid wastes by sintering and inductively coupled plasma-sector ield mass spectro-metry. In: Waste Management, 29:(4), 2009, pp. 1258-1264
[11] Organisation for Economic Co-operation and Development: Fact book 2010: Economic, Envi-ronmental and Social Statistics. 2010
[12] Rasmus, E.; Christensen, T.H.: Characterization of household waste in Greenland. In: Waste Management, 31:(7), 2011, pp. 1461-1466
[13] Riber, C.; Petersen, C.; Christensen, T.H.: Chemical composition of material fractions in Danish household waste. Waste Management, 29:(4), 2009, pp. 1251-1257
[14] Schirmer, M.; Bilitewski, B.; Rotter, V.S.: Sources of chlorine in MSW and RDF – Species, ana-lytical methods and behaviour in treatment processes. Proceedings Philadelphia 2005, Twentieth International Conference in Solid Waste Technology and Management, Philadelphia, U.S.A, 2005
[15] Sørum, L.; Gran, I.R.: Characterisation of MSW for Combustion Systems. Kolbjørn Hejes: SIN-TEF Energy Research. 2001, pp. 6-20
[16] Tubergen, J.; Glorius, T.; Waeyenberg, E.: Classiication of Solid Recovered Fuel. European Re-covered Fuel Organisation (ERFO). 2005
[17] Velis, C. A.; Cooper, J.: Are solid recovered fuels resource-eicient? In: Waste Management & Research 31(2), 2013, pp. 113-114
[18] Velis, C. A.; Longhurst, P. J.; Drew, G. H.; Smith, R.; Pollard, S. J. T.: Production and Quality Assurance of Solid Recovered Fuels Using Mechanical – Biological Treatment (MBT) of Waste: A Comprehensive Assessment. Critical Reviews in Environmental Science and Technology, 40: 12, 2010, pp. 979-1105
[19] Velis, C. A.; Wagland, S.; Longhurst, P. J.; Robson, B.; Sinield, K.; Wise, S.; Pollard, S. J. T.: Solid recovered fuel: the inluence of waste stream composition and processing on chlorine content and fuel quality. In: Environmental Science & Technology 46(3), 2012, pp. 1923-1931
[20] Wang, K.S.; Chiang, K.Y.; Tsai, C.C.; Sun, C.J.: Efects of chlorides on emissions of Hydrogen Chloride formation in waste incineration. In: Chemosphere, 38:(7), 1999, pp. 1571–1582 [21] Watanabe, N.; Yamamoto, O.; Sakai, M.; Fukuyama J.: Combustible and incombustible speciation