Segmentation and Quantification for Angle-Closure
Glaucoma Assessment in Anterior Segment OCT
Huazhu Fu, Yanwu Xu, Stephen Lin, Xiaoqin Zhang, Damon Wing Kee Wong, Jiang Liu, Alejandro F. Frangi,
Mani Baskaran, and Tin Aung
Abstract—Angle-closure glaucoma is a major cause of irre-versible visual impairment and can be identified by measuring the anterior chamber angle (ACA) of the eye. The ACA can be viewed clearly through Anterior Segment Optical Coherence Tomography (AS-OCT), but the imaging characteristics and the shapes and locations of major ocular structures can vary signif-icantly among different AS-OCT modalities, thus complicating image analysis. To address this problem, we propose a data-driven approach for automatic AS-OCT structure segmentation, measurement and screening. Our technique first estimates initial markers in the eye through label transfer from a hand-labeled ex-emplar dataset, whose images are collected over different patients and AS-OCT modalities. These initial markers are then refined by using a graph-based smoothing method that is guided by AS-OCT structural information. These markers facilitate segmentation of major clinical structures, which are used to recover standard clinical parameters. These parameters can be used not only to support clinicians in making anatomical assessments, but also to serve as features for detecting anterior angle closure in automatic glaucoma screening algorithms. Experiments on Visante AS-OCT and Cirrus HD-OCT datasets demonstrate the effectiveness of our approach.
Index Terms—Data-driven, segmentation, AS-OCT, anterior chamber angle, angle-closure glaucoma.
I. INTRODUCTION
Glaucoma is the second leading cause of blindness world-wide (only second to cataracts), as well as the foremost cause of irreversible blindness [1], [2]. Since vision loss from glau-coma cannot be reversed, improved screening and detection methods for glaucoma are essential to preserve vision and life
Copyright (c) 2017 IEEE. Personal use of this material is permitted. However, permission to use this material for any other purposes must be obtained from the IEEE by sending a request to pubs-permissions@ieee.org. This work was supported by BEP Grant EC-2015-068, and NSFC Grants 61511130084. (Corresponding author: Yanwu Xu.)
H. Fu, Y. Xu, and D. Wong are with the Ocular Imaging Department, Insti-tute for Infocomm Research, Agency for Science, Technology and Research (A*STAR), Singapore (E-mail:{fuhz, yaxu, wkwong}@i2r.a-star.edu.sg).
S. Lin is with Microsoft Research, Beijing, China (E-mail: stevelin@microsoft.com).
X. Zhang is with College of Mathematics and Information Science, Wen-zhou University, China (E-mail: xqzhang@wzu.edu.cn).
J. Liu is with Cixi Institute of Biomedical Engineering, Ningbo Institute of Materials Technology and Engineering, Chinese Academy of Sciences, China (E-mail: jimmyliu@nimte.ac.cn).
A.F. Frangi is is with CISTIB Centre for Computational Imaging & Sim-ulation Technologies in Biomedicine, Electronic and Electrical Engineering Department, University of Sheffield, UK. (E-mail: a.frangi@sheffield.ac.uk). M. Baskaran is with the Singapore Eye Research Institute and Singapore National Eye Centre and Duke NUS Medical School, Singapore (E-mail: baskaran.mani@seri.com.sg).
T. Aung is with the Singapore Eye Research Institute, and is also with the Department of Ophthalmology, National University of Singapore, Singapore (E-mail: aung.tin@snec.com.sg).
Open angle Angle-closure Co
rne a
Iris
ACA
[image:1.612.311.565.188.253.2]TIA
Fig. 1. The angle-closure glaucoma: open angle and angle-closure. The small anterior chamber angle (ACA) blocks drainage channels of aqueous fluid and results in optic nerve damage.
quality. The two main types of glaucoma are open angle and angle-closure, according to the configuration of the anterior chamber angle (ACA) within the eye, as shown in Fig. 1. Primary angle-closure glaucoma is a major form of glaucoma in Asia [3], in which a narrow ACA between the iris and cornea blocks the drainage channels of aqueous fluid, resulting in rising eye pressure that causes optic nerve damage [4], [5]. Imaging and assessment of the ACA is thus critical for diagnosis of angle-closure glaucoma [6], [7].
Optical Coherence Tomography (OCT) provides a clear view of intraretinal morphology and enables noninvasive depth-resolved functional imaging of the retina [8], [9], which can be widely employed to image macular edema [10], segment retinal layers [11], [12], and detect the optic disc/cup [13], [14]. Anterior Segment Optical Coherence To-mography (AS-OCT) is an effective imaging modality for vi-sually identifying the anterior segment structure [15], [16], by obtaining high-resolution cross-sections of the entire anterior chamber in a single image [17], [18].
TABLE I
SUMMARY OF THE EXISTINGAS-OCTASSESSMENT METHODS.
Method Year Automatic Cornea
Segmentation
Iris Segmenta-tion
Clinical Measurement
Glaucoma Screening
Multiple Modalities
Zhongshan [19] 2008 Semi √ √ √ √ Visante OCT
Tianet al.[20] 2011 √ √ × √ √ HD-OCT
Xuet al.[21] 2012 √ × × × √ √
Williamset al.[22] 2013 √ √ × × × √
Xuet al.[23] 2013 √ × × × √ √
Ni Niet al.[24] 2014 √ √ √ √ √ HD-OCT
Williamset al.[25] 2015 √ √ × × × √
Niwaset al.[26] 2015 × × × √ √ Visante OCT
Fuet al.[27] 2016 √ √ √ × × √
Proposed method 2017 √ √ √ √ √ √
to segment the corneal boundary. However, this method only produces a corneal boundary segmentation without the other ACA structures. Xu et al. localized the ACA region, and then extracted visual features directly to classify the glaucoma subtype [21], [23]. However, that method can only report classification results and cannot provide clinical measurements needed by doctors. A comparison of the existing methods is given in Table I. In summary, common drawbacks among existing AS-OCT assessment methods include the following:
1) Global Segmentation:An AS-OCT image includes the
corneal boundary and iris region, but many existing methods provide only single region segmentation (e.g., Schwalbe’s line [20] or corneal boundary [22], [25]), rather than the global structure segmentation needed for ACA measurement.
2) Clinical Measurement: In the field of medical image
analysis, visual features have been shown to obtain good performance on glaucoma screening [21], [23]. How-ever, clinical parameters defined by anatomic structure are more valuable for medical assessment and clinician validation.
3) Multiple Modalities: The imaging characteristics, as
well as the location and shape of the iris and cornea, can vary significantly among different AS-OCT modalities, as shown in Fig.2. Many existing methods are limited to only a particular type of AS-OCT image (e.g., HD-OCT [20], [24], or Visante OCT [19]), and cannot be applied directly with other types of AS-OCT imagery.
To address these issues, we propose a data-driven approach for AS-OCT structure segmentation and measurement. Our key idea is to introduce an exemplar set containing manually labeled markers on the iris and corneal boundaries, and use it to estimate initial marker locations by transferring from the exemplars most similar to the input. These exemplars include images taken from different patients and AS-OCT modalities. The initially placed markers are then refined using a graph-based smoothing model that accounts for structural information within the AS-OCT image. These refined markers are employed to guide the segmentation of major AS-OCT structures – namely the corneal boundary, iris region, and
Visante AS-OCT
Cirrus HD-OCT
Fig. 2. Different subjects and AS-OCT modalities (e.g., Visante AS-OCT and Cirrus HD-OCT). It is observed that the iris positions and shapes are varied among different patients for the same OCT modality. For different AS-OCT modalities, Cirrus HD-AS-OCT has a clearer corneal boundary and slight noise, but the iris posterior and trabecular-iris contact (TIC) are missed, as indicated by the red arrows.
trabecular-iris contact1 – which are used to calculate clinical parameters based on ocular anatomy. These clinical parameters are finally used for clinician assessment and angle-closure glaucoma screening.
An approach related to our method is multi-atlas segmen-tation [29]–[31], where an atlas dataset is built and pairwise registration is used between the input image and each atlas im-age. After that, these registration results are used to propagate the atlas labels to the input image coordinates. Our method has the following differences to multi-atlas segmentation: 1) our method employs labeled raw images to generate the exemplar dataset, allowing for easy addition of new images into the dataset; 2) our method uses K-nearest neighbor retrieval to replace pairwise registration, providing higher computational efficiency; 3) to our knowledge, our work is the first applica-tion of a data-driven scheme for AS-OCT image analysis.
The proposed approach is fully automatic and encompasses AS-OCT segmentation, measurement and screening. A major advantage is that its data-driven scheme provides robust perfor-mance over the imaging variations among different AS-OCT modalities as well as over various iris shapes among different
1Note that due to low resolution, it has been found that the scleral spur is
...
...
(A) AS-OCT image
(B) Left/Right image (E) Marker Transfer
(C) Exemplar Dataset
(F) Marker Initialization
(G) Marker Refinement (H) Segmentation
ACW IEW LV IA I-Curv TIA ARA ....
(I) Measurement
(J) Clinical Diagnosis
...
(K) Computer Aided Screening
...
[image:3.612.55.557.60.274.2](D) K-nearest neighbors
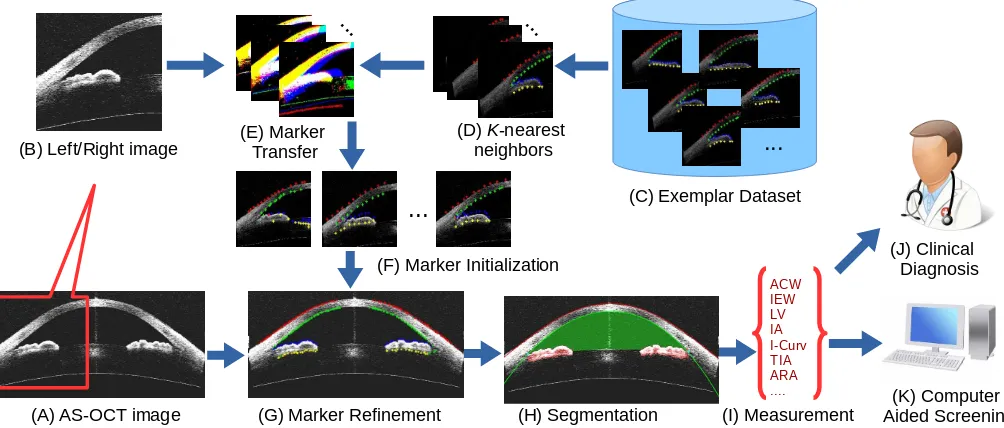
Fig. 3. Flowchart of our proposed method. (A) Given an AS-OCT image, we divide it into (B) left/right images, and retrieve (D) itsK-nearest neighbors from (C) the exemplar dataset. Then (E) marker transfer is employed to obtain (F) the initial markers. After that, (G) these markers are refined and employed to (H) guide the segmentation of major structures. Finally, (I) clinical parameters are measured for (J) clinical diagnosis or (K) automatic angle-closure glaucoma screening.
subjects. Moreover, the measured clinical parameters can be used not only to support clinicians in making anatomical assessments, but also to serve as features for detecting anterior angle closure in automatic glaucoma screening algorithms. Our tests on two clinical AS-OCT datasets demonstrate encourag-ing performance of this method.
II. PROPOSEDMETHOD
As illustrated in Fig. 3, our method proceeds as follows. Given an AS-OCT image, we first retrieve the K-nearest neighbors from the labeled exemplar dataset, and transfer the labels to estimate initial marker locations in the input image. These markers are refined based on a graph-based model that utilizes prior structural information. The refined markers are then used to guide the segmentation of major structures. Finally, clinical parameters are calculated and used to support clinical assessment or automatically detect anterior angle closure for glaucoma screening.
A. Marker Transfer
Our marker transfer approach takes inspiration from the recent success of data-driven techniques that transfer label information from one image to another [32]–[35]. The AS-OCT image is first cropped into left/right images. Then the initial markers are obtained via transfer from the closest matching images in a exemplar dataset, which is composed of various AS-OCT images containing markers labeled man-ually by ophthalmologists. These images span various AS-OCT modalities and patients. In our method, the markers are placed along the ACA boundary, which is separated into four parts, namely the corneal epithelium/endothelium and the upper/lower iris layers, as shown in Fig. 3 (C). The use
of boundary markers for this transfer is motivated by the following: 1) Markers on boundaries are more stable to locate than those within the iris or cornea regions; 2) Boundary alignment is a priority for most registration methods; 3) Manual labeling of boundary markers is much more feasible than completely tracing the boundaries over a large exemplar set; and 4) A set of approximate boundary points provided by the transferred markers is sufficient to initialize the subsequent steps in our algorithm.
From this exemplar dataset, we retrieve the K-nearest neighbors for the left/right image (K = 5 in our imple-mentation) based on the Edge Orientation Histogram (EOH) feature [36], [37]. EOH is calculated based on the Canny edge detector and Sobel masks. The Canny edge detector is used to generate an edge map for the input image, and Sobel masks are employed to calculate five orientation gradients. The input image is divided into4×4non-overlapping rectangular regions, and we calculate the EOH for each region, yielding a feature of4×4×5 = 80dimensions. Then the Euclidean distance is used to calculate the similarity between the input image and the exemplars. Finally, we directly transfer all the retrieved exemplar markers to the input image to serve as the initial markers, as shown in Fig.4 (A).
B. Marker Refinement
Due to inaccuracies in direct marker transfer, some refine-ment of the initial markers is needed. In our work, we employ a graph-based smoothing method, which generates a graph G = hV,Ei with a set of nodes V and edges E. Each node
n ∈ V can take a state un in a discrete space and has an
associated unary energy function Ψ(un). In our work, each
Node: pi
(A) (B)
Node: pi+1 Node: p i+2
[image:4.612.49.300.55.168.2]... ...
Fig. 4. (A): Initial markers of the AS-OCT image after marker transfer, where the red, green, blue, and yellow points denote the markers for the corneal epithelium/endothelium and the upper/lower iris, respectively. (B): A zoom-in region of the AS-OCT image, where each markerpiis represented as a node in the graph, and the vertical pixel candidates centered on initial markerpi(green points) are the states of corresponding nodepi. The refined markers (red points) are optimized by our graph-based processing.
marker pis extracted as the candidate states of the node, as shown in Fig.4(A). The edge(n, m)∈ Econnecting nodesn
andmhas an associated pairwise energy functionΦ(un, um).
The overall objective function of our refinement is as follows:
Eg(u) =
X
n∈V
Ψ(u
n) +
X
(n,m)∈E
Φ(u
n,um). (1)
The configuration of states u = {u
1,· · · ,u|V|} can be obtained by minimizing Eq. (1).
Unary term Ψ(un) reflects the likelihood that a pixel
candidate lies on a boundary, which is defined as
Ψ(un) =Ug(un)·Up(un), (2)
whereUg(un)is the vertical gradient magnitude of candidate un, encouraging the refined point to adhere to a boundary. Up(un)denotes structural prior information, whereUp(un) = 1if the initial markerunis on the corneal epithelium or upper
iris, and Up(un) =−1 otherwise. This term is based on the
observation that from top to bottom in an AS-OCT image, the upper boundaries of the cornea and iris go from dark to bright, and lower boundaries go from bright to dark.
Pairwise term Φ(un, um) provides a spatial smoothness
constraint between neighboring markers, and we define this term as follows:
Φ(un, um) =Ds(un, um)·Df(un, um), (3)
whereDs(un, um)represents a spatial penalty measured as the
vertical coordinate difference between nodes un, um, which
encourages markers to form a smooth layer. AndDf(un, um)
is thel2-norm similarity between the features of nodesun, um,
which are taken simply as the intensity in a5×5region around the candidate.
Our refined markers are thus obtained based on a com-bination of boundary magnitude Ug(·), structural
informa-tion Up(·), spatial smoothness Ds(·,·), and feature
similar-ity Df(·,·) constraints. Eq. 1 can be optimized by using
existing energy minimization methods (e.g., TRW-S [38], A*search [39]) to obtain a good approximate solution.
j
s
Y Z X
W
[image:4.612.313.565.58.149.2](A) (B)
Fig. 5. (A): Regions in the binary image centered on junction j. The trabecular-iris contactsis located at the bottom-left corner of the top-right black regionZ. (B): The AS-OCT image with fitted curves.
C. AS-OCT Structure Segmentation
Based on the localized markers, we segment three major structures of the AS-OCT image: the corneal boundary, iris region, and trabecular-iris contact.
Corneal boundary: The corneal boundary, including the
corneal epithelium and endothelium, can be considered as a smooth curve. To the corresponding refined markers, a fourth order polynomial (also used in [20]) is fit to obtain the corneal boundary, as shown in Fig.5(B).
Iris region:The shape and location of the iris varies among
different AS-OCT images, which makes it difficult to detect using a fixed pattern. With our transferred markers, we can detect the iris region reliably. We first fit two curves to the upper/lower boundary of the iris region based on the markers, as shown by the blue and yellow curves in Fig.5(B). Then we threshold the region between these two curves and obtain the iris areas by selecting the two maximum connecting regions, which determines one endpoint of the iris. The threshold value is set using Otsu’s thresholding method. The other endpoint of the iris is determined by the trabecular-iris contact. In practice, we slightly expand the region between the two iris curves prior to thresholding, to account for iris morphologies such as plateau iris that do not closely fit a curve.
Trabecular-iris contact (TIC):The trabecular-iris contact
is the key biomarker in the AS-OCT image, as it is used to localize the ACA position and iris endpoint. In our method, we first calculate the junction of the fitted corneal endothelium and upper iris curve, and crop a region of interest (ROI) of size 200×200centered on the calculated junction. Then, we thresh-old this ROI using the same threshthresh-olding value as in the iris region segmentation, and perform morphological operations (dilation and erosion) to remove isolated noise pixels. After that, the ROI region can be divided into four major connecting regions as shown in Fig.5(A). The trabecular-iris contactsis located at the bottom-left corner of the top-right black region (region Z in Fig.5 (A)).
D. Clinical Parameter Measurement
ACW IEW
LV AC-Area
TIA
s
I-Curv
IT AOD
m
CH
(A) (B)
Fig. 6. The clinical parameters of AS-OCT. (A) Global AS-OCT parameters. AC-Area: Anterior Chamber Area. IEW: Iris Endpoint Width. LV: Lens-Vault. ACW: Anterior Chamber Width. CH: Chamber Height. (B) Local angle parameters, where pointsdenotes the Trabecular-iris contact, andmis the angle opening distances. TIA: Trabecular Iris Angle. AOD: Angle Opening Distance. IT: Iris Thickness. I-Curv: Iris Curvature.
1) Anterior Chamber Width (ACW): distance between
the two TIC points, along the blue line in Fig.6 (A).
2) Iris Endpoint Width (IEW):shortest distance between
the two iris endpoints, along the green line in Fig.6(A).
3) Lens-Vault (LV): perpendicular distance between the
anterior pole of the lens and the horizontal line joining the two TIC points [41], along the red line in Fig.6(A).
4) Chamber Height (CH):perpendicular distance between
the anterior chamber and the horizontal line joining the two TIC points, as the yellow line in Fig.6 (A).
5) Chamber Height Ratio (CHR):the ratio of Chamber
Height to Lens-Vault.
6) Anterior Chamber Area (AC-Area): cross-sectional
area of the anterior segment bounded by the endothe-lium, iris, and anterior surface of the lens, shown as the blue shaded region in Fig.6 (A).
7) Anterior Chamber Volume (AC-Vol): calculated by
rotating the ACA360◦ around its central vertical axis.
8) Iris Area (IA): cumulative cross-sectional area along
the full length of the iris, shown as the red shaded region in Fig.6(B).
9) Iris Curvature (I-Curv):calculated by drawing a line
from the most peripheral to the most central points of the iris pigment epithelium, extending a perpendicular line to the iris pigment epithelium at its point of greatest convexity, and taking the length of this line [5], indicated by the green line in Fig.6 (B).
10) Trabecular Iris Angle (TIA):angle at the apex of the
iris recess defined between lines extending through a point on the trabecular meshwork at a distancemfrom the TIC point, shown as the orange angle in Fig.6(B).
11) Angle Opening Distance (AOD): length of the line
segment between the cornea and iris at distancem, along the red line in Fig.6 (B).
12) Angle Recess Area (ARA):area bounded by the AOD
line, corneal endothelium and the iris.
13) Iris Thickness (IT): thickness of the iris at a distance
mfrom the TIC, along the blue line in Fig.6 (B).
Parameters 1-7 are global AS-OCT parameters of dimension1, and 8-9 are local angular parameters of dimension 1. Parame-ters 10-13 are also local angular parameParame-ters but with different angle opening distances (m = {750,1000,1200}µm), as shown in Fig. 6 (B), thus each of them has |m| dimensions
TABLE II
ERROR SCORES(UNIT:PIXEL)IN PIXELS FOR DIFFERENT STEPS OF OUR METHOD. IE:IRIS ENDPOINT. 1 PIXEL≈0.016MM
TIC Err. IE Err. ACW Err. IEW Err. Baseline [20] 14.45 - 18.69 -Transfer 21.26 24.91 23.26 37.38 Fitted curve 12.94 18.41 17.51 9.61 Final result 10.47 5.16 12.87 6.51
for each angle.
III. EXPERIMENTS
A. Segmentation Evaluation
The first experiment is for evaluating segmentation. In our experiments, the AS-OCT images (from a Carl Zeiss Visante AS-OCT) are centered on the pupil, and one cross-sectional horizontal scan (nasal-temporal angles at0◦-180◦) is evaluated for each subject. We collected 100 Visante AS-OCT images, where the TIC points and iris endpoints are labeled manually as the ground truth, and ACW and IEW are calculated from them. We evaluate our method on this dataset and measure the following four error scores: point distances for TIC and iris endpoint, and the absolute width for ACW and IEW.
We report the results of our method, including at two intermediate steps. The first result is determined after the marker transfer step, using the initial markers directly. The second result is from points computed by fitting a curve to the refined markers. The last is our final result with all refinement and segmentation steps. We additionally report results of the TIC detection method [20] as a baseline. The TIC method [20] is highly dependent on detecting the feature change along the lower boundary of the cornea in an HD-OCT image, which is hard to observe in a low resolution OCT (e.g., Visante OCT). Thus in our implementation we extract the HOG feature within small windows (50×50) along the corneal boundary to detect the feature change and localize the TIC point. Note that the TIC method [20] does not segment the iris region, thus only comparisons to TIC and ACW scores can be done. The performance scores are shown in Table II. Due to the low resolution of the Visante OCT image, the feature change is slight and the TIC is hard to detect by using [20]. Its performance is only better than the initial marker transfer of our method. In our method, the result of marker transfer is rough and has large error. The marker refinement step deals with outliers and improves performance by using fitted curves. Our final result obtains the best performance on all point localizations and measurements. Some visual results of our method are shown in Fig.7. Our method segments the corneal boundary, iris region, and TIC accurately for different ACA shapes and positions in the AS-OCT images.
B. Screening Evaluation
Visante AS-OCT Cirrus HD-OCT
Fig. 7. Segmentation results of our proposed method on Visante AS-OCT and Cirrus HD-OCT images, where the corneal boundaries are marked by red and blue curves, and the iris and anterior chamber regions are indicated by red and green shading, respectively. (Note that the pale blue colors of Cirrus HD-OCT images, also seen in Fig.2, are generated by the Cirrus machine, not by our method.)
sub-images (8270 ACA sub-images in total), since each image contains two ACA regions and the right ACA sub-image is flipped horizontally. For each ACA sub-image, the ground truth label of open-angle or angle-closure is determined by majority from three ophthalmologists. The data contains 7375 open-angle and 895 angle-closure cases. The dataset is divided equally and randomly into training and testing sets.
We repeat each algorithm 50 times and report the mean and standard deviations. We employ five evaluation criteria to measure the performance: Balanced Accuracy, Sensitivity, Specificity, Precision and F-measure. The Sensitivity (Sen), Specificity (Spe), and Precision (P re) are defined as:
Sen= T P
T P +F N, Spe=
T N
T N+F P, P re=
T P
T P +F P,
where T P andT N denote the number of true positives and true negatives, respectively, and F P and F N denote the number of false positives and false negatives, respectively. The F-measure (Fm) and Balanced Accuracy (BAcc) are as
follows:
Fm=
2T P
2T P +F P+F N, BAcc=
1
2(Sen+Spe).
We additionally report the ROC curves and area under ROC curve (AUC).
Our evaluation utilizes five classification algorithms for the detection of gonioscopic angle closure, including k-Nearest Neighbor, Naive Bayes, Random Forest, AdaBoost, and Linear SVM. The performances are reported in TableIIIand Fig.8(a). k-Nearest Neighbor (kNN) is a non-parametric method based on the k closest training examples in the feature space, with the prediction set to the most common label among the k
nearest neighbors (k = 5 in our experiment). Naive Bayes classification estimates the probability based on applying Bayes’ theorem under the assumption that the covariates are independent and conditional on class membership. From the results, we observe that k-Nearest Neighbor and Naive Bayes do not perform well on our Visante AS-OCT dataset. Random Forests and AdaBoost are both ensemble learning methods, where Random Forests is bagging algorithm and AdaBoost is
a boosting algorithm. We set the tree numbers to 50 in our experiment. These two classifiers obtain similar performance on the AS-OCT classification task. The last classifier is Linear SVM, which constructs a hyperplane or a set of hyperplanes in a higher dimensional space to separate feature points. Linear SVM achieves the best scores in this experiment.
C. Performance with Visual Features
In this experiment, we examine the use of visual features instead of clinical parameters for glaucoma classification. In [21], the ACA region is localized based on geometric struc-ture, and then visual features (e.g., HOG [42]) are extracted to classify the glaucoma subtype. In our implementation, we use the TIC obtained by our method as the center of the ACA region, and follow [21] by using HOG features to classify the glaucoma subtype on the Visante AS-OCT dataset. The results are shown in TableIVand Fig.8(b). Our visual feature classification (VF) outperforms the original method in [21], which reports a 0.835 AUC and a0.758 Balanced Accuracy for ACA images. We also found that classification with visual features (VF) is better than with just clinical parameters (CP). The more fundamental reason is that clinical parameter have already a prior on what information clinicians currently use, while visual features identify a wider set of image properties some of which are unrelated with what clinicians seem to recognize as relevant. Hence, visual feature have more image information, and more discriminative capacity than clinical parameters. Clinical parameters are nevertheless important to recover for clinical assessment. Combining the two types of features (CP + VF) produces the best performance on the Visante AS-OCT dataset. Moreover, our results are comparable to those of Niwaset al.[26], which achieves0.866 Accuracy by using a Laplacian score feature selection method. Note that the ACA measurements used in [26] are measured manually, so it is not an automatic method.
D. Multiple Modality Evaluation
TABLE III
PERFORMANCES(M ean±Std)OF DIFFERENT CLASSIFIERS USING CLINICAL MEASUREMENTS ON THEVISANTEAS-OCTDATASET. Balanced Accuracy Sensitivity Specificity Precision F-measure
k-Nearest Neighbor 0.770±0.019 0.740±0.071 0.800±0.037 0.462±0.073 0.528±0.031 Naive Bayes 0.786±0.013 0.722±0.031 0.850±0.019 0.377±0.033 0.494±0.027 Random Forest 0.814±0.014 0.774±0.034 0.855±0.012 0.401±0.016 0.526±0.022 AdaBoost 0.812±0.014 0.773±0.033 0.850±0.014 0.392±0.027 0.519±0.024 Linear SVM 0.828±0.010 0.807±0.024 0.851±0.013 0.402±0.028 0.536±0.023
False positive rate
0 0.2 0.4 0.6 0.8 1
Tru
e
po
si
tive
ra
te
0 0.1 0.2 0.3 0.4 0.5 0.6 0.7 0.8 0.9 1
kNN (AUC=0.8451) Naive Bayes (AUC=0.8626) Random Forest (AUC=0.8872) AdaBoost (AUC=0.8926) Linear SVM (AUC=0.9047)
(a)
False positive rate
0 0.2 0.4 0.6 0.8 1
Tru
e
po
si
tive
ra
te
0 0.1 0.2 0.3 0.4 0.5 0.6 0.7 0.8 0.9 1
CP (AUC=0.8926) VF (AUC=0.9106) CP+VF (AUC=0.9163)
(b)
False positive rate
0 0.2 0.4 0.6 0.8 1
Tru
e
po
si
tive
ra
te
0 0.1 0.2 0.3 0.4 0.5 0.6 0.7 0.8 0.9 1
CP (AUC=0.8616) VF (AUC=0.8727) CP+VF (AUC=0.885)
(c)
Fig. 8. (A) Performances of different classifiers on the Visante AS-OCT dataset. (B) Performances of Clinical Parameter (CP) and Visual Feature (VF) on the Visante AS-OCT dataset. (C) Performances of CP and VF on the Cirrus HD-OCT dataset.
TABLE IV
PERFORMANCES(M ean±Std)OF DIFFERENT FEATURES WITHLINEARSVMONVISANTEAS-OCTDATASET. Balanced Accuracy Sensitivity Specificity Precision F-measure Clinical Parameter 0.830±0.011 0.810±0.024 0.850±0.012 0.410±0.024 0.553±0.020 Visual Feature 0.860±0.011 0.869±0.032 0.851±0.017 0.423±0.030 0.581±0.022 Combination 0.872±0.018 0.886±0.037 0.862±0.019 0.438±0.032 0.610±0.024
test our method on another modality, Zeiss Cirrus HD-OCT. Some visual segmentation results are shown in Fig. 7. It can be seen from the figure that the image structure for Cirrus HD-OCT is different from that of Visante AS-OCT. In Cirrus HD-OCT, post-processing is done during AS-OCT imaging, which makes the corneal boundary clearer. However, the iris posterior and the contact point of iris and cornea are not obvious, as shown in Fig.2. Because of the data-driven marker localization, our method performs well and is robust for Cirrus HD-OCT.
For quantitative evaluation, we collected a Cirrus HD-OCT dataset, with 1402 ACA images in total (1102 open-angle and 300 angle-closure). The performances are shown in Table V
and Fig. 8(c). Results using the feature combination (CP + VF) were found to be best. Note that due to the missing iris posterior and contact point of the iris and cornea, the scores for Cirrus HD-OCT are lower than those for Visante AS-OCT.
E. Discussion
[image:7.612.312.565.416.507.2]1) Exemplar Dataset: In our method, we utilize the same exemplar dataset directly for different OCT machines. This is based on the observation that the relative positions of the cornea and iris are roughly consistent in different AS-OCT images after image normalization. For dividing the image into left/right images, we crop the image by tightening the ACA
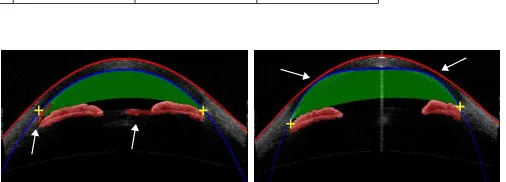
Fig. 9. Challenging cases for our segmentation method.
region to remove the excess margin and resize the cropped image to the same size as the exemplar. In this paper, we collect more than 20000 ACA images from Visante AS-OCT and use K-means to cluster them into 50 groups. The image of each cluster center is selected as an exemplar in the exemplar dataset. This exemplar data is utilized in both the Visante and Cirrus AS-OCT experiments.
2) Running Time: We run our method using a workstation with a Xeon 2.7GHz CPU and 64GB RAM. The code is im-plemented without optimizations in MATLAB 2014 (Natick, MA). Typically, our method takes less than 10 s for segmenting and measuring one AS-OCT image.
TABLE V
PERFORMANCES(M ean±Std)OF DIFFERENT FEATURES WITHLINEARSVMON THECIRRUSHD-OCTDATASET. Balanced Accuracy Specificity Sensitivity Precision F-measure Clinical Parameter 0.779±0.029 0.850±0.039 0.708±0.063 0.527±0.074 0.599±0.048 Visual Feature 0.796±0.031 0.851±0.032 0.742±0.053 0.536±0.067 0.620±0.053 Combination 0.802±0.026 0.850±0.032 0.753±0.044 0.541±0.063 0.627±0.045
may lead to distortions of the iris shape, as shown in the first image of Fig. 9. This is a failure case for our method that is also a challenge for other segmentation methods and even ophthalmologists. Another challenging case is low contrast, which may lead to mis-segmentation as shown for the corneal boundary in the second image of Fig. 9.
4) Comparison: We compare the existing AS-OCT assess-ment methods with our method in TableVI. The work in [20] only deals with segmentation and detection, without provid-ing glaucoma screenprovid-ing results. The method in [24] obtains outstanding performance with fuzzy kNN classification, but works only on the Casia SS-1000 OCT modality, which is a high-definition (HD) mode of SS-OCT imaging, and has been evaluated on just a small data size. Xu’s methods in [21], [23] employ different visual features to classify angle-closure glaucoma, but they cannot produce clinical measurements. Our work is evaluated on two OCT modalities, Visante AS-OCT and Cirrus HD-AS-OCT, and the data sizes are the largest in each AS-OCT modality. Our method also achieves satisfactory performance.
IV. CONCLUSION
In this paper, we proposed an automatic anterior chamber angle segmentation and measurement method for AS-OCT imagery. The key contributions of this work are the introduc-tion of marker transfer from labeled exemplars to generate initial markers, and segmentation of the corneal boundary and iris regions to obtain clinical ACA measurements. The experiments on both the Visante AS-OCT and Cirrus HD-OCT datasets demonstrate the effectiveness and robustness of our method. Potential applications of our proposed method in-clude clinical anatomical assessment, automatic angle-closure glaucoma screening, and statistical analysis of large clinical datasets.
REFERENCES
[1] H. Quigley and A. Broman, “The number of people with glaucoma worldwide in 2010 and 2020,”Br. J. Ophthalmol., vol. 90, no. 3, pp. 262–267, 2006.
[2] Y.-C. Tham, X. Li, T. Y. Wong, H. A. Quigley, T. Aung, and C.-Y. Cheng, “Global prevalence of glaucoma and projections of glaucoma burden through 2040: A systematic review and meta-analysis,” Oph-thalmology, vol. 121, no. 11, pp. 2081 – 2090, 2014.
[3] P. Foster and G. Johnson, “Glaucoma in china: how big is the problem?” Br. J. Ophthalmol., vol. 85, no. 11, p. 12771282, 2001.
[4] S. Salim, “The role of anterior segment optical coherence tomography in glaucoma,”Journal of Ophthalmology, pp. 1–9, 2012.
[5] M. Nongpiur, B. Haaland, D. Friedman, S. Perera, M. He, L. Foo, M. Baskaran, L. Sakata, T. Wong, and T. Aung, “Classification al-gorithms based on anterior segment optical coherence tomography measurements for detection of angle closure,”Ophthalmology, vol. 120, no. 1, pp. 48–54, 2013.
[6] C. Leung and R. Weinreb, “Anterior chamber angle imaging with optical coherence tomography,”Eye, vol. 25, no. 3, pp. 261–267, 2011.
[7] I. Lai, H. Mak, G. Lai, M. Yu, D. Lam, and C. Leung, “Anterior chamber angle imaging with swept-source optical coherence tomography: Mea-suring peripheral anterior synechia in glaucoma,” Ophthalmology, vol. 120, no. 6, pp. 1144–1149, 2013.
[8] W. Drexler and J. Fujimoto, “State-of-the-art retinal optical coherence tomography,” Progress in retinal and eye research, vol. 27, no. 1, pp. 45–88, 2008.
[9] J. Fujimoto and D. Huang, “Foreword: 25 years of optical coherence tomography,” Investigative Ophthalmology & Visual Science, vol. 57, no. 9, pp. OCTi–OCTii, 2016.
[10] Y. Ikuno, K. Sayanagi, T. Oshima, F. Gomi, S. Kusaka, M. Kamei, M. Ohji, T. Fujikado, and Y. Tano, “Optical coherence tomographic findings of macular holes and retinal detachment after vitrectomy in highly myopic eyes,” American Journal of Ophthalmology, vol. 136, no. 3, pp. 477–481, 2003.
[11] A. Bagci, M. Shahidi, R. Ansari, and M. Blair, “Thickness profiles of retinal layers by optical coherence tomography image segmentation,” American Journal of Ophthalmology, vol. 146, no. 5, pp. 679–687, 2008. [12] M. K. Garvin, M. D. Abr`amoff, X. Wu, S. R. Russell, T. L. Burns, and M. Sonka, “Automated 3-D intraretinal layer segmentation of macular spectral-domain optical coherence tomography images,”IEEE Transactions on Medical Imaging, vol. 28, no. 9, pp. 1436–1447, 2009. [13] K. Lee, M. Niemeijer, M. K. Garvin, Y. Kwon, M. Sonka, and M. Abr`amoff, “Segmentation of the optic disc in 3-D OCT scans of the optic nerve head,”IEEE Transactions on Medical Imaging, vol. 29, no. 1, pp. 159–168, 2010.
[14] H. Fu, D. Xu, S. Lin, D. W. K. Wong, and J. Liu, “Automatic Optic Disc Detection in OCT Slices via Low-Rank Reconstruction,” IEEE Transactions on Biomedical Engineering, vol. 62, no. 4, pp. 1151–1158, 2015.
[15] J. L. Ramos, Y. Li, and D. Huang, “Clinical and research applications of anterior segment optical coherence tomography - a review,”Clinical & Experimental Ophthalmology, vol. 37, no. 1, pp. 81–89, 2009. [16] R. Sharma, A. Sharma, T. Arora, S. Sharma, A. Sobti, B. Jha,
N. Chaturvedi, and T. Dada, “Application of anterior segment optical coherence tomography in glaucoma,”Survey of Ophthalmology, vol. 59, no. 3, pp. 311–327, 2014.
[17] R. S, H. D, and S. SD., “Optical coherence tomography imaging of the anterior chamber angle,”Ophthalmol Clin North Am, vol. 18, no. 3, pp. 375–81, 2005.
[18] Y. Xu, L. Duan, H. Fu, X. Zhang, D. Wong, B. Mani, T. Aung, and J. Liu, “Axial Alignment for Anterior Segment Swept Source Optical Coherence Tomography via Robust Low-rank Tensor Recovery,” in MICCAI, 2016, pp. 441–449.
[19] J. Console, L. Sakata, T. Aung, D. Friedman, and M. He, “Quantitative analysis of anterior segment optical coherence tomography images: the zhongshan angle assessment program,” Br. J. Ophthalmol., vol. 92, no. 12, pp. 1612–1616, 2008.
[20] J. Tian, P. Marziliano, M. Baskaran, H. Wong, and T. Aung, “Automatic anterior chamber angle assessment for HD-OCT images,”IEEE Trans-actions on Biomedical Engineering, vol. 58, no. 11, pp. 3242–3249, 2011.
[21] Y. Xu, J. Liu, N. Tan, B. Lee, D. Wong, M. Baskaran, S. Perera, and T. Aung, “Anterior chamber angle classification using multiscale histograms of oriented gradients for glaucoma subtype identification,” inEMBC, 2012, pp. 3167–3170.
[22] D. Williams, Y. Zheng, F. Bao, and A. Elsheikh, “Automatic segmenta-tion of anterior segment optical coherence tomography images,”Journal of Biomedical Optics, vol. 18, no. 5, pp. 1–7, 2013.
[23] Y. Xu, J. Liu, J. Cheng, B. Lee, D. Wong, M. Baskaran, S. Perera, and T. Aung, “Automated anterior chamber angle localization and glaucoma type classification in OCT images,” inEMBC, 2013, pp. 7380–7383. [24] S. Ni Ni, J. Tian, P. Marziliano, and H. Wong, “Anterior Chamber Angle
TABLE VI
ACOMPARISON OF THE EXISTINGAS-OCTASSESSMENT METHODS. CP:CLINICAL PARAMETER, VF:VISUAL FEATURE. DATA SIZE:THE NUMBER OF ACASUB-IMAGES.
Method Image Modality Data Size Feature Classifier Performance
Tianet al.[20] Cirrus HD-OCT 40 CP -
-Xuet al.[21] Visante AS-OCT 4096 VF (HOG) Linear SVM AUC= 0.835, BAcc= 0.758 Xuet al.[23] Visante AS-OCT 4096 VF (HEP) Linear SVM AUC= 0.921, BAcc= 0.840 Ni Niet al.[24] Casia SS-1000 OCT 264 CP + VF (Shape) fuzzy kNN AUC = 0.98, BAcc = 0.99 Our method Visante AS-OCT 8270 CP + VF (HOG) Linear SVM AUC = 0.916, BAcc = 0.872 Our method Cirrus HD-OCT 1406 CP + VF (HOG) Linear SVM AUC = 0.885, BAcc = 0.802
[25] D. Williams, Y. Zheng, F. Bao, and A. Elsheikh, “Fast segmentation of anterior segment optical coherence tomography images using graph cut,”Eye and Vision, vol. 2, pp. 1–6, 2015.
[26] S. Niwas, W. Lin, C. Kwoh, J. Kuo, M. Aquino, C. Sng, and P. Chew, “Cross-examination for angle-closure glaucoma feature detection,”IEEE J. Biomed. Health Inform., vol. 20, no. 1, pp. 343–354, 2016. [27] H. Fu, Y. Xu, D. Wong, J. Liu, M. Baskaran, S. Perera, and T. Aung,
“Automatic Anterior Chamber Angle Structure Segmentation in AS-OCT Image based on Label Transfer,” inEMBC, 2016, pp. 1288–1291. [28] L. Sakata, R. Lavanya, D. Friedman, H. Aung, S. Seah, P. Foster, and T. Aung, “Assessment of the scleral spur in anterior segment optical coherence tomography images,”Archives of ophthalmology, vol. 126, no. 2, pp. 181–185, 2008.
[29] P. Aljabar, R. Heckemann, A. Hammers, J. Hajnal, and D. Rueckert, “Multi-atlas based segmentation of brain images: Atlas selection and its effect on accuracy,”NeuroImage, vol. 46, no. 3, pp. 726–738, 2009. [30] H. Wang, J. W. Suh, S. R. Das, J. B. Pluta, C. Craige, and P. A.
Yushkevich, “Multi-atlas segmentation with joint label fusion,”IEEE Transactions on Pattern Analysis and Machine Intelligence, vol. 35, no. 3, pp. 611–623, 2013.
[31] J. E. Iglesias and M. R. Sabuncu, “Multi-atlas segmentation of biomed-ical images: A survey,”Medical Image Analysis, vol. 24, no. 1, pp. 205–219, 2015.
[32] J. Hays and A. A. Efros, “Scene completion using millions of pho-tographs,”ACM Trans. Graph., vol. 26, no. 3, 2007.
[33] C. Liu, J. Yuen, and A. Torralba, “Nonparametric scene parsing via label transfer,” IEEE Transactions on Pattern Analysis and Machine Intelligence, vol. 33, no. 12, pp. 2368–2382, 2011.
[34] M. Guillaumin, D. K¨uttel, and V. Ferrari, “Imagenet auto-annotation with segmentation propagation,” International Journal of Computer Vision, vol. 110, no. 3, pp. 328–348, 2014.
[35] X. Cao, C. Zhang, H. Fu, X. Guo, and Q. Tian, “Saliency-aware nonparametric foreground annotation based on weakly labeled data,” IEEE Transactions on Neural Networks and Learning Systems, vol. 27, no. 6, pp. 1253–1265, 2016.
[36] B. Alefs, G. Eschemann, H. Ramoser, and C. Beleznai, “Road sign detection from edge orientation histograms,” inIEEE Intelligent Vehicles Symposium, 2007, pp. 993–998.
[37] R. Ulloa, “Recognition between baroque and renaissance style of classic paintings,”Technical Report, 2012.
[38] V. Kolmogorov, “Convergent tree-reweighted message passing for en-ergy minimization,”IEEE Transactions on Pattern Analysis and Machine Intelligence, vol. 28, no. 10, pp. 1568–1583, 2006.
[39] M. Bergtholdt, J. Kappes, S. Schmidt, and C. Schn¨orr, “A Study of Parts-Based Object Class Detection Using Complete Graphs,”International Journal of Computer Vision, vol. 87, no. 1, pp. 93–117, 2010. [40] R. Wu, M. Nongpiur, M. He, L. Sakata, D. Friedman, Y. Chan,
R. Lavanya, T. Wong, and T. Aung, “Association of narrow angles with anterior chamber area and volume measured with anterior-segment optical coherence tomography,”Arch. Ophthalmol., vol. 129, no. 5, pp. 569–574, 2011.
[41] G. Tan, M. He, W. Zhao, L. Sakata, J. Li, M. Nongpiur, R. Lavanya, D. Friedman, and T. Aung, “Determinants of Lens Vault and Association With Narrow Angles in Patients From Singapore,”American Journal of Ophthalmology, vol. 154, no. 1, pp. 39–46, 2012.