Theme 2
Economy and finance
Seríes Β
Shortterm trends
ISSN 10110844
ECU-EMS information
2 D 1990
Monthly
INFLATION MEASURED IN ECU IN 1989 IN THE COMMUNITY : + 5.3%.
In 1989 both the Peseta and the Lira appreciated
in value against the ecu in spite of the relatively
high rates of inflation (prices rose by + 6.8% in
Spain and + 6.2% in Italy).
In 1989, inflation was therefore slightly higher
when measured in ecu (1) than when measured
in national currencies (1), i.e. prices rose +5.3%
in ecu as against + 5 . 1 % in national currencies
for all the twelve countries of the Community.
Since October 1989, the average inflation rate in
ecu has been appreciably higher in the countries
participating in the exchange rate mechanism
than in the Community as a whole. This can be
explained by the fact that since October 1989 the
data for Spain have been taken into account
when calculating the EMS indices for this bulletin
and by the substantial drop in the value of the
Pound Sterling relative to the ecu (11.4% from
December 1988 to December 1989), which more
than offset the effects of the fairly high inflation
rate in the United Kingdom.
The figures given for the EMS and ECU indices
for inflation in this issue of the bulletin differ
slightly from those published previously. These
revised figures are the result of work carried out
as part of the programme for updating the series
published in this bulletin, which started some
months ago and will soon include the publication
of a detailed methodology accompanied by retro
spective series.
On the ecuissues market, January saw the float
ing of a loan of ecus 500 million at 10% over 7
years by the EIB. This offer has been widely sub
scribed to, on terms linked to the yield in ecu of
the Government Bonds (OAT) issued by the
French Treasury (+0.15%).
As regards loans linked to the ecu, attention may
be drawn, for information, to two private loans is
sued in December 1989: one by Christiania
Bank (ecus 20 million over 5 years at 40 points
below the 3month LIBOR) and the other by
Skopbank (ecus 85 million over 3 years at 32
points below the 3month LIBOR), and to an
issue of $US 200 million for 1 year for Swedish
Export Credit, repayable on 18 January 1991 in
$ or ecu as the subscriber prefers, at a fixed rate
of $ 1 =ecu 1.15.
Finally, since 1 January 1990, the ecu has re
placed the dollar for the invoicing and payment
of airnavigation fees in the 14 countries affil
iated to Eurocontrol (2). This means that the
fees for the 5 million flights per year made by the
entire world's airlines in the airspace of these 14
countries are now invoiced and payable in ecu.
This will represent some 1400 million ecus in
1990.
(1) Cf. explanatory notes, pp. 9 and 10.
eurostat
OFICINA ESTADÍSTICA DE LAS COMUNIDADES EUROPEAS DE EUROPÆISKE FÆLLESSKABERS STATISTISKE KONTOR STATISTISCHES AMT DER EUROPÄISCHEN GEMEINSCHAFTEN ΣΤΑΤΙΣΤΙΚΗ ΥΠΗΡΕΣΙΑ ΤΩΝ ΕΥΡΩΠΑΪΚΩΝ ΚΟΙΝΟΤΗΤΩΝ STATISTICAL OFFICE OF THE EUROPEAN COMMUNITIES OFFICE STATISTIQUE DES COMMUNAUTÉS EUROPÉENNES ISTITUTO STATISTICO DELLE COMUNITÀ EUROPEE
BUREAU VOOR DE STATISTIEK DER EUROPESE GEMEENSCHAPPEN SERVIÇO DE ESTATÍSTICA DAS COMUNIDADES EUROPEIAS
L2920 Luxembourg Tél. 43011 Télex : Comeur Lu 3423
B1049 Bruxelles, bâtiment Berlaymont, rue de la Loi 200 (bureau de liaison) Tél. 2351111
Note
For any
TEL:
FAX:
information on
43014785
43013288
43014770
43014150
the statistics in this bulletin
T. MATHISSE
G. THOUVENIN
S. ANSION
contact Luxembourg:
Contents
I.
A graph of the bilateral fluctuations of the EMS currencies.
II. Yearly and monthly issues of ecu bonds.
ΙΠ. Interest rates on ecu deposits and yields on ecu bonds.
IV. Latest month's ecu bond issues.
V. Consumer price indices in national currencies.
VI. Consumer price indices in ecus.
VII. Yearly, monthly and daily ecu exchange rates.
ECSCEECEAEC, Brussels · Luxembourg, 1990
Reproduction is authorized, except for commercial purposes, provided the source is acknowledged.
TABLE I
BILATERAL FLUCTUATIONS OF THE ERM CURRENCIES
—0.5
- 1
- 1 . 5
- 2 · ·
- 2 . 5 -
- 3
IRL
FBL.
FBL
ι ι ι ι ι ι ι ι ι ι ι ι ι ι ι ι ι ι ι ι ι ι
01 05 07 11 13 15 19 21 27 29 03 05 08 10 12 16 18 22 24 26 30
December 89
January 90
CENTRAL RATES AND INTERVENTION LIMIT RATES, IN FORCE SINCE 8 JANUARY 1990, FOR
THE CURRENCIES OF COUNTRIES PARTICIPATING IN THE EMS EXCHANGE MECHANISM.
100 BLF
100 DKR
100 DM
100 FF
100
HFL
1
IRL
1000 LIT
100
PTA
1EÇU
+
= ...
+
—
.
+
SE
+
= ..
.
+
SB
+
= ..,
+
ss.
+
= ...
BLF
100
553.000 540.723
528.700 2109.50 2062.55 2016.55
628.970
614.977 601.295 1872.15 1830.54 1789.85
56.5115 55.2545 54.0250
28.1930
27.5661 26.9530 33.6930 31.7316 29.8850
42.1679
DKR
18.914318.4938
18.0831
100
390.160 381.443
373.000 116.320
113.732 111.200 346.240 338.537
331.020 10.4511
10.2186 9.99130 5.21400
5.09803 4.98500 6.23100 5.86837 5.52600
7.79845
DM
4.959004.84837
4.74000 26.8100 26.2162 25.6300
100
30.4950
29.8164 29.1500 90.7700 88.7526 86.7800
2.74000 2.67894 2.61900
1.36700
1.33651 1.30650 1.63300 1.53847 1.44900
2.04446
FF
16.631016.2608
15.8990 89.9250 87.9257 85.9700
343.050 335.386 327.920
100
304.440 297.661
291.040 9.18900
8.98480 8.78500
4.58450 4.48247
4.38300 5.47850 5.15981 4.85950
6.85684
HFL
5.587005.46286
5.34150 30.2100 29.5389 28.8825
115.2350 112.6730 110.1675 34.3600
33.5953 32.8475
100
3.08700
3.01848 2.95100
1.54000 1.50590 1.47250 1.84050
1.73345 1.63250
2.303580
IRL
1.851001.80981
1.76950 10.0087 9.78604 9.56830
38.1825 37.3281 36.4964 11.3830
11.1299 10.8825
33.8868 33.1293
32.3939
1
0.510246 0.498895 0.487799 0.609772
0.574281 0.540858
0.763159
LIT
3710.203627.64
3546.90 20062.0 19615.4 19179.0
76540.0 74821.7
73157.0 22817.0
22309.1 21813.0 67912.0 66405.3 64928.0 2050.03
2004.43 1959.84
1000
1222.30 1151.11
1084.10 1529.70
PTA
334.619315.143
296.802 1809.40 1704.05
1604.90 6901.70 6500.00
6121.70 2057.80
1938.06 1825.30
6125.30 5768.83 5433.10
184.892 174.131 163.997
92.2400 86.6726 81.8200
100
132.889
[image:3.595.65.539.56.445.2]TABLE II
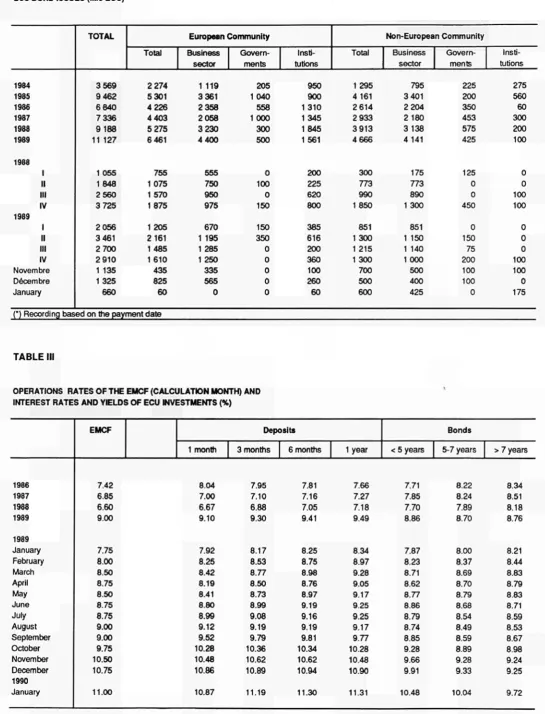
ECU BOND ISSUES (Mio ECU) '
1984 1985 1986 1987 1988 1989
1988
1989
1 II III IV
1
II III IV
Novembre Décembre January
TOTAL
3 569 9 462 6840 7336 9188 11 127
1 055 1848 2560 3 725
2 056 3 461 2 700 2 910 1 135 1325
660
European Community
Total
2 274 5 301 4 226 4403 5 275 6 461
755 1075 1 570 1875
1 205 2161 1485 1610 435 825 60
Business sector
1 119 3 361 2358 2058 3 230 4400
555 750 950 975
670 1 195 1 285 1 250 335 565 0
Govern-ments
205 1 040
558 1000 300 500
0 100 0 150
150 350 0 0 0 0 0
Insti-tutions
950 900 1 310 1 345 1845 1561
200 225 620 800
385 616 200 360 100 260 60
Non-European Community Total
1 295 4 161 2 614 2 933 3 913 4666
300 773 990 1 850
851 1 300 1 215 1 300 700 500 600
Business sector
795 3 401 2204 2 180 3 138 4 141
175 773 890 1 300
851 1 150 1 140 1000
500 400 425
Govern-ments
225 200 350 453 575 425
125 0 0 450
0 150 75 200 100 100 0
Insti-tutions
275 560 60 300 200 100
0 0 100 100
0 0 0 100 100 0 175
[image:4.595.42.571.91.798.2](*) Recording based on the payment date
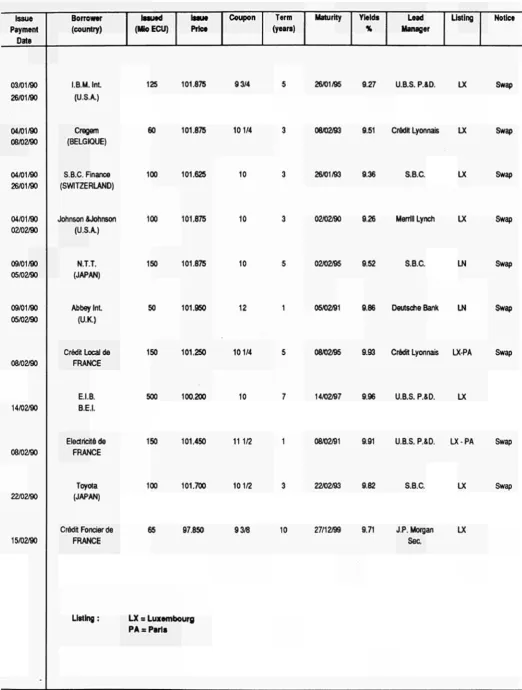
TABLE III
OPERATIONS RATES OF THE EMCF (CALCULATION MONTH) AND INTEREST RATES AND YIELDS OF ECU INVESTMENTS (%)
1986 1987 1988 1989
1989 January February March April May June July August September October November December 1990 January
EMCF Deposits
1 month
7.42 8.04 6.85 7.00 6.60 6.67 9.00 9.10
7.75 7.92 8.00 8.25 8.50 8.42 8.75 8.19 8.50 8.41 8.75 8.80 8.75 8.99 9.00 9.12 9.00 9.52 9.75 10.28 10.50 10.48 10.75 10.86
11.00 10.87 3 months
7.95 7.10 6.88 9.30
8.17 8.53 8.77 8.50 8.73 8.99 9.08 9.19 9.79 10.36 10.62 10.89
11.19
6 months
7.81 7.16 7.05 9.41
8.25 8.75 8.98 8.76 8.97 9.19 9.16 9.19 9.81 10.34 10.62 10.94
11.30
1 year
7.66 7.27 7.18 9.49
8.34 8.97 9.28 9.05 9.17 9.25 9.25 9.17 9.77 10.28 10.48 10.90
11.31
Bonds < 5 years
7.71 7.85 7.70 8.86
7.87 8.23 8.71 8.62 8.77 8.86 8.79 8.74 8.85 9.28 9.66 9.91
10.48
5-7 years
8.22 8.24 7.89 8.70
8.00 8.37 8.69 8.70 8.79 8.68 8.54 8.49 8.59 8.89 9.28 9.33
10.04
> 7 years
8.34 8.51 8.18 8.76
8.21 8.44 8.83 8.79 8.83 8.71 8.59 8.53 8.67 8.98 9.24 9.25
TABLE IV
LAST MONTH ECU BONDS ISSUES
Issue
Payment
Date
03/01/90 26/01/90
04/01/90 08/02/90
04/01/90 26/01/90
04/01/90 02/02/90
09/01/90 05/02/90
09/01/90 05/02/90
08/02/90
14/02/90
08/02/90
22/02/90
15/02«)
Borrower (country)
I.B.M. Int. (U.S.A.)
Cregem (BELGIQUE)
S.B.C. Finance (SWITZERLAND)
Johnson SJohnson (U.S.A)
N.T.T. (JAPAN)
Abbey Int. (U.K.)
Crédit Local de FRANCE
E.I.B. B.E.I.
Electricité de FRANCE
Toyota (JAPAN)
Crédit Foncier de FRANCE
Listing:
Issued (Mio ECU)
Issue Price
125 101.875
60 101.875
100 101.625
100 101.875
150 101.875
50 101.950
150 101.250
500 100.200
150 101.450
100 101.700
65 97.850
LX = Luxembourg PA s Paris
Coupon
93/4
101/4
10
10
10
12
101/4
10
111/2
101/2
93/8
Term (years)
5
3
3
3
5
1
5
7
1
3
10
Maturity
26/01/95
08/02/93
26/01/93
02/02/90
02/02/95
05/02/91
08/02/95
14/02/97
08/02/91
22/02/93
27/12/99
Yields
X
9.27
9.51
9.36
9.26
9.52
9.86
9.93
9.96
9.91
9.82
9.71
Lead Manager
U.B.S. P.*D.
Crédit Lyonnais
S.B.C.
Merrill Lynch
S.B.C.
Deutsche Bank
Crédit Lyonnais
U.B.S. P.&D.
U.B.S. P.&D.
S.B.C.
J.P. Morgan Sec.
Listing
LX
LX
LX
LX
LN
LN
LX-PA
LX
LX-PA
LX
LX
Notice
Swap
Swap
Swap
Swap
Swap
Swap
Swap
Swap
TABLE V
CONSUMER PRICE INDICES IN NATIONAL CURRENCY
1985=100 B DK D ELL E F IRL I L NL Ρ UK EUR 12 ERM 1970 34.9 26.8 50.4 10.3 13.5 25.3 15.6 14.2 37.0 40.0 6.4 19.6 25.4 29.8
1980 1984
71.2 95.4 68.3 95.5 82.6 97.8 39.1 83.8
56.2 91.9 63.3 94.4 56.1 94.9 52.5 91.6 70.3 96.1
81.8 97.8 35.2 83.8 70.7 94.3
65.3 94.3 66.7 94.9
1985 100.0 100.0 100.0 100.0 100.0 100.0 100.0 100.0 100.0 100.0 100.0 100.0 100.0 100.0 1986 101.3 103.6 99.9 123.0 108.8 102.7 103.8 105.8 100.3 100.2 111.7 103.4 103.5 102.3 1987 102.9 107.8 100.1 143.2 114.5 105.9 107.1 110.9 100.2 99.8 122.2 107.7 106.9 104.7 1988 104.1 112.7 101.4 162.5 120.0 108.7 109.4 116.5 101.7 100.6 133.9 113.0 110.7 107.6
1989 1989
06
107.3 107.1 118.1 117.9 104.2 104.4 184.9 183.9 128.2 127.0 112.7 112.5 113.9 113.1 123.7 123.7 105.1 105.0
101.7 101.5 150.8 154.0 121.8 122.0
116.4 116.3 111.9 111.8
07 107.5 117.9 104.3 183.6 129.0 112.8 113.1 123.9 105.3 101.7 155.5 122.1 116.6 111.8 08 107.8 118.6 104.2 184.1 129.3 113.0 114.8 124.2 105.5 102.0 158.3 122.4 116.8 112.5 09 108.4 119.0 104.3 190.7 130.7 113.2 114.8 124.8 105.8 102.5 158.6 123.3 117.4 112.4 10 108.5 119.7 104.7 194.6 131.2 113.7 114.8 125.8 106.4 102.6 159.4 124.2 118.1 113.3 11 108.4 120,2 104.9 196.3 131.5 114.0 115.7 126.3 106.6 102.6 161.0 125.3 118.5 113.6 12 108.8 120.2 105.2 199.9 132.0 114.1 115.6 126.9 106.7 102.6 158.0 125.6 118.9 113.8
Annual rate of increase (%)
Β DK D ELL E F IRL I L NL Ρ UK EUR 12 ERM EUR 12 ERM EUR 12 ERM 61-70 3.0 6.0 2.7 2.1 6.1 4.1 4.8 4.0 2.6 4.2 4.5 4.1 3.7 3.3 0.8 0.7 1.7 1.2
71-80 1984
7.4 6.3 9.8 6.3 5.1 2.4 14.5 18.3 15.4 11.2 9.7 7.3 13.7 8.6 14.1 10.8 6.7 6.5 7.4 3.2 18.7 29.3 13.8 5.0
9.9 7.2 8.4 6.7
3.5 3.3 3.0 3.0
4.8 5.0 3.3 4.2
1985 4.9 4.7 2.2 19.4 7.8 5.9 5.4 9.2 4.1 2.3 19.3 6.1 6.1 5.4 2.5 2.3 4.0 3.0 1986 1.3 3.6 -0.2 23.1 8.8 2.7 3.8 5.8 0.3 0.3 11.7 3.4 3.5 2.3 2.8 1.9 Dis 3.9 2.5 1987 1.6 4.0 0.2 16.1 5.3 3.1 3.1 4.8 -0.1 -0.2 9.4 4.1 3.2 2.4 Aver. 1.9 1.8 parity be 3.8 2.8 1988 1.2 4.6 1.2 13.5 4.8 2.7 2.1 5.1 1.4 0.9 9.6 4.9 3.6 2.7 age devi; 1.8 1.4 tweenth 2.8 1.9
1989 1989
06
3.1 3.0 4.8 4.5 2.8 2.9 13.8 13.4 6.8 7.1 3.7 3.6 4.1 3.8 6.2 6.5 3.3 3.6 1.1 1.0 12.6 13.2 7.8 8.3
5.1 5.3 4.0 4.0
Ï tion around the meai
2.2 2.4 1.4 1.4
e average and them
4.1 4.4
[image:6.595.38.575.45.794.2]TABLE VI
CONSUMER PRICE INDICES IN ECU
1f85*1pd,
Ρ .·".
DXΡ
ELL
E F ' .IRL I L NL Ρ UK EUR 12 ERM
ECU
19Í0 30.9 ,28.0 30.0 35.2 24,5 30,1 1.6.4 32.2 32.5 - 27.1 28.3 27.0 29,4 30.33 0 2
1980 1984
78.7 94.9 70.0 94.1 7 2 9 97-3 6 9 7 99.4 72.8 93.7 73.1 93.5 58.5 93.3 §3.9 96.0 77.7 95.0
74.4 97.2
65.9 . 93.9 69.8 93.9
70.9 95.2 71.2 9 § 6 71.7 9 5 6
1985 100.0 100.0 100.0 100.0 100.0 100.0 100,0 100.0 100.0
' 100.0 100.0 100.0 100.0 100,0 100-0 1986 103.9 104.8 104.3 93.8 102.1 102.5 101.5 104.8 102.9 104.9 98.9 90.9 101.3 103.9 102.0 1987 107.4 109.7 107.5 96.1 103.9 103.8 98.9 107.3 104.6 107.7 97.8 9 0 0
103.1 106.4 104.2 1988 107.6 113.7 108.6 102.5 112.6 105.0 100.6 109.7 105.2 108.3 102.5 100.2 106.8 107.9 106.8
1989 1989
06
111.1 110.9 117.7 117.2 112.1 112.2 107.5 107.4 126.8 123.4 108.9 108.7 104.5 104.2 118.5 119.1 108.8 108.7 109.4 109.2 112.9 115.8 106.5 106.5
112.5 112.4 112.6 112.6 111.1 110.9
07 I
111.3 117.4 112.0 106.6 127.8 109.0 104.8 119.5 109.0 109.3 116.4 106.6 112.8 112.8 111.0 08 111.5 117.9 111.8 107.1 128.3 109.5 105.1 120.4 109.1 109.5 118.5 106.7 113.1 113.0 111.3
0 9 J
112.1 118.4 112.0 110.5 129.8 109.8 105.6 120.9 109.4 110.1 118.5 107.2 113.6 113.5 111.7 10 112.8 119.8 113.4 110.9 129.3 110.8 106.6 120.8 110.6 111.0 118.1 105.3 113.9 114.9 112.9
" I
113.3 121.2 114.1 110.7 129.9 111.2 106.8 121.6 111.4 111.5 118.6 103.6 114.1 115.5 113.2 12 114.4 122.1 115.3 111.1 129.7 111.6 107.3 121.7 112.1 112.3 115.2 101.1 114.2 115.9 113.4
Annual rate of increase (%)
Β DK
D ELL
E ' F IRL I L NL Ρ
yK
EUR 12 ERM ECU 61-70 3.8 5.4 4.5 1.3 3.7 3.3 4.7 4.3 2.9 5.1 3.7 2.8 3.7 4.1 3.8 Ii p ™
71-80 1984
9.8 6.3 9.6 6.1 9.3 3.9 7.0 4.6 11.5 12.1 9.3 6.1 13.8 7.3 7.1 8.3 9.1 6.4 10.6 3.7 8.8 9.5 9.9 . 4.2
9 2 5 8 8.9 5.6 .9.0 5.0
1985 6.1 6.3 2.8 0.6 6.7 7.0 7.1 4.2 5.2 2.8 6.5 6.5 5.1 4.6 4.7 1986 3.9 4.8 4.3 -6.2 2.1 2.5 1.5 4.8 2.9 4.9 -1.1 -9.1 1.3 3.9 2.0 1987 3.4 4.8 3.1 2.4 1.8 1.3 -2.5 2.5 1.7 2.7 -1.1 -0.7 1.8 2.4 2.2 1988 0.3 3.6 1.0 5.8 8.3 1.1 2.2 2.2 0.5 0.8 4.9 11.3 3.4 1.4 2.5
1989 1989
06 |
3.2 3.2 3.5 2.4 3.0 3.1 6.5 5.9 12.7 10.9 3.7 3.2 3.8 3.6 8.2 9.4 3.5 3.7 1.1 1.0 10.4 11.0 6.4 6.8
5.3 5.4 4.4 4.4 4.0 3.9
07 3.3 3.1 3.1 5.5 13.7 3.2 3.8 9.4 3.8 1.4 10.4 6.2 5.5 4.4 3.9 08 3.6 3.5 3.1 6.1 12.4 3.9 4.1 9.9 3.9 1.5 11.0 3.4 5.1 4.8 3.8 09 3.6 3.4 2.7 6.9 13.5 4.0 3.9 10.1 3.7 1.3 10.6 4.9 5.4 4.7 3.9
io |
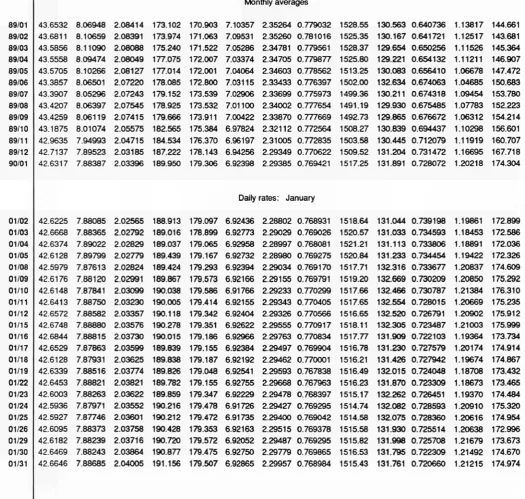
TABLE VII
ECU EXCHANGE RATES
1981 1982 1983 1984 1985 1986 1987 1988 1989 89/01 89/02 89/03 89/04 89/05 89/06 89/07 89/08 89/09 89/10 89/11 89/12 90/01 01/02 01/03 01/04 01/05 01/08 01/09 01/10 01/11 01/12 01/15 01/16 01/17 01/18 01/19 01/22 01/23 01/24 01/25 01/26 01/29 01/30 01/31 B/LFR 41.2946 44.7115 45.4380 45.4420 44.9136 43.7978 43.0392 43.4284 43.3806 43.6532 43.6811 43.5856 43.5558 43.5705 43.3857 43.3907 43.4207 43.4259 43.1875 42.9635 42.7137 42.6317 42.6225 42.6668 42.6374 42.6128 42.5979 42.6176 42.6148 42.6413 42.6572 42.6748 42.6844 42.6529 42.6128 42.6339 42.6453 42.6003 42.5936 42.5927 42.6095 42.6182 42.6469 42.6646 DKR 7.92255 8.15687 8.13188 8.14647 8.01876 7.93565 7.88413 7.95152 8.04929 8.06948 8.10659 8.11090 8.09474 8.10266 8.06501 8.05296 8.06397 8.06119 8.01074 7.94993 7.89523 7.88387 7.88085 7.88365 7.89022 7.89799 7.87613 7.88120 7.87841 7.88750 7.88582 7.88880 7.88815 7.87863 7.87931 7.88516 7.88821 7.88263 7.87971 7.87746 7.88373 7.88239 7.88243 7.88685 DM 2.51390 2.37599 2.27052 2.23811 2.22632 2.12819 2.07159 2.07440 2.07015 2.08414 2.08391 2.08088 2.08049 2.08127 2.07220 2.07243 2.07545 2.07415 2.05575 2.04715 2.03185 2.03396 2.02565 2.02792 2.02829 2.02779 2.02824 2.02991 2.03099 2.03230 2.03357 2.03576 2.03730 2.03599 2.03625 2.03774 2.03821 2.03622 2.03552 2.03601 2.03758 2.03716 2.03864 2.04005 DRA 61.624 65.342 78.088 88.340 105.739 137.425 156.220 167.576 178.840 173.102 173.974 175.240 177.075 177.014 178.085 179.152 178.925 179.666 182.565 184.534 187.222 189.950 188.913 189.016 189.037 189.439 189.424 189.867 190.038 190.005 190.118 190.278 190.015 189.839 189.838 189.826 189.782 189.859 190.216 190.212 190.428 190.720 190.877 191.156 ESC 68.495 78.007 98.689 115.680 130.252 147.088 162.581 170.059 173.413 170.903 171.063 171.522 172.007 172.001 172.800 173.539 173.532 173.911 175.384 176.370 178.143 179.306 179.097 178.899 179.065 179.167 179.293 179.573 179.586 179.414 179.342 179.351 179.186 179.155 179.187 179.048 179.155 179.347 179.478 179.472 179.353 179.572 179.475 179.507
FF HFL IRL
EXPLANATORY NOTES
Bilateral currency deviation (graph on page 3).
The various curves should be compared in pairs. To
find the differential between two currencies, subtract
the (positive or negative) values along the y-axis
corresponding to each currency.
The graph is drawn with the curve of the strongest
currency above that of the weakest. It shows
there-fore the relative position of each currency vis-à-vis
the other currencies.
When two curves intersect or merge over
a
period of
time there is no differential between the two
curren-cies and their market exchange rate equals their
bi-lateral central rate.
The graph is drawn within a horizontal band
corre-sponding to the maximum 2,25% margin of
fluctua-tion applying at any given moment to market
exchange rates and the bilateral central rates of the
ERM currencies, with the exception of the PTA, which
has a maximum authorized fluctuation of 6%. This
band is divided symmetrically by
a
horizontal axis
along which the points would be plotted if all
curren-cies were at their bilateral central rate and there were
therefore no fluctuations.
The daily market exchange rates of all currencies are
compared with the relevant bilateral central rates and
the differentials between the two calculated.
The maximum fluctuation between two currencies
(with the exception of the PTA) is shown within the
band, symmetrical with the horizontal axis. The
fluc-tuations of the other currencies in relation to either of
the two currencies in question are shown within the
maximum permissible fluctuation.
The curves are drawn by linking daily the points
showing the relative positions of each currency.
Exchange rate grid (Table I).
The intervention limit rates fixed in the official grid do
not always correspond exactly to + or 2.25% (+ or
-6% for the peseta) of the central rates, since for each
currency pair (whose exchange rates are inversely
proportional to one another) the lower limit of the one
corresponds to the upper limit of the other.
Ecu
bond issues (Table II
&
IV).
In the table II, the issues are recorded as at the
pay-ment date. This bulletin only covers international and
foreign issues in ecus, including ecu issues offering
the option of conversion into other currencies. Main
source: International Financing Review
Table II shows, under the headings:
- Business sector and Governments: national
issuers, both private and public.
- Institutions: the European Investment Bank and
the Commission of the European Communities
(EEC, ECSC, Euratom).
- Organizations: the specialist institutions of the
United Nations, the World Bank, the Council of
Europe, etc
Table IV shows detailled information of the latest
known issues, whatever the payment date.
Interest rates and yields on ecu investments
(Table III).
The interest rates for 1,3 and 6 month and 1 year
de-posits are calculated on the basis of the Friday
Lon-don market rates (source: Financial Times, LonLon-don
Money Rates, ECU Linked Deposit Bid).
The bonds are classified according to three types of
terms: under 5 years, from 5 to 7 years and more
than 7 years. The redemption yields of ecu bonds are
calculated each Wednesday from a sample of fixed
interest bonds, denominated in ecus and listed on the
Luxemburg Stock Exchange. These yields are
weighted by amounts in circulation, (source:
Luxem-bourg Stock Exchange).
The monthly and yearly averages are the arithmetic
means of these weekly interest rates and bond
yields.
Operations rates of the EMCF (Table III).
The interest rate for transactions in EMCF (European
Monetary Cooperation Fund) ecus, is the weighted
average of the most representative rates on the
do-mestic money market of the countries whose
curren-cies make up the ecu basket. It is based on the
weighting of the currencies in the ecu basket as
derived from the ecu central rates in force. The rate
thus calculated for a given month applies to EMCF
transactions for the following month. In table 3, this
rate relates to the month upon wich the calculations
are based and not to the (following) month during
which it is used by the EMCF.
Consumer price indices in national currency
(Table V).
The consumer price indices in the national currency
of each country measure changes in the purchasing
power of one unit of national currency spent in the
country concerned.
These indices are calculated as weighted arithmetic
means (chain indices) of the national indices, the
weighting for each Member State being its relative
share in the final consumption of households of the
group of countries in question (EUR 12, ERM), ex
pressed in purchasing power standards, at current
prices and purchasing power parities.
At the foot of the table, the average weighted fluctua
tions around the mean and the minimum are given for
the same groups of countries, with the same weight
ings. (These are calculated as weighted averages of
the absolute fluctuations in relation to the mean and
the minimum respectively). They show the degree to
which price movements in the Member States in the
Community converge.
Consumer price indices in ecus (Table VI).
For each country the index of consumer prices in
ecus is calculated by dividing the national consumer
price index by the average movement of the national
currency in relation to the ecu during the month. It
measures the change in the purchasing power of one
ecu in the country concerned.
Three composite indices are calculated, covering all
the Member States of the Community (EUR 12 and
ECU), the 9 Member States participating in the Euro
pean Monetary System exchange rate mechanism
(ERM). Although the peseta has been participating in
the exchange rate mechanism since 19/06/89, and
the peseta and the escudo have been included in the
calculation of the ecu since 21/09/89, these two cur
rencies are only taken into account in the indices con
tained in this bulletin for data after 30/09/89.)
These three indices are calculated as weighted arith
metic means (chainindices). The weightings are
defined as follows: for the EUR 12 and ERM indices,
the relative share of each Member State in the final
consumption of households for the group of countries
in question (EUR 12 or ERM), expressed in ecus at
current prices and exchange rates (annual weighting).
For the ecu index, the relative share of each Member
State's currency in the calculation of the ecu (monthly
weighting).
Ecu exchange rates (Table VII).
The exchange rates for the ecu against the national
currencies of the Member States of the Community,
the USD and yen are shown as annual averages,
monthly averages (for the current year), and daily
rates (for the latest available month).
1 ecus Σ
100= Σ
BFR
DKR
DM
3.301 0.1976 0.6242
42.1679 7.79845 2.04446
Poids des monnaies le
7.83 2.53 30.53
DRA*
ESC*
FF
HFL
IRL
Composition de l'écu depuis le 21/09/89
1.44 1.393 1.332 0.2198 0.008552
Cours pivots de l'écu depuis le
08/01/90.
187.934 177.743 6.85684 2.30358 0.763159
21/09/89, calculés sur la base des derniers cours
0.77 0.78 19.43 9.54 1.12
LFR
LIT
0.13 151.8
42.1679 1529.70
pivots, exprimés en
0.31 9.92
PTA
6.885
132.889
%
5.18
UKL*
0.08784
0.728615
12.06
* does not participate to the exchange rates mechanism
Venta y suscripciones · Salg og abonnement · Verkauf und Abonnement · Πωλήσεις και συνδρομές
Sales and subscriptions · Vente et abonnements · Vendita e abbonamenti
Verkoop en abonnementen · Venda e assinaturas
BELGIQUE / BELGIË IRELAND UNITED KINGDOM
M o n i t e u r belge / Belgisch Staatsblad
42. Rue de Louvain / Leuvenseweg 42 1 0 0 0 Bruxelles / 1000 Brussel Tél. 512 0 0 2 6
Télécopieur: 5 1 1 0 1 8 4
CCP / Postrekening 0 0 0 2 0 0 5 5 0 2 2 7
Sousdépôts / Agentschappen:
L i b r a i r i e e u r o p é e n n e / Europese Boekhandel
A v e n u e Albert J o n n a n 50 / Albert Jonnartlaan 5 0 1 2 0 0 Bruxelles / 1200 Brussel
Tél. 7 3 4 02 8 1 Télécopieur: 7 3 5 0 8 6 0
J e a n D e L a n n o y
Avenue d u Roi 2 0 2 /Koningslaan 202 1 0 6 0 Bruxelles / 1060 Brussel Tél. (02) 5 3 8 5 1 6 9
Télex 6 3 2 2 0 UNBOOK Β
C R E O O C
Rue de la M o n t a g n e 3 4 / Bergstraat 34 Bte 11 / Bus 11
1000 Bruxelles / 1000 Brussel
D A N M A R K
J . H. Schultz Information A / S EF-Publikationer
Otti 11 ave] 18 2 5 0 0 Valby Tlf: 36 4 4 2 2 66 Telefax: 36 4 4 0 1 4 1 Girokonto 6 0 0 0 8 86
BR DEUTSCHLAND ~
Bundesanzeiger Verlag
Breite Straße Postfach 10 8 0 0 6 5 0 0 0 Köln 1 Tel. (02 21) 2 0 290 Fernschreiber:
ANZEIGER BONN 8 8 8 2 595 Telefax: 2 0 29 2 7 8
GREECE
G.C. Eleftheroudakis SA
International Bookstore 4 Nikis Street
105 6 3 Athens Tel.: 3 2 2 6 3 2 3 Telex: 2 1 9 4 1 0 ELEF Telefax: 3 2 5 4 8 8 9
Subagent for Northern Greece:
M o l h o s Bookstore
The Business Bookshop 10 Tsimiski Street Thessaloniki Tel. 275 271 Telex 4 1 2 8 8 5 LIMO
ESPANA ~
B o l e t í n O f i c i a l d e l Estado
Trafalgar 27 E28O10 M a d r i d Tel. (91) 4 4 6 6 0 0 0
M u n d i - P r e n s a Libros. S.A.
Castellò 37 E28001 M a d r i d
Tel. (91) 4 3 1 33 99 (Libros) 4 3 1 3 2 22 (Suscripciones) 4 3 5 3 6 37 (Dirección) Telex 49370MPLIE
Telefax: ( 9 1 ) 2 7 5 39 98
FRANCE
Journal officiel Service des publications des C o m m u n a u t é s européennes
2 6 . rue De sa ι χ 7 5 7 2 7 Paris Cedex 15 Tél. ( 1 ) 4 0 5 8 75 0 0 Télécopieur: (1) 4 0 5 8 7 5 7 4
Government Publications Sales Office
Sun Alliance House M o l e s w o r t h Street Dublin 2 Tel. 71 03 0 9
or by post
Government Stationery Office EEC Section
6th floor Bishop Street Dublin 8 Tel. 78 16 66
ITALIA
Licosa Spa
Via Benedetto Fortini, 1 2 0 / 1 0 Casella postale 552 5 0 125 Firenze
Tel. 64 54 15
Telefax: 6 4 12 57 Telex 5 7 0 4 6 6 LICOSA I CCP 343 5 0 9
Subagenti:
L i b r e r i a s c i e n t i f i c a L u c i o d e Biasio AEIOU Via Meravigli. 16
2 0 123 Milano Tel. 8 0 76 79
Herder Editrice e Libreria
Piazza Montecitorio, 117120 0 0 186 Roma
Tel. 67 94 628/67 95 304 Libreria g i u r i d i c a Via 12 Ottobre. 172/R 16 121 Genova Tel. 59 56 93
GRANDDUCHÉ DE LUXEMBOURG
Abonnements seulement Subscriptions only Nur für Abonnements
Messageries Paul Kraus
1 1 , rue Christophe Plantin L2339 Luxembourg Tél. 4 8 2 1 3 1 Télex 2515 CCP 4924263
NEDERLAND
S D U uitgeverij
Christoffel Plantijnstraat 2 Postbus 2 0 0 1 4 2 5 0 0 EA 'sGravenhage Tel. (070) 78 98 8 0 (bestellingen) Telefax: ( 0 7 0 ) 4 7 6 3 5 1
PORTUGAL
Imprensa Nacional
Casa da M o e d a . EP
Rua D. Francisco Manuel de M e l o , 5 1092 Lisboa Codex
Tel. 69 34 14
Distribuidora Livros Bertrand Lda. Grupo Bertrand. SARL
Rua das Terras dos Vales. 4A Apart. 37
2 7 0 0 Amadora Codex Tel. 4 9 3 9 0 5 0 4 9 4 87 8 8 Telex 15798 BERDIS
H M S O Books (PC 16)
H M S O Publications Centre 5 1 Nine Elms Lane L o n d o n S W 8 5DR Tel. ( 0 1 ) 8 7 3 9 0 9 0 Fax: GP3 8 7 3 8 4 6 3
Subagent:
A l a n A r m s t r o n g Ltd
2 A r k w r i g h t Road Reading. Berks RG2 OSQ Tel. (0734) 75 17 71 Telex 8 4 9 9 3 7 A A A L T D G Fax: (0734) 7 5 5 1 6 4
SUISSE
OSEC
Stampfenbachstraße 85 CH8035 Zürich Tél. (01) 3 6 5 5 1 5 1 Fax: (01) 3 6 5 52 2 1
ÖSTERREICH
M a n z ' s c h e V e r l a g s b u c h h a n d l u n g Kohlmarkt 16
1014 W i e n Tel. (0222) 531 610 Telex 11 2 5 0 0 BOX A Telefax: (0222) 531 6181
TURKIYE
D ü n y a s u p e r v e b of s e t A . C . Narlibahçe Sokak No. 15 Cagaloglu
Istanbul Tel. 5 1 2 0 1 9 0 Telex: 2 3 8 2 2 dsvotr.
UNITED STATES OF AMERICA
U N I P U B
4661F Assembly Drive Lanham, M D 2 0 7 0 6 4 3 9 1 toll free (800) 2 7 4 4 8 8 8 Fax. (301) 4 5 9 0 0 5 6 Télex 710826Ό418
CANADA
Renouf Publishing Co., Ltd
6 1 Sparks Street Ottawa Ontario K1P 5R1
Tel. Toll Free 1 (800) 267 4164 Ottawa Region (613) 238 8985-6 Telex 053-4936
J A P A N
Kinokuniya Company Ltd
17-7 Shinjuku 3-Chome Shiniuku-ku
Tokyo 160-91 Tel. ( 0 3 ) 3 5 4 0 1 3 1
Journal Department
PO Box 55 Chitóse Tokyo 156
Tel. (03) 439 0124
AUTRES PAYS OTHER COUNTRIES ANDERE LANDER
Office des publications officielles des C o m m u n a u t é s européennes
2. rue Mercier L 2985 Luxembourg Tél. 49 92 8 1
Télex PUBOF LU 1324 b CC bancaire BIL 8 - 1 0 9 / 6 0 0 3 / 7 0 0
90
Price (excl. VAT) in Luxembourg: Single copy ECU 6 · Subscription ECU 51
OFICINA DE PUBLICACIONES OFICIALES DE LAS COMUNIDADES EUROPEAS ISSN 1011-0844
KONTORET FOR DE EUROPÆISKE FÆLLESSKABERS OFFICIELLE PUBLIKATIONER A M T FÜR AMTLICHE VERÖFFENTLICHUNGEN DER EUROPÄISCHEN GEMEINSCHAFTEN ΥΠΗΡΕΣΙΑ ΕΠΙΣΗΜΩΝ ΕΚΔΟΣΕΩΝ ΤΩΝ ΕΥΡΩΠΑΪΚΩΝ ΚΟΙΝΟΤΗΤΩΝ
OFFICE FOR OFFICIAL PUBLICATIONS OF THE EUROPEAN COMMUNITIES OFFICE DES PUBLICATIONS OFFICIELLES DES COMMUNAUTÉS EUROPÉENNES UFFICIO DELLE PUBBLICAZIONI UFFICIALI DELLE COMUNITÀ EUROPEE BUREAU VOOR OFFICIËLE PUBLIKATIES DER EUROPESE GEMEENSCHAPPEN SERVIÇO DAS PUBLICAÇÕES OFICIAIS DAS COMUNIDADES EUROPEIAS