RIT Scholar Works
Theses
Thesis/Dissertation Collections
2004
Automatic error recovery using P3 response
verification for a brain-computer interface
Samuel A. Inverso
Follow this and additional works at:
http://scholarworks.rit.edu/theses
This Thesis is brought to you for free and open access by the Thesis/Dissertation Collections at RIT Scholar Works. It has been accepted for inclusion
in Theses by an authorized administrator of RIT Scholar Works. For more information, please contact
.
Recommended Citation
Automatic Error Recovery
Using P3 Response
Verification for a
Brain-Computer Interface
Rochester Institute of Technology
Computer Science Department
Master of Science Thesis
Samuel A
.
Inverso
May 9
,
2004
In
p
ll
rtial
f
u
lfillm
e
nt
of th
e
r
equir
e
m
e
nts for
t
h
e
d
egr
ee
of
Master
of
Scien
ce
.
Michael Van Wie
L2-/
M
C.
7
tor
R
ea
der:
Micha
e
l
V
a
n Wie
,
PllD
Roger S. Gaborski
I,
Samuel A.
Inverso, do hereby grant permission to
copy this
document, in
who
l
e or
in
part
,
for a
ny
non-
c
ommercial or non-profit purpose. Any other use
of this document requires the written permission
of the
author.
Samuel A. Inverso
First,
I would like to thank my advisor, JessicaBayliss,
for the support, freedom,
andguidancenecessary to succeedin thisinterdisciplinary
field. Jessica'sstraightforward advice and easy communication style created an environment
where the risk inherent in
interesting
research was positivelybalanced againsttheshort timeframe imposed
by
aMaster's degree.I would like to thank Gerwin Schalk of the Wadsworth Center for
help
in understanding BCI2000'ssubtleties and complexities, and hisoften immediateresponses to email queries. In addition, I would like to thank Agustin Roca
and
Vijay
Kenkat ofTucker-Davis Technologies who were exemplary in their customer servicediagnosing
and anticipating hardwareand softwaredifficul tieswiththe amplifier,and providingindispensableaidin thesignal acquisition system'sdesign.Iwouldlike to thankCarol Marchetti for herelucidationof statistical signif
icancetests, which wasinstrumental in understandingandapplying thecorrect
statistical methods in dataanalysis.
I would liketo thank RebeccaAllen for her allowances and support
during
myabsencefromthe Media Lab Europe while
finishing
this thesis.I would like to thank Andrea
Chew,
ChadHulbert,
and Juanjo Andres Prado forproofreading this material. Special thanks to Chad for mercilesslyscrutinizing this
document,
which leadtocorrections and suggestionsthathave greatlybenefited its presentation.Thanks to Dan Kunkle for challenging metoachieve and excel throughout this degree.
Iwould alsoliketothankalltheprofessors,students,
family,
andfriendswho accompanied me throughout this work.They
supported me academically, understoodmyreclusive
behavior,
andoffered littlewordsof encouragementwhen motivation was minimal. Though theirnamesarenotlisted,
eachimpactedthis thesis in ameaningfulway not easilyexpressed inwords.Finally, I would like tothank my parents, Ronald and
Connie,
whoseearlyand consistent support ofeducation instilled in me afortitude without which
A brain-computerinterface
(BCI)
isan augmentative communication mech anism that does not rely on peripheral nerves or muscles. Current BCIs are error prone and slow with error rates of 10 to 30% and transmission rates of10-25
bits/min,
however,
errorrecovery and correction inBCI haslargely
beenneglected. Thefocusofthis thesis isthedevelopment of amethodtoautomat
ically
recover errorsin BCIusing the P3 brainsignalfor response verification.TheexistenceoftheP3 signalinresponsestocontrolledgoalitems isshown
in an evoked potential BCI used to control items in a virtual apartment. A
reduced response exists whenitems are accidentally controlled. Offline experi ments wererun,andwithatheoreticalmeanimprovementin accuracyfrom 78% to
85%,
therewasastatisticallysignificantimprovement (P<0.008,
Wilcoxonsigned rank test) in accuracy of 3% using a correlation algorithm for P3 sig nal detectionon responses. The presence ofthe P3 signal in responses togoal
items indicates it can be used for automatic error recovery without requiring additional time, which will improve thespeed and accuracyofbrain-computer
Acknowledgments iii
Abstract iv
List ofFigures vii
List ofTables xiii
List ofAcronyms xvii
1 Introduction 1
2 Brain-Computer Interfaces
(BCIs)
52.1 The Physical Brain 6
2.2
Measuring
BrainActivity
. 82.3
Recording
EEGActivity
. 122.3.1 Electrodes 13
2.3.2 Electrode placement . 13
2.3.3 Referenceand Bipolar Recordings 14
2.3.4
Grounding
152.3.5 Artifacts . 15
2.4 Electroencephalogram
(EEG)
162.4.1 Rhythmic Brain
Activity
162.4.2 Event Related Potential
(ERP)
. 192.4.3 Event-RelatedDesynchronization
(ERD)
andEvent-RelatedSynchronization
(ERS)
212.4.4 Other BCIapproaches usingEEG 22
2.5 Errors in aBCI 23
2.6 BCI Performance Measures . 23
3 Related Work 25
3.1 Choice Organization 26
3.2 Manual Error
Recovery
273.2.1 Undo 28
3.3.1 Error-Related
Negativity
(ERN)
3.3.2 Error Potential 30
3.4 Conclusion 31
4 Automatic Error
Recovery
Using
the P3 signal 334.1 Introduction . .... 33
4.2 TheVRapartmentexperiment . . .35
4.2.1 Experimental
Setup
354.2.2 TheExperiment . 37
4.2.3 TheAppearanceoftheEvoked Potential P3 Component 38
4.3 Methods . 39
4.3.1
Using
anEvoked-Potential for ErrorRecovery
394.3.2 Offline Analysis 39
4.4 Results . . 40
4.5 Discussion and Future Work 42
5 Chess BCI Platform for Experimentation 45
5.1 Patient's Brain-Computer Interface 46
5.2 IMPBN's Chess BCI Requirements 46
5.3 Chess BCI Design . 46
5.4 Implementation 48
5.4.1
Proxy
Engine . . 485.4.2 Winboard Modifications . . .48
5.4.3 BCI2000 Modules Implemented . . 49
5.5 Discussionand Future Work . . . 49
6 Conclusion 51
6.1 Future work 52
A
Accuracy
Equations 53B Data used for Response Verification Analysis of the Virtual
Apartment Experiment Screen Condition 57
B.l Peak Pick B.2 Correlation
58 68
B.3 Correlation Indeterminate . 7g
2.1 General BCI frameworkproposed
by
MasonandBirch[40]. Shows theflowofinformation fromthebrainto thedeviceandfeedbackfromthe deviceto theperson. 6
2.2 BrainStructures: cerebrum, cerebellum,limbicsystem,andbrain
stem. Used with permission[3]. 7
2.3 Projection neuronshowing information flow. Used with permis
sion [27]. 8
2.4 The brain's functional lobes. Usedwith permission [27]. 9
2.5 Example brainscans
depicting
spatial resolution. Computer Tomography
(CT)
isanX-ray imaging
technique thatdoesnot pro vide functionalinformation. Usedwith permission. 10 2.6 Spatial(mm)
vsTemporal(sec)
Resolutions for BrainGraphing
Methods. Usedwithpermission [27]. . . 11
2.7 International 10-20 SystemofElectrode Placement,
(a)
Top
viewshowing the 21 electrode positions,
(b)
Side view showing electrodepositionsat10and20%ofthe distancebetweenthenasion andinionmeasured overthe topofthe head. Usedwith permis
sion [27], 14
2.8
Delta,
Theta,Alpha,
and Beta rhythmic EEGfrequency
ranges.Usedwith permission [27]. 17
2.9 P300waveform. 19
2.10 FarewellandDonchin'sP300spellerinterface. Rowsand columns
intensify
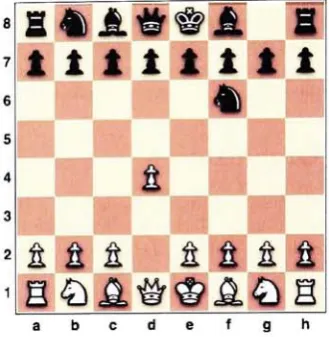
ever 125ms. Imageshows rowintensification [24]. 213.1 Example chess opening moves. Screen capture from Vektor3
3.1.6. . 27
3.2 Examplecontrolflow from Wolpawet al.'s manual responseveri ficationina2-Dcursor controlBCI [82]. Theuser wantstoselect A. Iftheusermovesthe cursorto Ain theupperleft corner, the A isselected andthe useris thenpresented withtheresponseto
sign, sign,
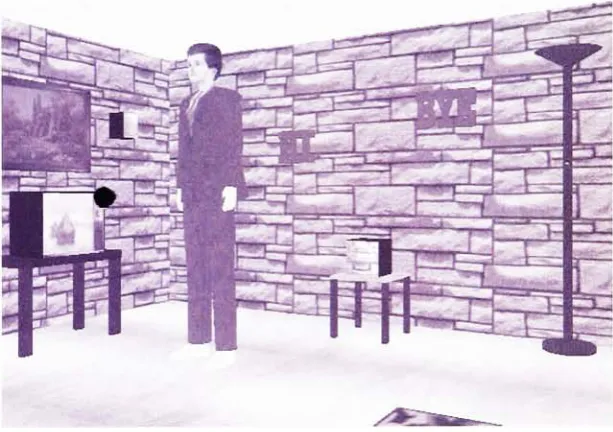
lamp
this scene,red sphere onthetelevisionset is blinking. 36
4.2 a) Thegrand averagesforcontrol of goals at sitePz (solid
lines)
shownwiththegrand averagesfornon-goals(dashed
lines)
ineach experimentalcondition,
b)
Thegrand averages over nine subjectsforresponsestogoalitemcontrol(solid
lines)
and mistakesin itemcontrol (dashedlines). 38
4.3 Responseverificationaccuracyvsoriginalaccuracyusingthecor relation method. Solid lineshows theoriginalaccuracy vsitself.
Itemsabovethe line increased inperformance. . . 41
5.1 Chess Brain-Computer Interface High Level Design . 47
B.l Accuracies resulting from varying average peak for Peak Pick
algorithm. Regressedtrue, EOG Threshold: 90 59 B.2 Response Verification
Accuracy
versus OriginalAccuracy
for P3Found and P3 Absent methods (site Fz). Condition:
Monitor,
Algorithm: PeakPick,
Regressed: yes,EOG Threshold:90,
PeakThreshold: 61. q\
B.3 Response Verification
Accuracy
versus OriginalAccuracy
for P3 Found and P3 Absent methods (site Cz). Condition:Monitor,
Algorithm: PeakPick,
Regressed: yes,EOG Threshold:90,
PeakThreshold: 61. gj
B.4 Response Verification
Accuracy
versusOriginalAccuracy
for P3 Found and P3 Absent methods (site Pz). Condition:Monitor,
Algorithm: PeakPick,
Regressed: yes,EOG Threshold:90,
Peak Threshold: 61.B.5 Response Verification
Accuracy
versus OriginalAccuracy
for P3 Found andP3 Absent methods (site Any). Condition:Monitor,
Algorithm: PeakPick,
Regressed: yes, EOGThreshold: 90 Peak Threshold: 61.B.6 AcrossAll Subjects Response Verification Trials Goal
and Non-GoalGrandAverages.
Keep
responseif P3wasfoundat siteAny. Condition:Monitor,
Algorithm: PeakPick,
Regressed-yes EOG Threshold:
90,
PeakThreshold: 61B.7 Response VerificationTrialsSubject1
GoalandNon-Goal Grand Averages.
Keep
responseifP3wasfoundat siteAny.Condition-Monitor,
Algorithm: PeakPick,
Regressed: yes,EOGThreshold-90, Peak Threshold: 61
B.8 ResponseVerificationTrialsSubject2GoalandNon-Goal Grand Averages.
Keep
responseifP3wasfoundat siteAny.Condition-onTT
^g0ruh^: ?eak
PlCk'
ReSressed:
yes,EOG 90, PeakThreshold: 61
62
62
63
63
Averages.
Keep
responseifP3was foundatsiteAny. Condition:Monitor,
Algorithm: PeakPick,
Regressed: yes,EOGThreshold:90,
Peak Threshold: 61 64B.10 Response Verification Trials Subject 4 GoalandNon-GoalGrand
Averages.
Keep
responseifP3wasfoundat siteAny. Condition:Monitor,
Algorithm: PeakPick,
Regressed: yes,EOGThreshold:90,
Peak Threshold: 61 65B.ll Response Verification Trials Subject 5 GoalandNon-Goal Grand Averages.
Keep
responseifP3was foundat siteAny. Condition:Monitor,
Algorithm: PeakPick,
Regressed: yes,EOGThreshold:90,
Peak Threshold: 61 65B.12 Response Verification Trials Subject 6 GoalandNon-GoalGrand Averages.
Keep
responseifP3wasfoundatsiteAny. Condition:Monitor,
Algorithm: PeakPick,
Regressed: yes,EOGThreshold:90,
Peak Threshold: 61 66B.13 Response Verification Trials Subject7 GoalandNon-GoalGrand Averages.
Keep
responseifP3was foundat siteAny. Condition:Monitor,
Algorithm: PeakPick,
Regressed: yes,EOGThreshold:90,
Peak Threshold: 61 66B.14 Response Verification TrialsSubject 8 GoalandNon-GoalGrand Averages.
Keep
responseifP3was foundatsiteAny. Condition:Monitor,
Algorithm: PeakPick,
Regressed: yes,EOGThreshold:90,
Peak Threshold: 61 67B.15 Response Verification Trials Subject 9 GoalandNon-GoalGrand Averages.
Keep
responseifP3wasfoundat site Any. Condition:Monitor,
Algorithm: PeakPick,
Regressed: yes,EOGThreshold:90,
PeakThreshold: 61 . 67B.16 Accuraciesresultingfromvarying thresholdfor Correlationalgo rithm. Regressed true, EOG Threshold: 90 69 B.17 Response Verification
Accuracy
versus OriginalAccuracy
for P3Found and P3 Absent methods (site Fz). Condition:
Monitor,
Algorithm:Correlation,
Regressed: yes, EOG Threshold:90,
CorrelationThreshold: 0.68. 71
B.18 Response Verification
Accuracy
versus OriginalAccuracy
for P3 Found and P3 Absent methods (site Cz). Condition:Monitor,
Algorithm:Correlation,
Regressed: yes, EOG Threshold:90,
CorrelationThreshold: 0.68. . . 71
B.19 ResponseVerification
Accuracy
versus OriginalAccuracy
for P3 Found and P3 Absent methods (site Pz). Condition:Monitor,
Algorithm:Correlation,
Regressed: yes, EOG Threshold: 90,CorrelationThreshold: 0.68. . 72
B.20 ResponseVerification
Accuracy
versus OriginalAccuracy
for P3 Found and P3 Absent methods (site Any). Condition:Monitor,
Algorithm:Correlation,
Regressed: yes, EOG Threshold:90,
Goal Grand Averages.
Keep
P3Fz. Condition: Monitor,Algorithm:
Correlation,
Regressed: yes,EOG Threshold:
90,
Correlation Threshold: 0.68 . . 73B.22 ResponseVerificationTrials Subject 1 GoalandNon-Goal Grand Averages.
Keep
responseifP3was foundat site Fz. Condition: Monitor, Algorithm:Correlation,
Regressed: yes, EOG Threshold:
90,
Correlation Threshold: 0.68 73B.23 Response Verification Trials Subject 2 GoalandNon-Goal Grand Averages.
Keep
response ifP3 was found at site Fz. Condition:Monitor,
Algorithm:Correlation,
Regressed: yes, EOG Threshold:
90,
Correlation Threshold: 0.68 74B.24 Response Verification Trials Subject 3 GoalandNon-Goal Grand Averages.
Keep
responseifP3 was found at site Fz. Condition:Monitor,
Algorithm:Correlation,
Regressed: yes, EOG Threshold: 90, CorrelationThreshold: 0.68 74
B.25 Response Verification Trials Subject 4 GoalandNon-GoalGrand
Averages.
Keep
response ifP3 wasfoundat site Fz. Condition:Monitor,
Algorithm:Correlation,
Regressed: yes, EOG Threshold:
90,
CorrelationThreshold: 0.68 75B.26 Response Verification Trials Subject 5 GoalandNon-Goal Grand Averages.
Keep
response ifP3 wasfound at site Fz. Condition:Monitor,
Algorithm:Correlation,
Regressed: yes, EOG Thresh old:90,
Correlation Threshold: 0.68 . . 75B.27 Response Verification Trials Subject 6 GoalandNon-Goal Grand
Averages.
Keep
response ifP3was found at site Fz. Condition:Monitor,
Algorithm:Correlation,
Regressed: yes, EOG Threshold: 90, CorrelationThreshold: 0.68 76
B.28 Response Verification Trials Subject7 GoalandNon-Goal Grand Averages.
Keep
response ifP3 wasfound at site Fz. Condition:Monitor,
Algorithm:Correlation,
Regressed: yes, EOG Threshold:
90,
Correlation Threshold: 0.68 76B.29 Response Verification Trials Subject 8 GoalandNon-GoalGrand
Averages.
Keep
response ifP3was found at siteFz. Condition:Monitor,
Algorithm:Correlation,
Regressed: yes, EOG Threshold:
90,
Correlation Threshold: 0.68 77B.30 Response Verification Trials Subject 9 GoalandNon-Goal Grand
Averages.
Keep
response if P3was found at siteFz. Condition:Monitor,
Algorithm:Correlation,
Regressed: yes, EOG Threshold:
90,
Correlation Threshold: 0.68. 77
B.31 Accuracies resulting from varying threshold forCorrelationInde
terminate algorithm. Regressedtrue, EOG Threshold: 90 . 80
B.32 Response Verification
Accuracy
versus OriginalAccuracy
for P3 Found and P3 Absent methods (site Fz). Condition: Moni tor, Algorithm: CorrelationIndeterminate,
Regressed:yes, EOG
Threshold:
90,
Correlation Threshold: 0.68.Found and P3 Absent methods (site Cz). Condition: Moni
tor,Algorithm: Correlation
Indeterminate,
Regressed: yes,EOGThreshold:
90,
CorrelationThreshold: 0.68. 82B.34 Response Verification
Accuracy
versusOriginalAccuracy
for P3 Found and P3 Absent methods (site Pz). Condition: Monitor, Algorithm: Correlation
Indeterminate,
Regressed: yes, EOG Threshold:90,
CorrelationThreshold: 0.68. 83B.35 Response Verification
Accuracy
versus OriginalAccuracy
for P3 Found and P3 Absent methods (site Any). Condition: Monitor, Algorithm: Correlation
Indeterminate,
Regressed: yes, EOG Threshold:90,
Correlation Threshold: 0.68. 83B.36Across All Subjects Response Verification Trials Goal and Non-Goal Grand Averages.
Keep
responseifP3wasfoundatsiteAny. Condition:Monitor,
Algorithm: CorrelationIndeterminate,
Regressed: yes, EOG Threshold: 90, Correlation Threshold: 0.68 84 B.37 Response Verification Trials Subject 1 GoalandNon-Goal Grand
Averages.
Keep
responseifP3wasfoundat siteAny. Condition:Monitor,
Algorithm: CorrelationIndeterminate,
Regressed: yes,EOG Threshold:
90,
Correlation Threshold: 0.68 84B.38 Response Verification Trials Subject 2 GoalandNon-Goal Grand
Averages.
Keep
responseifP3was foundatsiteAny. Condition:Monitor,
Algorithm: CorrelationIndeterminate,
Regressed: yes, EOG Threshold: 90, CorrelationThreshold: 0.68 85B.39 Response Verification Trials Subject 3 GoalandNon-Goal Grand
Averages.
Keep
responseifP3wasfoundat siteAny. Condition:Monitor,
Algorithm: CorrelationIndeterminate,
Regressed: yes,EOG Threshold:
90,
Correlation Threshold: 0.68 85B.40 Response Verification Trials Subject4 GoalandNon-Goal Grand Averages.
Keep
responseifP3was foundat siteAny. Condition:Monitor,
Algorithm: CorrelationIndeterminate,
Regressed: yes, EOG Threshold:90,
Correlation Threshold: 0.68 86B.41 ResponseVerificationTrials Subject 5 GoalandNon-GoalGrand Averages.
Keep
responseifP3wasfoundatsiteAny. Condition:Monitor,
Algorithm: CorrelationIndeterminate,
Regressed: yes, EOG Threshold: 90, Correlation Threshold: 0.68 . 86B.42 Response Verification Trials Subject 6 GoalandNon-GoalGrand
Averages.
Keep
responseifP3 wasfoundat siteAny. Condition:Monitor,
Algorithm: CorrelationIndeterminate,
Regressed: yes,EOG Threshold:
90,
Correlation Threshold: 0.68 87B.43 Response Verification Trials Subject 7 GoalandNon-Goal Grand Averages.
Keep
responseifP3wasfound atsiteAny. Condition:Averages.
Keep
P3 found Any. Condition:Monitor,
Algorithm: CorrelationIndeterminate,
Regressed: yes, EOGThreshold:90,
CorrelationThreshold: 0.68B.45 Response Verification Trials Subject 9 GoalandNon-GoalGrand
Tables
2.1 Brain
imaging
methods that canbeused for BCI [27]. 94.1 Changeinaccuracyfrom theoriginal accuracywhen
keeping
responses with P3 signals using the peak picking and correlation algorithmstorecognizeP3signals. The besttheoreticalaccuracy occurs if all selected goals are kept while all selected non-goals are rejected (P calculated with theWilcoxon sign ranktest). 42
4.2 Change in the bit rate from the original bit rate when
keeping
responseswith P3 signalsusingthepeakpickingand correlation algorithmsto recognize P3s. The best theoretical accuracy oc cursifall selected goals arekept whileall selected non-goals are
rejected. 43
B.l The number of responses used in subject averages. Condition:
Monitor,
Algorithm: PeakPick,
Regressed: yes,EOG Threshold:90,
Peak Threshold: 61 . 58B.2 Stimuli from original experiment broken into selected, rejected,
goal, and non-goal. Condition:
Monitor,
Algorithm: PeakPick,
Regressed: yes, EOG Threshold:90,
Peak Threshold: 61 58B.3 Discarded EOG: The number of stimuli notused in analysis be cause their signalswere greater than the EOG threshold. Thus
thesewere unaffected
by
responseverification, butwerestillused todetermine the newaccuracy after response verification. Con dition:Monitor,
Algorithm: PeakPick,
Regressed: yes, EOGThreshold: 90, PeakThreshold: 61 59
B.4 Originaland responseverification accuracies. Verification
(q)
in dicatesthe accuracyoftheresponse verificationtrialitself. Theoreticalbest indicates bestaccuracy thatcouldhave beenachieved ifall selected goalswerekeptandallselected non-goals weredis carded
during
response verification. All Pvalues werecalculated with the Wilcoxon sign rank test. Condition:Monitor,
Algo rithm: PeakPick,
Regressed: yes, EOG Threshold:90,
Peak(q)
indicates thebitsper minuteoftheitself. Theoretical best indicates the best bit rate that could have beenachievedifallselectedgoals werekept andallselected
non-goals werediscarded
during
responseverification. Condition:Monitor,
Algorithm: PeakPick,
Regressed: yes,EOGThreshold:90,
PeakThreshold: 61 60B.6 The number of responses used in subject averages. Condition:
Monitor,
Algorithm:Correlation,
Regressed: yes, EOG Threshold:
90,
CorrelationThreshold: 0.68 68B.7 Stimuli fromoriginal experiment broken into selected, rejected,
goal,andnon-goal. Condition:
Monitor,
Algorithm:Correlation,
Regressed: yes, EOG Threshold:90,
Correlation Threshold: 0.68 68B.8 Discarded EOG: The number of stimuli not used in analysisbe
causetheir signals were greater than the EOG threshold. Thus thesewere unaffected
by
responseverification, butwere stillused todetermine the new accuracy after response verification. Con dition:Monitor,
Algorithm:Correlation,
Regressed: yes, EOG Threshold:90,
Correlation Threshold: 0.68 . 69B.9 Originaland response verificationaccuracies. Verification
(q)
in dicatesthe accuracyoftheresponseverificationtrialitself. Theo reticalbest indicates bestaccuracy thatcouldhave beenachieved ifallselected goalswerekeptandallselected non-goalsweredis cardedduring
responseverification. All Pvalueswerecalculated with the Wilcoxon sign rank test. Condition:Monitor,
Algo rithm:Correlation,
Regressed: yes, EOG Threshold:90,
CorrelationThreshold: 0.68 70
B.10Original and response verification bits per minute. Verification
(q)
indicatesthebitsperminute oftheresponse verificationtrial itself. Theoretical best indicates the best bit rate that could have beenachieved ifallselected goalswerekeptand all selected non-goalswerediscardedduring
response verification. Condition:Monitor,
Algorithm:Correlation,
Regressed: yes, EOG Threshold: 90, CorrelationThreshold: 0.68 . 70
B.ll The number of responses used in subject averages. Condition:
Monitor,
Algorithm: CorrelationIndeterminate,
Regressed: yes, EOG Threshold:90,
Correlation Threshold: 0.68 79B.12 Stimuli from original experiment broken into selected, rejected
goal, and non-goal. Condition:
Monitor,
Algorithm:Correlation
Indeterminate,
Regressed: yes, EOG Threshold:90, Correlation
Threshold: 0.68 .
cause their signals were greater than the EOG threshold. Thus
thesewereunaffected
by
responseverification,butwere stillused todeterminethenewaccuracyafter response verification. Condition:
Monitor,
Algorithm: CorrelationIndeterminate,
Regressed:yes, EOG Threshold: 90, Correlation Threshold: 0.68 80
B.14 Originaland response verification accuracies. Verification
(q)
indicatesthe accuracyoftheresponse verificationtrialitself. Theo
reticalbest indicates bestaccuracy thatcouldhave beenachieved ifall selectedgoalswerekept andall selected non-goals weredis
carded
during
response verification. All Pvalues were calculatedwith the Wilcoxon sign rank test. Condition:
Monitor,
Algo rithm: CorrelationIndeterminate,
Regressed: yes, EOG Threshold:
90,
CorrelationThreshold: 0.68 81B.15 Original and response verification bits per minute. Verification
(q)
indicates the bitsper minute ofthe response verificationtrialitself. Theoretical best indicates the best bit rate that could
have beenachieved ifallselectedgoals werekeptand allselected
non-goals werediscarded
during
response verification. Condition:Monitor,
Algorithm: CorrelationIndeterminate,
Regressed: yes,A/D analog-to-digital
ABI Adaptive Brain Interface
AC alternatingcurrent
BCI brain-computer interface
CNV contingent negativevariation
EEG electroencephalogram
ECG electrocardiogram
EMG electromyogram
EOG electrooculargram
EP evoked potential
ERN error-related negativity
ERD event-related desynchronization
ERS event-related synchronization
ERP event-related potential
fMRI functional magnetic resonance
imaging
MEG magnetoencephalography
PET positron emission tomography RV response verification
SCP slow cortical potential
SEP somatosensoryevoked potential
SSAEP steady stateauditory evoked potential
SSSEP steady statesomatosensoryevoked potential SSVEP steady state visualevoked potential
TTD Thought Translation Device
LSP Language Support Program
VEP visualevoked potential
VR virtual reality
Introduction
Brain-Computer Interfaces
(BCI)
are communication and control mechanisms thatdo not rely on peripheral nervesand muscles [84]. Aswith all non-perfect information transfer mechanisms BCIs suffer from errors [71].However,
error recoveryand correctionin BCIhaslargely
beenneglected. Thisthesisdescribes a method to improve BCI accuracyby
automatically recovering errors based on brain signals that occur when the computer provides feedback to a user's selection.Amyotrophic lateral sclerosis
(ALS),
multiple sclerosis, cerebral palsy, and spinal cordinjury
are afew neuromusculardisorders thatcancompletelypara lyze individuals butnot affecttheirbrains. Ifrestorativetreatmentsareineffec tive,theafflictedmaylivemanyyears withlifesupport systems andtwenty-four hourcare, butwithoutthe ability tocommunicateor control theirenvironmentthrough normal means. These individualsarelocked-into their bodies [84].
Depending
upon the individuals'afflictions, there are three options avail
able for communication and control.
First,
they may use remaining voluntary musclecontrolfor communication. Someparalyzed people retain control of eyemovements, which they can use to answer simple questions or control word processingprograms witheyetracking.
Second,
neural pathwaysmayberecon nected aroundthebreakto controlhealthy
muscle. Electromyographic(EMG)
signalsfrommuscles unaffected
by
spinal cordinjury
cancontrol paralyzedmus cles. Finally, ifmuscularmovementisnonexistent, thelocked-in individualmay employ a direct brain communication mechanism to communicate and controlthe environmentusingacomputer [83].
The majorityof BCI research is rooted in the electrical activity generated
by
the neuronsfiring
in thebrain,
electroencephalogram(EEG),
because this activityhas beenthroughly
studiedincognitivepsychologysinceitsdiscovery
by
Hans Berger in 1929 [46]. In addition, EEG is fastand cost effective comparedto other brain
imaging
methods(fMRI,
SPECT, MEG,
etc.);though,
it only provides aggregateinformationonneuronal activity.Over thepast two decadesthe utility ofBCI has been
demonstrated
using different brain signals, to varying degrees ofsuccess, in spelling applications[24,
9,53],
cursor control[79,
80, 84, 63],
virtual environment control[7,
62],
games
[30,
36],
and hand orthosis and direct muscle controlby
stimulation[55,
61].Current BCIs are error prone and slow with error rates of 10 to 30% and transmissionrates of10-25 bits/min
[57,
83].Comparatively,
a mediocre typist can achieve750bits/min(30words/min). ErrorrecoveryandcorrectioninBCI haslargely
beenneglectedeventhougha modest gainfromrecoverycanachievesignificantimprovements inaccuracy andbandwidth. The lackof errorrecovery methods maybe duetoBCI's
infancy
asafield andtheneglect of performanceerrors incognitivepsychology
[43],
whichhasresulted ina minimalsetof errortheoriesavailablefor application inBCI.
Twotypes oferrorsoccurin BCI: selectingtheincorrectchoice and missing
the correct choice
[53],
these are also referred to as false positive and false negative errors respectively. Improved signal recognition has increased BCI accuracy,however,
high error rates persist. Some methods oferror recovery are: a manual undo choice[52],
requiring the user to manually validate the selectionwith response verification(RV)
[82],
anddetecting
the Error-RelatedNegativity
(ERN) [15]
or error potential[71]
brainsignalsforautomaticresponseverification.
Thesetechniques havevarious disadvantages. Themanualtechniques, undo
and
RV,
slowtheoveralltransmissionspeedoftheBCIandrequire morechoices tobe ignoredwhen no errors arepresent. Theautomatictechniques, ERNand error potential, do not reduce the speed of the BCI;however,
the ERN has only been detected with physical movement (it occurs when the user realizesa mistake was made, such as pressing an incorrect button). In addition, it is
unclear whattheerror potential represents and moreexperimentation isneeded toprove its robustness acrossindividualsandtasks.
Formany
BCIs,
falsepositive andfalsenegativeerrors arediametrically
opposedbecause reducing thenumberofincorrect selectionsincreasesthenumber
ofincorrect rejections and vice versa. In most cases, it is betterto reducethe
numberofincorrectselections attheexpense ofincorrect rejections because re
covering incorrectselections canbemore
frustrating
astheuser must correctthe error,whileincorrect rejectionsonlyrequiretheusertowaitfortheappropriatechoice tobe presented again [53]. Ifautomatic error recovery isemployed the
number of incorrect rejections can be minimized without
frustrating
the userbecause incorrectselections are recovered without user involvement.
Thisthesispresents a new errorrecovery technique thataddressesthedisad
vantagesofcurrent techniquesand the
difficulty
ofminimizingthese diametric error types. The new technique automatically rejects selections when the P3 brainsignal is not presentin a response to a selection.Conversely,
the the se lectionisacceptedif theP3signalispresentintheresponse a responseisthe feedback from a computer when the user makes aselection, e.g. in a spellingapplication, ifchoice 'b' is selected the computer displays the letter 'b'
to the user,which isthe response tothe selection.
In the second chapter the broad background required for brain-computer
presented. Different electricalsignals beneficialto BCI are overviewed andthe BCIs that utilize them are presented. Brain
imaging
in general is touched upon and EEG is discussed in depth.Finally,
BCI errors and performancemeasurement inbit/rate areexplained.
The third chapter is a review of current error recoverystrategies. Choice organization'simpact ontheoccurrence of errorsis discussed. Manualrecovery strategies, undo and manual response verification, along with the automatic recovery strategies, using the brain signals ERN and the error potential, are presented withtheir advantagesand disadvantages in BCI.
The fourth chapter details the automatic error recovery method using the P3signalforresponseverificationandtheresults ofanofflineexperiment using thismethodinaP3 based BCI controllinga virtual apartment. Withatheoret ical mean improvement in accuracy from78% to
85%,
therewas astatistically significant improvement (P <0.008,
Wilcoxon signedranktest)
in accuracy of 3% usinga correlationalgorithmfor P3 signal detection on responses.Thefifth chapter describesthe chess BCIplatformforexperimentation de veloped toaddress the limitations ofthe virtual reality
(VR)
apartment offline data analysis study. The platform provides anengaging environment that re quires 100% accuracy and isa novel alternative to the traditional BCIspeller applications. In addition, a collaboration with researchers at the Institute of MedicalPsychology
andBehavioralNeurobiology
(IMPBN)
attheUniversity
of Tubingen inTubingen,
Germany
tousethe chessBCI forone oftheir patients isreviewed.Brain-Computer
Interfaces
(BCIs)
A brain-computer interface
(BCI)
is a communication and control mechanismthat does not rely onperipheral nerves and muscles [84].
Fundamentally,
BCI is asystemto record functionalactivitydirectly
fromthebrain,
recognize theactivity recorded, and control a device based on the activity recognized, see
Figure 2.1.
Ideally,
brainimaging
to recordfunctional brainactivityshould befast,
finegrained, andnonencumberingforeffective real-time devicecontrol.
Practically,
brain
imaging
devices todayonly partially fulfill thesethreeconstraints.Mag-netoencephalography
(MEG)
is fast and finegrained, but requires aroom fullof equipment andthe subjectmust remain still. Functionalmagnetic resonance
imaging
(fMRI)
is fine grained, but requires a large machine that cannot bemoved,and isslowinrecordingactivity.
Electroencephalography
(EEG)
isfast,
inexpensive,
and the subject is allowed alimited range ofmovement,however,
it only records aggregate neuronal activity.Among
these choices, EEG is the de facto standard in BCI research because it is inexpensive and the activityrecorded
by
EEG is backedby
seventy-five years of research experience, while MEGand fMRI arerelativelynew and expensive technologies.Recognition ofbrain activity is limited
by
the accuracy ofthe brainimag
ing
technique used andconfoundedby
the cacophonyinthe brain itself.Many
algorithmshave beenemployedtoincrease theclassification rate ofEEG BCIs. These methods include simple linearmethods, such as averaging EEG signals
over multiple trials of the same stimulus
[25],
as well as correlations between individual trials and predetermined subject averages [6]. Machinelearning
algorithms have been used to improve BCI accuracy with techniques such as
Independent Component Analysis
(ICA)
forthe reductionofartifacts[34]
andSupport Vector Machines
(SVMs)
forincreasing
overallaccuracy [42].BCIs have been used to control various devices such as a hand orthosis
Electrodes
Device State
ControlDisplayState
amp Feature
Extrator
n
User-Reported ErrorDevice
Device Controller
Figure 2.1: General BCI frameworkproposedbyMasonandBirch [40]. Showsthe flowof information fromthebrainto thedeviceandfeedback fromthedevicetotheperson.
[55,
61]. BCI hasalsobeenusedincomputer applicationsforspelling[24,
9,
53], cursor control[79,
80, 84, 63],
games[30,
36],
and virtual environment control[7,
62].Currently
BCI islimitedby
its transmissionrate of 10-25bits/minand error rate of10-30%[57,
83],BCI isan
interdisciplinary
fieldcombiningresearchincognitiveneuroscience, signal processing, and computer science. This chapter covers the broad back ground required for brain-computer interfacing. The physical and functional anatomy of the brain is described with specific focus on aspects important in EEG BCI. Brainimaging
methods are discussed and EEG is detailed in depthincluding
the benefits of different electrical signals and the BCIs that utilize them.Finally,
measuringBCIperformance in bit/rate isexplained.2.1
The Physical Brain
The adult human brain contains 100 billion neurons spread through the cere
brum,
cerebellum, limbic system, andbrainstem showninFigure 2.2 [77]. The mostimportantstructuretobrain-computer interfaces(BCIs)
is thecerebrum's outer fourmillimeters(mm)
oftissuecalledthecerebralcortex,which contains 20 billion neurons[77]
generating the electrical activity that drives the typical electroencephalogram(EEG)
BCI.There are many different types of neurons in the central nervous system (brainand spinalcord) varyingin diameter (0.004mmto 0.1 mm), length(0.15 mm to 2 meters), and shape, among other attributes. The two main neuron classes inthe cerebralcortex are pyramidal cells
(pyramid-shaped)
and stellate cells(star-shaped)
[39,
77]. Pyramidal cells are longer than stellate cells and are oriented to form adipole layer projectingelectrical activity to the cortical surface, which is used in an EEG BCI [26]. Neurons consist of three main structures: the soma,dendrites,
and axondepicted in Figure2.3. [image:24.476.109.434.103.237.2]Limbic
System
Figure 2.2: Brain Structures: cerebrum, cerebellum,limbicsystem, andbrainstem. Used with permission [3].
as a nucleus, mitochondria, and ribosomes. Dendrites branch from the soma
forming
a tree shape. The dendrites are the inputs into the neuron and arecovered with many synapses, which are the input points. The axon is the
neuron's output. Unlike the branches formed
by dendrites,
the axon has asingle connectionto thesoma calledtheaxonhillock. Theaxon resembles a
long
thread with frayed ends. The ends ofthe axon form synapses with dendrites
whereinformationistransfered [39].
The dendrites and axons of different neurons stop short of touching each
other at the synapse.
Instead,
a gap is formed called the synaptic cleft andtheelectricalimpulse that travels through the axon is converted toa chemical
signalthat traverses the gap and is converted backto an electrical impulse
by
the receivingdendrite [39].
Neurons are the brain's decision makers,
forming
intricate webs with eachothergivingrisetothebrainsprocessingpower. Eachneuronmayhave 1,000to
10,000connections with neuronsin their immediatearea orfarpartsofthebrain
[4,
77]. When a neuron receivesinput an electrical potential is created, whenthispotential reachesathreshold theneuron
'fires',
sendinganelectricalimpulse down itsaxontowardsother neurons. Aneuron canexcite otherneuronstofire orinhibitother neurons fromfiring
using thisprocess.[39,
45]
Neuroscientists have shown that groups of neurons will fire in the same location on the cerebral cortex based on function. This has given rise to the
functional map ofthe brain shown in Figure 2.4. In the functional map, the
brain is divided into four lobes:
frontal,
parietal, occipital, and temporal [39],The frontal lobe extends from behind the eyes to the top ofthe head and
isresponsibleforanalysis, planning,
decisions,
movement and motor skills, lanInput from
other neurons
Electrical
impulses
V
Transmitterrelease
Dendrite
Soma
-Nucleus Axon
Hillock
Dendritic
Spine
Node of
Ranvier
GlialICell
TerminalButtons
Figure 2.3: Projectionneuronshowing informationflow. Usedwith permission [27].
to about where theskull beginsto steeply slope downwardsand is responsible for
body
locationandisthereceiverofsensory informationfromthebody. Theoccipital lobe extends from the parietal lobe to the back ofthe head and sits above thecerebellum. Theoccipital lobe isresponsibleforprocessingvisualin
formationandhasadirect linkwiththeeyes.
Finally,
thetemporallobeextendsalong both sides ofthe head parallel to the ears and touches all three of the
other lobes. The temporallobe is involved with speech comprehension, recog nizing objects, scenes, and
faces,
andmaintaining autobiographicalinformationinconjunction withthe frontal lobe
[65,
37],2.2
Measuring
Brain
Activity
There are a variety of
imaging
devices that can be used for BCI. These devices include electroencephalogram
(EEG),
magnetoencephalography(MEG),
positron emissiontomography
(PET)
, andfunctionalmagneticresonanceimag
[image:26.476.160.386.97.401.2]Frontal Lobe Parietal Lobe
vOccipital Lobe
TemporalLobe
Figure 2.4: The brain's functional lobes. Usedwith permission[27]
Table 2.1: Brainimagingmethodsthatcanbeusedfor BCI [27].
Method Description
Electroencephalography
(EEG)
Maps general brain activity using scalp electrodes.Magnetoencephalography
(MEG)
Measures magnetic fields generated
by
electricalcurrents at celllevel. Positron Emission
Tomography
(PET)
The subject ingests radioactive tagged glucose. After the glucose enters the
bloodstreamthePET machine measures the concentrations ofglucose, which cor
respondsto thebrain's active areas. Single-Photon Emission Com
puted
Tomography
(SPECT)
Similar to
PET,
but with poorer spatial [image:27.476.80.326.119.339.2]Method Description
Functional Magnetic Resonance Based on Magnetic Resonance
Imaging
Imaging
(fMRI)
(MRI)
technology. fMRI can detect oxygen levels in blood to show variations in
neuralactivitywithout
ingesting
radioactive markers.
Figure 2.5 depictsspatial resolutions for different brain
imaging
techniques.Computer
Tomography
(CT)
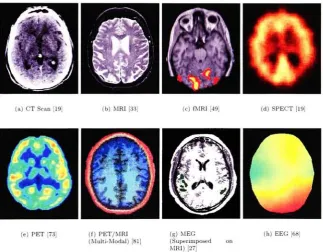
scans arethe most finedgrained, approximately0.3 mm to 1 mm.
Unfortunately,
CT uses X-rays toscan thebrain,
which candamage cells. In addition, it does not provide functional information about
the brain'sactivity. EEG provides a good functional map ofthe overall brain
activity but has poor spatial resolution, ranging from 26.6 mm to 35.3 mm. Neurons'
widthsrangefrom 0.004mm (granulecell) to0.1 mm (motorneuron)
[77].
(a)CT Scan[19] (b)MRI(33] (c)fMRI (d)SPECT[19
(e) PET[73] (f)PET/MRI (Multi-Modal)[81]
(g)MEG (Superimposed
MRI)[27]
(h)EEG
Figure2.5: Examplebrainscans depictingspatial resolution. ComputerTomography(CT) isan X-ray imagingtechnique thatdoesnotprovidefunctionalinformation. Usedwith per mission.
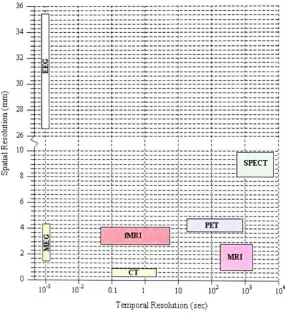
Figure 2.6 compares
imaging
methods'
spatial resolution to temporal res
[image:28.476.109.433.287.539.2]requiresaroomfull ofexpensive monitoringequipmentandthe subject's head
cannot move
during
the recording. While EEG spatial resolution is poor, ithasverygoodtemporalresolution,whichisimportant whentranslatingrapidly
changingbrainactivity to
users'
desires. EEGsignalsarewidelyusedinBCIre
searchbecause theyarefasttemporally, inexpensive andless cumbersomethan
other methods
(MEG,
fMRI, SPECT,
and PET require a room full ofequipment), and non-invasive (the user wearsacap ofelectrodes)
[27]
. In addition.EEG signals caneasily be combined with other techniques, such as
fMRI,
forBCIsystemsthatrequirefinegrainedspatial resolution. Forthesereasons most
BCIresearch,
including
thisthesis, focuses onEEG.36 , ,.
34:
32
30
28
ct
26
10
s
4:
2 :
SPECT
fMRI
PET
EC
CT+
11
MRI
+ 1CT 10'*
0.1 1 10 10
Temporal Resolution
(sec)
Iff 10
[image:29.476.61.347.251.566.2]2.3
Recording
EEG
Activity
Thissectiondetails recordingEEG from the scalp, known as surface EEG. To
record EEG fourtypes of equipment are required: electrodes, an
operational-amplifier,an analog-to-digital
(A/D)
converter,anda computer. Theelectrodes acquire analog electrical signals from the scalp, which are then sent to the operational-amplifierforamplification. Afteramplificationthesignalis digitizedby
the A/Dconverter andtransfered toacomputerwherethey are interpreted in real-time using signal processing algorithms or stored for later processing.In BCI
literature,
interpreting
signalsfor communication andcontrol whilethesubjectis usingtheBCI is referredtoas online,whileprocessingstored signals
is referredto as offline.
As described in Section
2.1,
whenneuronsfiretheygenerate electricalactivity
thatsummatesin thescalp. Thiselectricalactivitycreatesdifferentelectrical voltages(potentials)
on the scalp, which are detectedby
electrodes. Thevolt agesonthe scalp fromthe neuronfiring
isvery small, typicallyat most 50/J.V, and needs to beincreased to thesensitivity range oftheA/D converter, whichis usually 0.5 V to 10V before further processing.
Thescalp voltageis increased to the A/Dconverter's range with an opera tional amplifier, which is similar to an audio amplifier found in car and home theater systems. Amplifiers increase the voltage
by
a multiplicative constant called gain, as shown in Equation 2.1 whereU,
is the input voltage, g is the gain, andV0
isthe amplified output voltage.V0
=Vt
xg(2.1)
For example, a typical EEG amplifier gain is 50,000. Given an input of
10fiV the output will be 500,000 uY, whichis 0.5 V, and withinthe range of
anA/D converter.
The electrical potentials on the scalp are analog signals that need to be
convertedtodigitalrepresentationsfora computertoprocessthem.
Converting
ananalogsignaltodigital form iscalledsampling, becausethecontinuousanalog signal issampled(recorded)
at discrete time intervals. Two important aspects ofanalogto digitalconversion are the samplingrateand resolution.Thesamplingrateindicates howoftentheA/Dconverter samplesthecontin
uous signal. ThisrateisrepresentedinunitsofHertz
(Hz),
whichare1/seconds. Ifthe samplingrateis 128Hz,
thenthe signal issampled 128timesa second.The fasterthesamplingratethemore accuratethesignalwillberepresented in digital form. The Nyquist theoremstates the highest
frequency
that canbeaccuratelyreconstructedwithout erroris halfthesamplingrate. Inotherwords, to represent an analog signal without error in digital form the signal must be
sampled at leasttwiceits
frequency
[26]. As showninSection2.4,
brainsignalshave frequencies up to 30 Hz. To accurately represent 30 Hz beta signals in digital form theNyquist theorem statesthe signal must besampled at least at
60Hz (2 x 30Hz). Ifthebetasignalissampled atlessthen60 Hzfalse
frequency
components will appear inthe reconstructed signal. The false
frequency
errorThe A/D converter's resolution also contributes to its accuracy in repre
senting the signal in digital form. Resolution is given in bits a bit is the fundamentalunit of
binary
computingand caneither bea0 or 1. A resolutionof12bitsrepresentsa signal using4,096points (212 =
4,096),
a resolutionof16 bits has 65,536 points, and a resolution of 2 bits has 4points. The resolutionpoints are evenly spread across the A/D's voltage output range and indicate
the precision ofthe signal's recording, which is a practical consideration when
comparing signals.
For example, an A/D converter with 12 bit resolution and output range
5 V to 5 V measures the signal in 0.002 Volt increments (10 V total range,
4,096 points, 10 V/4096 =0.002
V)
An A/D converter with 16 bit resolution and output range -5 V to 5 Vmeasures the signal in 0.0001 Volt increments(10V/65536= 0.0001 V). Thechoiceof resolutionis basedon the
fidelity
the BCIsignalprocessing requires.2.3.1
Electrodes
Electrodesconducttheelectrocorticalpotentialsfromthe scalp to an amplifier.
Surface EEGelectrodesare 8 to 9mm indiameter and are composed of
silver-silverchloride
(Ag/AgCl),
gold, ortin [26]. Needleelectrodes aregenerally notused for BCI as they are uncomfortable for the subject, may cause
infection,
and have poorrecording quality [66]. Throughout this thesis 'electrode'
refers
to surface electrodeunlessotherwisestated.
Electrodesarecup-shapedtoholdelectrolyticpasteor gel
depending
onhowthey
are affixedto thescalp. Theelectrolytic paste and gel aidthe conductivityoftheelectrodes and
help
preventmotion artifact. Forgoodquality recordings,theelectrodesmustbe
firmly
attachedto the scalpandtheelectrodeimpedanceshould between 100 and 5,000 Q
(Ohms)
[26].Impedance isthe resistanceto current flow. Iftheimpedance betweenthe
electrodeand scalpis
high,
thebrain's electricalactivitywillnot beconductedthrough the electrodes properly and large differences in impedances between
electrodesfavors 60 Hznoise
[26],
seeSection 2.3.5. Electrode impedance ismeasured
by
sendinga weakalternatingcurrentthroughone electrode andrecordingit fromasecond electrode. With proper electrode application impedances can
bereducedtoless than3,000 ft [64],
Only
metersspecifically designedto test scalp electrodeimpedancesshouldbeused. Impedancemeters designedto testelectrical circuitsmaysend alarge
painful current to the patient, and can also polarize the paste or gel changing
their conductive properties [26].
2.3.2
Electrode
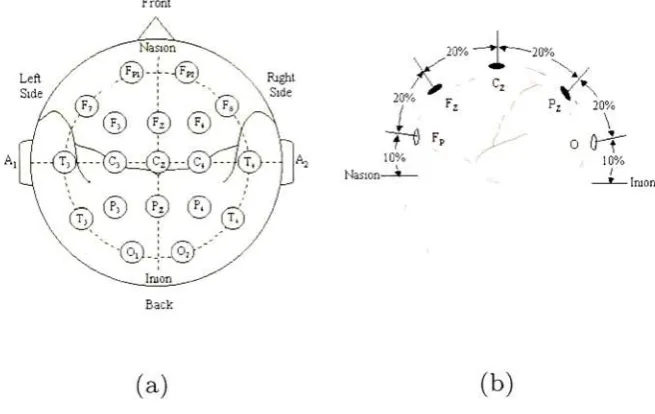
placementThe International 10-20 SystemofElectrode Placement
[32],
seeninFigure2.7(a),
was developed in 1958
by
electroencephalographers to compare data using acommon
terminology
and referencesystem,anddefinestheplacementofof electrodes 10% and 20% ofthe distance betweenskull landmarks [29]. The electrode position names consist of a letter followed
by
a number.The letter indicates the structural lobe below the electrode:
Frontal, Central,
Parietal, Occipital,
and Temporal. Numbers indicate if the electrode isleft,
right, or on the midline. Odd numbers indicate
left,
even numbers indicateright, and
'z'
for 0 indicateson the midline. Thesystem uses every other odd
andeven number startingwiththree andfourtoleaveroomfor additionalelec trode placements.
Forexample, from Figure
2.7(a),
01 isontheleft side ofthe head overtheoccipital
lobe,
and Cz istheposition atthe verytopoftheheadoverthecentral lobe onthe mediallineofthe left and right cerebralhemispheres.Front
Left Side
-20%
10% Nasion *
20% 4
20% y y. i
i
20%
\
o
H~
/ 10%
-* Inion
Back
(a)
(b)
Figure2.7: International10-20SystemofElectrodePlacement, (a)Topviewshowing the21
electrode positions, (b)Sideviewshowingelectrode positionsat10 and20%ofthedistance
betweenthenasion andinionmeasured overthetopofthehead. Usedwith permission[27].
2.3.3
Reference
and Bipolar RecordingsEEGmeasuresthepotentialdifference
(voltage)
betweentwo electrodes,i.e. theelectrical signal from one electrode is subtracted from the other. In a bipolar
recording, the two electrodes both measure cortical activity. In a reference
recording, oneelectrode measures corticalactivitywhile theother is placed on
[image:32.476.114.442.261.468.2]reference all electrodesmeasuringcorticalactivityarelinkedtoasingle reference
electrode [64].
2.3.4
Grounding
Equipment and subjects must be properly grounded
during
EEG recordingsfor safety andto reduce noise [64]. A
bony
protuberance, such as themastoidbehind the ear, should be connected with an electrode to the EEG amplifiers
electrode groundjack.
2.3.5
Artifacts
Artifacts are non-cerebral activity inthe EEG that may masquerade asbrain
activity and otherwise obscure realbrain activity. Artifacts appear becauseof
the large amplification required to measure electrical brain activity, and may
betechnological or physiologicalinnature. The
following
isalist ofthemajorartifactsthat mayoccur whenperformingBCIexperiments [66].
Technical artifacts
Electrode
Improperly
attached electrodes andfaulty
wires can causeartifacts. An impedance checker shouldbe used to verify thatelectrodes
areproperly attached. Electrode impedancesshouldbe lessthan5,000fl
[64].
Faulty
and partially broken wires are difficult to diagnose as they mayintermittently
causeartifacts.Faulty
wiresmaybe identifiedby looking
atthe activity in nearby electrodes;because EEGmeasuresthepotentialfield
across the
head,
electrodes near each other should show similar activity,dissimilar activity maybe a result oftechnical artifacts [64],
60 Hz interference
Nearby
electrical equipment and power lines caninduce rhythmic 60 Hz cycles (50 Hz in
Europe)
from alternating current
(AC)
power. Proper grounding of the subject and equipment canreduce this interference. In addition, amplifiers
typically
have 60/50 Hz notch filtersthat removethisnoise before amplification [64].Ground
loop
- 60Hz interference thatoccurswhen a ground electrode is shorted to an active electrode [64].
Physiological artifacts
Oculography - Eye
movement and
blinking
cangenerate spikes of200 to400 fiV, whichtravel posteriorly. Eye electrical activity recordings,
elec-trooculargram
(EOG),
areusedtodifferentiateeye activityfromcerebralactivity. EOG is
typically
recorded from electrodes above and below theexperimenters willgenerallyrejecttrialswithamplitudes greaterthan 50-90 fiV when classifying activityto account for electrooculargram
(EOG)
artifact.
Alternatively,
regression algorithms may beused to remove eyeartifacts fromtrials that wouldotherwise be rejected [72].
Muscle
-Musclecontractions,suchastalking,jawclenching, andchewing,
generate electrical activity, which may be seen in EEG [26]. Electrical
muscle activity,elect romyogram
(EMG),
is dominant inthe 50to 150 Hzfrequency
range and peaks at 5 mV[38,
18]. A lowpass filter is used toreduce muscle artifacts if thecerebralactivityofinterest is lowenough.
Cardiac Electrical activity from the
heart,
electrocardiogram(ECG),
can appearin EEG. Pulse waves caused
by
electrodes over blood vesselsandballistocardiographicartifact caused
by
a subject'srockingmovement when theheart beatsmayappear in theEEG [64].Perspiration Salt in perspiration creates a "salt bridge''
between elec trodes that decreases inter-electrode impedances causingshorts. Perspi
ration mayalso separatetheelectrode fromthe scalp overtime
[66,
26].Motion Head and
body
movement may move the leads and contacts,which causes wide wave artifacts. This can be corrected
by
asking thesubject not to move
[26,
66].2.4
Electroencephalogram
(EEG)
Electroencephalogram
(EEG)
is the recording of electrical activity from thebrain,
discovered in humansby
Hans Berger(1873-1941)
in 1929 [46]. Theelectricalactivity generated from neurons
firing,
Section2.1,
summateson the human scalp.Using
EEG recording equipment, Section 2.3, this electrical activity
canberecognized andutilized inbrain-computer interfaces (BCIs). Thissectionreviews the signalsgenerated
by
thebrain,
where theyare recorded onthe scalp, theirfunctionalsignificance, and theiruseinBCI.
2.4.1
Rhythmic Brain
Activity
Rhythmic brain waves were the first brain signals discovered
by
Hans Berger[46]
. Rhythmic brainwavesarebrainsignalsthatoccurcontinuouslyand repeatinamplitude,
frequency,
andwaveform [26]. Theserhythmicsignals are dividedinto
frequency
ranges named after Greek letters: delta5,
theta8,
alpha a, andbeta j3, see Figure 2.8. The mapping of Greek letters and
frequency
rangesfollowstheir chronological
discovery,
not alogicalincreasing
in frequency.Alpha
The alpha rhythm ranges between 8 and 13 Hz in normal adults and is dis
wave-1 4 8 13 30
Frequency
(Hz)
I
I II
I I II
I I I II
I I I I I I I I I I I I I I I II
alpha beta EEG Rhythm
Figure 2.8: Delta, Theta, Alpha, and Beta rhythmic EEG frequencyranges. Usedwith permission [27].
formsaremonomorphic (regularin shape) with sharppointsatthetop or bot
tom, or sinusoidal. Alpha's amplitudeis variable, but averages50 /jM [26]. Alpha activityis
typically
constant in itsfrequency
in individual subjects,but varies acrosssubjects, and maydecrease
by
1 Hz or more with drowsiness. It increasesforashortdurationaftereye closure,andisblockedby
eyeopening, i.e. its amplitude significantly decreases. Itsfrequency
should be the same in both hemispheres at any given time, while the amplitude may differ betweenthe twohemispheres [26].
Thealpha rhythm's purposeisunknown; though,theposterior
distribution,
eyeopeningandclosing influenceonthe wave,andothercharacteristicsindicate it is "integratedwiththevisualsystemfunctionandpossiblyrepresentsactivitywhich appears inabsenceofspecific inputto that system [26]."
The rhythm is named 'alpha' for purely historical reasons. When Hans Burger made hismeasurements he namedthe first rhythmhe identified 'alpha'
afterthe first letter inthe Greekalphabet: a [46]. Beta
Thebetarhythm's
frequency
band is between 13and30 Hzand appearsinthreemaintypes
frontal,
widespread, and posterior whichvaryin distribution and reactivity. These three beta patterns disappear in sleep, but frontal and widespread activity remain longer than alphaactivityduring
drowsinesswhen beta becomes more dominant. Beta rhythm amplitude istypically
lower thanalphaamplitude, seldomexceeding 30uN[26]. Beta activitygreaterthan30 Hz isoften referredtoas gammaactivity.
The most commontypeofbetarhythm is distributed
frontally
and extends into the central regions. This beta rhythm may be blockedby
movement, intention to move, andtactilestimulation [26].
Widespread beta rhythm appears over the majorityofthe head and is not blocked
by
any stimulus [26].Posteriorbetarhythmisalsoknownasfastalpha variantbecause it islocated
inthesame area asthealpharhythm,isblockedthesame as alpharhythms,and
intermixes,
alternates, and replaces alpha rhythms. In addition, itsfrequency
is usually twice alpha'sfrequency
(16-20Hz)
[26].Mu
The mu rhythm's
frequency
band is between 7 and 11 Hz and appears in thecentral and centroparietal regions as arch-shaped trains
lasting
afew seconds.Mu rhythms are more apparent
during
alphablocking
because mu and alpharhythmsoverlap in
frequency
range [26].Similar to beta rhythms, the mu rhythm is blocked
by
both voluntary andinvoluntary
movement, intentionto move, andtactile stimulation [26],Themurhythm's purposeisunclear, but "mayberelatedto somatosensory
processes associatedwithmovement [26]." The
blocking
effect causedby
movementandtactilestimulationmayindicatethemu rhythmrepresents "the
idling
ofasensory system notprocessingspecificinput fromthe thalamicnuclei [26]."
Delta and Theta
The delta rhythm's
frequency
band is below 4Hz;
theta's is between 4 and8 Hz. Both rhythms primarily occur in
deep
sleep[26]
making them oflittleuse in brain-computer
interfaces;
though, theta rhythms do appear in smallunorganizedamounts innormal adults
[26,
37],BCIs based on Rhythmic
Activity
Wolpawet al.
[84]
developedaBCIusingself-regulation ofmuandbetarhythmamplitude. After 5-10 half hourtrainingsessionssubjects can learntoincrease
anddecreasetheamplitudeofthemu orbetarhythmtocontrolamousecursor,
and with sufficient
training
can achieve information transfer rates up to 25 bits/min.Pineda et al.
[62]
developed a BCI based on the difference of mu powerat C3 and C4 using Cz as ground. Users were trained for 10 hours over five
weeks togenerate muactivity under both C3 and C4 to move left ina virtual
environment, andtogeneratelessmuinonehemispherethan theothertomove
the virtual character right. Transfer rates were not reported, but all subjects
wereable todemonstrate bothtypes ofcontrol.
Brainball isanovelgamedeveloped
by
HjelmandBrowall[30]
where aplayerattempts to roll a ball into an opponent's goal
by
achieving a higher state ofrelaxation measuredas the ratio of alpha to betawaves. Alphaand beta
self-regulationsare rarelyusedin BCIs becausetheyrequireshiftingbetweenstates
of relaxation and alertness. These waves have traditionally been restricted to
neurofeedback/biofeedback applications [1].
Doherty
et al.[22,
21,
23]
studied thebrain-body
interface Cyberlink[2],
whichuses acombinationofelectromyogram
(EMG), EOG,
and alpha andbeta EEG for controlling various interfaces.They
reported subjects withtraumaticbrain injuries achieved accuracy rates between 44 and 100%. Though it is
uncleartowhatdegree Cyberlink's controlis
directly
fromthe brain.Guger et al.
[28]
reported a large scale imagined motor movement BCIexperimentwith ninety-nine
healthy
subjects. After 20-30minutes oftraining,
their right hand (which extended an on screen bar right) or both feet (which
extended an onscreenbar left).
2.4.2 Event Related
Potential
(ERP)
Event related potentials
(ERP)
are changes in the brain's electrical activity in response to stimuli. Unlikerhythmic brain activity, ERPs are short signalswithdefinitive beginnings and endings. These signals are alsotime-lockedtoa stimulus,whichcanbeauditory,visual,orsomatosensory(touch). The
following
isnot an exhaustivelist of
ERPs,
butalist ofERPs thathaveutility in BCI.P300
TheP300 isalarge brainsignalthatisevoked
by
novel andtaskrelevant stimuli. These formsaredesignated P3a(novelty)
andP3b (taskrelevance). The P300'sname reflects that it is a positivesignal that peaks 300 ms after the onset of stimulus. Most time related evoked potentials are named in thismanner [45]. The P300 isalso referredto as theP3.
N1
Figure 2.9: P300waveform.
The P3aappears
frontally
whenthesubjectisaware ofa novel orinfrequentstimulus. For example, if the subject is presented with many low
frequency
tones intermixed with infrequent high
frequency
tones (e.g. lows tones occur five times as often as high tones), the high tones will evoke the P300 [45],P3aexperiments are often called oddballexperimentsreferringto theinfrequent
stimuli
being
rare and different from frequent stimuli.The P3b appears parietally when the subject is aware of a task relevant
stimulus. For example, ifthe subject is repeatedly presented letters of the alphabet oneletter at atimeand is given aspellingtask, the P300 willoccur
whenthe current letterthesubject wantsto'type'
[image:37.476.105.297.313.478.2]Bennington
[8]
demonstratedthe P300'samplitudeissmaller whenthe subject ispassivelyaware ofthestimulusvsactively attending to thestimulus(such
as countingwhen the stimulusappears) inoddball auditory and visual experi
ments. The P300's amplitude is alsosmaller and may disappear if the subject
is drowsy. The
latency
ofthe P300 increases with oldersubjects [45].Thesourcesiteforthe P300in thebrain isunknown;
however,
it isthoughttobe generatedin the middle ofthe temporallobe
(medial-temporal);
though,thisisunproven. Becausethe P300 isevoked
by
manydifferent tasks there maynot beone source generator [45].
Steady
State Visual Evoked Potential(SSVEP)
Steady
state visual evoked potentials(SSVEP)
arerhythmic waves that occuroccipitallywhenthe subject is
fixating
on aflashing
stimulus. Thewaves havethesame
frequency
astherepetition rate oftheflashing
stimulus. SSVEPsoccurwhenthe stimulus flashes 10 timesper second and up to62 timesper second.
Flashing
beyond 62 times persecond exceeds the average criticalfrequency
of photicdriving
(CFPD)
[45].Contingent Negative Variation
(CNV)
The contingent negative variation
(CNV)
signal occurs when a subject is required to respond to an imperative stimulus that occurs
following
a warningstimulus, i.e. itoccurs for expectation [45],
Typically,
the warningandimperativestimulus are separatedby
1-2 seconds,and the contingent negative variation
(CNV)
begins 400 ms after the warningstimulus, peaking up to -50/iV at 800ms [45].
Thesubject must expect andintend to respond to the imperative stimulus
forthe CNVtooccur [45].
BCIs based on ERPs
The P300's robustness across multiple individuals and the lack of trainingre
quired to utilize it makes it a desirable signal for BCIs. Donchin et al.
[24]
used theP300 inaspellingBCI. Subjectswerepresented a six-by-six matrix of
<![Figure 2.1: General BCI framework proposed by Mason and Birch [40]. Shows the flow ofinformation from the brain to the device and feedback from the device to the person.](https://thumb-us.123doks.com/thumbv2/123dok_us/125103.12127/24.476.109.434.103.237/figure-general-framework-proposed-mason-birch-ofinformation-feedback.webp)
![Figure 2.3: Projection neuron showing information flow. Used with permission [27].](https://thumb-us.123doks.com/thumbv2/123dok_us/125103.12127/26.476.160.386.97.401/figure-projection-neuron-showing-information-flow-used-permission.webp)
![Table 2.1: Brain imaging methods that can be used for BCI [27].](https://thumb-us.123doks.com/thumbv2/123dok_us/125103.12127/27.476.80.326.119.339/table-brain-imaging-methods-used-bci.webp)