rsos.royalsocietypublishing.org
Research
Cite this article:Irvine LG, Thums M, Hanson CE, McMahon CR, Hindell MA. 2017 Quantifying the energy stores of capital breeding humpback whales and income breeding sperm whales using historical whaling records.
R. Soc. open sci.4: 160290.
http://dx.doi.org/10.1098/rsos.160290
Received: 29 April 2016 Accepted: 17 February 2017
Subject Category:
Biology (whole organism)
Subject Areas:
ecology/physiology
Keywords:
bioenergetics, body condition, body lipid, oil yield, life history, cetacean
Author for correspondence:
Lyn G. Irvine
e-mail:lynette.irvine@utas.edu.au
Electronic supplementary material is available online at https://dx.doi.org/10.6084/m9. figshare.c.3709492.
Quantifying the energy
stores of capital breeding
humpback whales and
income breeding sperm
whales using historical
whaling records
Lyn G. Irvine
1
, Michele Thums
2
, Christine E. Hanson
3
,
Clive R. McMahon
1,4
and Mark A. Hindell
1
1Institute for Marine and Antarctic Studies, University of Tasmania, Hobart, Tasmania,
Australia
2Australian Institute of Marine Science and the Indian Ocean Marine Research Centre,
University of Western Australia (M096), Western Australia, Australia 3BMT Oceanica, Wembley, Western Australia, Australia
4Sydney Institute of Marine Science, Mosman, New South Wales, Australia
LGI ,0000-0001-9389-5402
Cetacean energy stores are known to vary according to life history, reproductive status and time of year; however, the opportunity to quantify these relationships is rare. Using a unique set of historical whaling records from Western Australia (1952–1963), we investigated energy stores of large cetaceans with differing life histories, and quantified the relationship between total body lipid and length for humpback
whales (Megaptera novaeangliae) (n=905) and sperm whales
(Physeter macrocephalus) (n=1961). We found that total body lipid increased with body length in both humpback and sperm whales, consistent with size-related energy stores. Male humpback whales stored 2.49 kl (15.6 barrels) (31.9–74.9%) more lipid than male sperm whales of equivalent length, to fuel their annual migration. Relative lipid stores of sperm whales (males) were constant throughout the year, while those of humpback whales varied with reproductive class and sampling date. Pregnant female humpback whales had higher relative energy stores than non-pregnant females and males (26.2% and 37.4%, respectively), to fuel the energy demands of gestation and lactation. Those that reached the sampling site later (en route to their breeding grounds) carried higher lipid stores than those that arrived earlier, possibly reflecting individual
2
rsos
.ro
yalsociet
ypublishing
.or
g
R.
Soc
.open
sc
i.
4
:160290
...
variation in residency times in the Antarctic feeding grounds. Importantly, longer pregnant females had relatively larger energy stores than the shorter pregnant females, indicating that the smaller individuals may experience higher levels of energetic stress during the migration fast. The relationships we developed between body lipid and length can be used to inform bioenergetics and ecosystem models when such detailed information is not available.
1. Introduction
To optimize their fitness, organisms must acquire and allocate resources over their lifetime in a way that maximizes individual survival and reproduction [1]. A range of life-history strategies have evolved to achieve this, with ‘capital breeding’ and ‘income breeding’ representing the extremes of a continuum in how individuals store and allocate maternal resources [1,2]. Capital breeders use stored energy for reproduction and survival, while income breeders use energy that is acquired on a continual basis, including during the reproductive period [3,4]. Energy storage enables the temporal and spatial separation of different activities such as feeding and breeding [2] and hence utilization of environments where resources such as food may be temporarily abundant, but where physical conditions may be unsuitable for successful reproduction [5,6]. The capital breeding strategy generally involves a life cycle that consists of periods of intensive feeding and fasting that are synchronized with the annual seasonal cycle [7–10]. For reproductive females, this strategy requires short periods of maternal care with high rates of energy flow to the young [11–13]. The income breeding strategy of continuous energy acquisition throughout the year enables longer periods of maternal care [12,13], but requires stable or predictable environments.
Among mammals, the capital breeding strategy is restricted to large animals such as bears, true seals and baleen whales, due to the extreme energy demands of lactation during fasting [12,14] and relatively low mass-specific energy requirements of large body size [15]. Cetaceans are theoretically ideal candidates for investigating energy storage strategies for different life histories, as their considerable body size enables large energy stores relative to reproductive demands [14]. However, in practice, this large body size combined with their marine existence prevents capture for measurement, making quantification of cetacean energy stores extremely difficult.
Among the cetaceans, baleen whales are typically capital breeders while toothed whales are generally
income breeders [13]. Many baleen whales, including humpbacks, move between highly productive
polar feeding grounds during summer and relatively unproductive subtropical breeding grounds in winter [16]. This strategy requires the accumulation and storage of sufficient energy reserves to meet the cost of growth, maintenance, locomotion and reproduction in the breeding grounds [2]. As reproductive costs are highest for breeding females, due to energy-expensive lactation [14], they require larger energy stores than males and non-pregnant females [16–18]. By contrast, toothed whales typically meet their energy demands throughout the year by continual foraging [13,19] and thus have no need to store large energy reserves. Consequently, the energy stores of capital and income breeders should differ: capital breeders (particularly pregnant females) should have high energy stores on departure from feeding grounds, followed by a continual decline in energy stores throughout the migration and the reproductive cycle (e.g. [20]), until return to their feeding grounds; income breeders should have relatively constant energy stores throughout the year, given adequate food resources.
In cetaceans, energy is stored as lipid in various depots throughout the body, initially in the blubber, and then in the bone, muscle and viscera [16,21]. Cetacean energetics studies have typically focused on the blubber layer as it is an important and easily measured lipid store (e.g. [22,23]). However, lipid storage in body tissues other than the blubber can be substantial [15,24,25] and should therefore also be considered. For example, muscle is a major lipid depot in both blue and fin whales [16], and bone in fin whales can store nearly as much lipid as the blubber [26]. Furthermore, analyses of the blubber layer can also be complicated by differences in thickness and lipid content at different sites along the body [25,27–29], with no apparent correlation between the two [30]. To obtain a complete picture of energy storage, lipid stores in all body tissues must ideally be accounted for.
We recently located a historical whaling dataset from the Cheynes Beach Whaling Station, on the south coast of Western Australia. This whaling station, located about halfway along the migratory corridor
of the Breeding Stock D (BSD) humpback whales [31], processed humpback whales that were hunted
3
rsos
.ro
yalsociet
ypublishing
.or
g
R.
Soc
.open
sc
i.
4
:160290
...
Carnarvon Whaling Station, Babbage Island, Carnarvon, Western Australia, August 2016, personal communication), and detailed records of oil yield, length and sex were recorded for the majority (94.7%) of individuals processed between 1952 and 1963. After this time, the station expanded and oil yields were reported as weekly tallies. The individual catch records from 1952–1963 provide a unique dataset of individual whale oil yield that can be used to quantify total body lipid stores of two large cetaceans. The records from 1953 and 1954 have been used previously to quantify the relationship between humpback whale oil yield and body length [32].
In this study, we extend these analyses [32] by using the individual catch records from Cheynes Beach Whaling Station to investigate how energy stores vary among cetaceans with different life histories. We compare and quantify total body lipid of humpback whales and sperm whales to test the hypothesis that energy stores of humpback whales are higher than those of sperm whales due to their different life-history strategies. We then investigate the variation in body lipid of each species separately, according to body length, reproductive class and time of year, and produce equations to quantify these relationships. We predict that the energy stores of the income breeding sperm whales will remain constant throughout the year, while that of the capital breeding humpback whales will vary with the energy demands of each reproductive class. Chittleborough [32] illustrated that pregnant female humpbacks had the largest energy stores due to the energy demands of pregnancy and lactation [16]. In addition to this, we predict that: (i) mature, non-pregnant females will have variable energy stores due to their varying reproductive states, i.e. some are recovering from lactation, while others are preparing for pregnancy; (ii) mature males will have higher energy stores than mature non-pregnant females, due to their need to compete for, and access, breeding females [33,34]; and (iii) immature whales will have higher energy stores than mature
males and mature non-pregnant females due to the high energy demands of growth [35]. Furthermore,
as humpback whales spend the summer accumulating and storing energy at a rate of 200 l per week [36] and all migrate at the same speed [37], we predict that individuals sampled at Cheynes Beach Whaling Station later in the season will have higher energy stores than those sampled earlier.
2. Material and methods
2.1. Data
Data were sourced from catch records that detailed 3000 individual whales processed at Cheynes Beach
Whaling Station (35°05S, 117°56E): 961 humpback whales caught between 1952 and 1963; 2039 sperm
whales caught between 1955 and 1963 (electronic supplementary material, table S1 in appendix S1). Humpback whales were captured over the continental shelf, in waters generally less than 50 m deep
(median=13 m), while sperm whales were captured over the continental slope in waters generally
200–3000 m deep (median=1067 m) (figure 1).
Humpback whales were caught between May and August, with highest catch numbers in July (figure 2). All humpbacks were caught on their northward migration between the Antarctic feeding grounds and lower latitude breeding grounds, as this population does not pass Cheynes Beach Whaling Station on their return journey to Antarctic waters [32]. Sperm whales were caught in all months of the year, with a small peak occurring between April and May and a larger peak between September and
November (figure 2). Sperm whale catches over summer (December–February) and winter (June–July)
were low (figure 2)—the winter catch being influenced by the local availability of humpback whales at this time of the year [38,39].
The catch records included individual details of catch date, location, whale length (recorded in feet), sex, oil yield (recorded in barrels) and length and sex of any fetus. We converted length into metres (1 ft=0.3048 m) and oil yield into kilolitres (1 barrel=0.16 kl [24]). All data were checked for potential ‘stretching’, whereby whalers reported an undersized whale as longer than the actual size to avoid an infraction of the minimum size regulation (35 feet or 10.7 m) [32,40]. We did this by constructing histograms of length and assessing the distribution to see if there was a notable peak around this minimum. Stretching was only identified for the female sperm whale data, and this was subsequently excluded from the analysis (accounting for 4% of total sperm whale data) (electronic supplementary material, figure S1 in appendix S2).
4
rsos
.ro
yalsociet
ypublishing
.or
g
R.
Soc
.open
sc
i.
4
[image:4.522.149.375.38.236.2] [image:4.522.160.365.281.519.2]:160290
...
–34.0 humpback whales
N sperm whales
–34.5
–35.0
–50
–50
–50
–2000 –200
–3000
–35.5
latitude
–36.0
–36.5
117.0 117.5
0 20 40 60 km
118.0 longitude
118.5 119.0 119.5
Figure 1.Location of Cheynes Beach Whaling Station (green asterisk), on the southwest coast of Western Australia, showing catch positions of humpback whales and sperm whales processed there between 1952 and 1963.
700
males females pregnant females
humpback whales
sperm whales
no. whales
no. whales
500
300
100 0
700
500
300
100 0
1 2 3 4 5 6 7 8 9 10 11 12
1 2 3 4 5 6
month
7 8 9 10 11 12
(b) (a)
Figure 2.Number of (a) humpback whales and (b) sperm whales of each reproductive class (males, females and pregnant females) processed at Cheynes Beach Whaling Station each month during the years 1952–1963.
Teede, Engineer (retired) Carnarvon Whaling Station, Babbage Island, Carnarvon, Western Australia, August 2016, personal communication). Once the oil was recovered, meat meal and whale solubles were produced from the remaining residue (raw products such as whale meat were not produced at the Cheynes Beach Whaling Station [41]). Owing to this extraction process, the oil yield records for sperm whales included sperm oil from the body as well as spermaceti oil from the spermaceti organ. The implications of this are discussed in a later section.
2.2. Statistical analyses
5
rsos
.ro
yalsociet
ypublishing
.or
g
R.
Soc
.open
sc
i.
4
:160290
...
model in the suite with Akaike’s information criterion corrected for small samples (AICc) and by their relative goodness-of-fit, the AICc weight (wAICc) [45,46]. The AIC weight varies from 0 (no support) to 1 (complete support) relative to all models in the set [46]. We also calculated the weights of the Bayesian information criterion (wBIC), and where the ranking did not agree withwAICc, we usedwBIC for model selection (as AIC frequently prefers a more complex model) [47]. Where models were within 2 AIC or BIC points of one another, they were considered equal and, under the principle of parsimony, the simplest model (one with the least terms) was selected. The proportion of variance in the response variable, explained for fixed factors (R2GLMM(m)) and fixed and random factors combined (R2GLMM(c)) [48], was used to quantify goodness-of-fit to the data [46].
2.2.1. Inter-species differences
We tested for differences in lipid stores between species by modelling total body lipid as a function of species and length. We had to restrict this analysis to males due to the unreliable length measurements of the female sperm whales. We also restricted the analysis to the length range common to both species (10.7 m (35 ft)–14.2 m (46.5 ft)) and the years where both sperm and humpback whales were processed (1956–1962).
2.2.2. Intra-species differences
2.2.2.1. Humpback whales
To test for differences in lipid stores between reproductive classes, we modelled the relationship between total body lipid, length and reproductive class (males, pregnant and non-pregnant females), using linear mixed-effects models. Male humpback whales less than 11.2 m (36.75 ft) and females less than 11.7 m (38.5 ft) were classified as immature whales after Chittleborough [32], and colour coded in the plots as a separate reproductive class. They could not be analysed separately as the range in their body length did not cover the range in body length for the other classes. Given that the data were heterogeneous, with residuals increasing with body length, variance was weighted according to a power relationship of length [49].
Humpback whale analyses were restricted to the months June–August and the years 1953–1962. Data from 1952 was excluded as factory efficiency in the first year of production was typically lower than
in subsequent years [32]; data from years 1954, 1963 and May were excluded due to low sample size
(electronic supplementary material, table S1 in appendix S1). In 1955 body lengths were reported in feet only, rather than feet and inches as in all other years. To account for this, the dataset was analysed with and without the 1955 data. The results were the same with both analyses and thus the 1955 data were included in the final analysis.
To test our hypotheses regarding variation in energy stores through time, we modelled total body lipid as a function of length and month of catch. We analysed each reproductive class separately due to the temporally staggered migration of this population [32]. In addition, as the number of pregnant females and immature whales arriving in June and August, respectively, were low, (electronic supplementary material, table S1 in appendix S1), we restricted the analysis of the pregnant females to the months of July and August and that of immature whales to June and July. The lipid stores of the males and non-pregnant females were modelled over the full data range.
2.2.2.2. Sperm whales
We examined the relationship between total body lipid, length and season for male sperm whales only as female sperm whales had unreliable length measurements (as mentioned above). We used season
(summer=December–February, autumn=March–May, winter=June–August, spring=September–
November) as a fixed effect in the models, rather than month (as in the humpback whale analyses) because sample sizes were not sufficient in all months (electronic supplementary material, table S1 in appendix S1). We restricted the analysis to 1956–1963 as the sample size in 1955 was too low (n=4; electronic supplementary material, table S1 in appendix S1).
3. Results
The restricted dataset that we used for body lipid analyses contained detailed information for 905
6
rsos
.ro
yalsociet
ypublishing
.or
g
R.
Soc
.open
sc
i.
4
[image:6.522.59.468.335.436.2]:160290
...
Table 1.Mean and standard deviation length, total body lipid and energy stores of whales processed at Cheynes Beach Whaling Station for 1953–1963 (the following data were excluded from the analysis: humpback whale data from 1952, 1954, 1963 and May; sperm whale data from 1955).
humpback whales sperm whales
reproductive
group n
length (m)
total body lipid (kl)
energy storage
(kl m−1) n
length (m)
total body lipid (kl)
energy storage (kl m−1)
males 358 12.08±0.62 7.58±1.26 0.63±0.08 1961 13.27±1.22 6.63±1.63 0.49±0.08 . . . .
non-pregnant females
218 12.76±0.75 8.71±1.64 0.68±0.11 n.a. n.a. n.a. n.a.
. . . . pregnant
females
73 13.07±0.76 11.30±2.63 0.86±0.16 n.a. n.a. n.a. n.a.
. . . .
immature 256 10.94±0.43 6.38±0.96 0.58±0.08 — — — —
. . . .
total 905 12.00±0.97 7.81±1.97 0.65±0.12 — — — —
. . . .
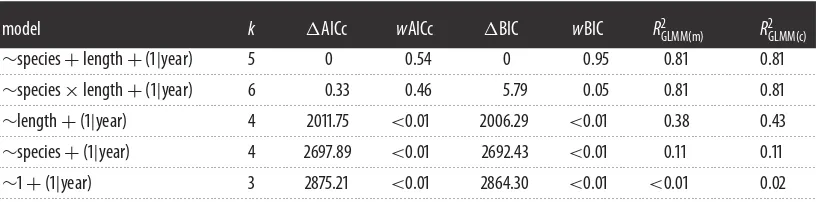
Table 2.Ranked (by AICc) linear mixed-effects models investigating the relationship between total body lipid and the explanatory fixed effects; species and length and the random effect of year. Shown are the number of parameters (k), the difference in AICc (Akaike’s information criterion corrected for small samples) for each model from the top-ranked model (AICc), the AICc model weight (wAICc), the difference in the BIC (Bayesian information criterion) (BIC), the BIC model weight (wBIC) and the proportion of variance explained by fixed (R2
GLMM(m)) and both fixed and random factors combined (R 2 GLMM(c)).
model k AICc wAICc BIC wBIC R2
GLMM(m) R
2 GLMM(c)
∼species+length+(1|year) 5 0 0.54 0 0.95 0.81 0.81
. . . .
∼species×length+(1|year) 6 0.33 0.46 5.79 0.05 0.81 0.81
. . . .
∼length+(1|year) 4 2011.75 <0.01 2006.29 <0.01 0.38 0.43
. . . .
∼species+(1|year) 4 2697.89 <0.01 2692.43 <0.01 0.11 0.11
. . . .
∼1+(1|year) 3 2875.21 <0.01 2864.30 <0.01 <0.01 0.02
. . . .
(n=358), 24.1% were non-pregnant females (n=218), 8.1% were pregnant females (n=73) and 28.3% were immature whales (n=256). All of the sperm whales were adult males (n=1961) (table 1).
Whales in the smaller size classes of both species were under-represented in the dataset as 10.7 m (35 ft) was the minimum catch length set by the International Whaling Commission (IWC), the regulatory body for the commercial whaling industry [50].
3.1. Inter-species differences
The top-ranked model included both species and length with no interaction term (wAICc=0.54) and
accounted for 81% of the variance explained (table 2). This demonstrated that total body lipid increased with length for both humpback and sperm whale males and the relationships had the same slope. Length (with the random factor year) accounted for 43% of the variation in body lipid; and the addition of species accounted for an additional 38% of the variation in body lipid (table 2). The relationship between body lipid and length for male humpback (y=1.28x– 7.88) and sperm whales (y=1.28x– 10.37) demonstrated that, for a given length, male humpback whales stored an average of 2.49 kl (15.6 barrels) (31.9–74.9%) more body lipid than male sperm whales (figure 3).
3.2. Intra-species differences
3.2.1. Humpback whales
7
rsos
.ro
yalsociet
ypublishing
.or
g
R.
Soc
.open
sc
i.
4
[image:7.522.157.368.263.458.2]:160290
...
12
humpback whales: y= 1.28x– 7.88
sperm whales: y= 1.28x– 10.37
10
8
total body lipid
(kl)
6
4
2
11.0 11.5 12.0 12.5 length (m)
13.0 13.5 14.0
Figure 3.Relationship between total body lipid and the predictors in the top-ranked model (length and species) from the suite of models tested to explain total body lipid. Shown are the raw values (sperm whale data were truncated to the maximum length of humpback whales), fitted lines and regression equations of the top-ranked model for each species.
20
15
10
male: y= 1.19x– 6.8
non-pregnant female: y= 1.31x– 7.9 pregnant female: y= 2.30x– 18.8
total body lipid
(kl)
5
8 10 12
length (m)
14 16
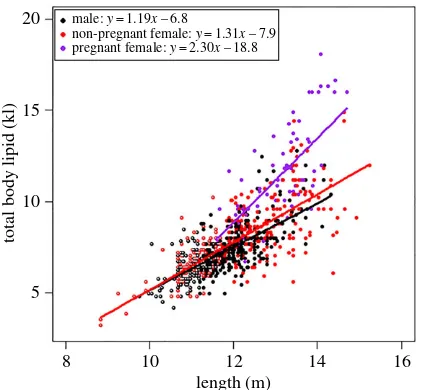
Figure 4.Relationship between humpback whale total body lipid and the predictors in the top-ranked model (length and reproductive class) from the suite of models tested to explain total body lipid. Shown are the raw values, fitted lines and regression equations for each reproductive class. Immature whales are colour-coded with non-filled centres: immature females with a red outline and immature males with a black outline.
Table 3.Ranked (by AICc) linear mixed-effects models investigating the relationship between humpback whale total body lipid and the fixed-effects length and reproductive class (class) and the random effect of year. See the caption fortable 2for a description of the table elements.
model k AICc wAICc BIC wBIC R2GLMM(m) R2GLMM(c)
∼length×class+(1|year) 9 0 1.00 0 1.00 0.69 0.72
. . . .
∼length+class+(1|year) 7 25.32 <0.01 15.78 <0.01 0.68 0.70
. . . .
∼length+(1|year) 5 158.42 <0.01 139.32 <0.01 0.59 0.61
. . . .
∼class+(1|year) 6 860.67 <0.01 846.35 <0.01 0.31 0.32
. . . .
∼1+(1|year) 4 1082.47 <0.01 1058.58 <0.01 <0.01 0.02
. . . .
pregnant females being the steepest (y=2.30x– 18.8), followed by non-pregnant females (y=1.31x– 7.9) and then males (y=1.19x– 6.8) (figure 4).
8
rsos
.ro
yalsociet
ypublishing
.or
g
R.
Soc
.open
sc
i.
4
[image:8.522.155.370.40.241.2]:160290
...
20
15
10
total body lipid
(kl)
5
11 12 13
length (m)
14 15
August July
Figure 5.Relationship between humpback whale total body lipid and the predictors in the top-ranked model (length and month) from the suite of models tested to explain total body lipid for pregnant females. Shown are the raw values and fitted lines for the pregnant females in the months of July and August.
non-pregnant females and mature males, respectively (table 1). Immature whales stored, on average, 7.9% and 14.7% less body lipid (per metre) than mature males and non-pregnant females, respectively (table 1).
The relationship between body lipid and length of the pregnant females varied according to month (wAICc=0.97) (table 4), with those sampled in August having a steeper slope than those sampled in July (figure 5). For the males, the model that included the interaction between length and month had equal support (within two AIC points) to the model with length alone when considering AICc; however, the model with length only had complete support when considering the BIC (table 4). Thus, there is little evidence for an effect of month. For the non-pregnant females and immature whales, the models
that included length and month had majority support when considering AICc (AICc=0.73 and 0.58,
respectively). However, for the former, the BIC selected the model with length only (BIC=0.85), and
for the latter, the BIC values showed equal support for the model length+month (BIC=0.45) and
length only (BIC=0.51). Thus there is minor evidence for an effect of month for the immature whales (slightly higher in month 7) (electronic supplementary material, figure S2 in appendix S2). The addition of month for all reproductive classes only accounted for an extra 2% of variance explained over and above length (table 4).
3.2.2. Sperm whales
We did not find any evidence for a seasonal effect on oil yield for the male sperm whales with the model with length only having majority support (wBIC=0.88) (table 5). The relationship between body lipid and length was described by the equationy=1.23x−9.8 (figure 6). Note that the previous equation provided for sperm whales (figure 3) was that for truncated data (to match that of humpbacks in order to meet the assumptions of the model being fitted).
4. Discussion
9
rsos
.ro
yalsociet
ypublishing
.or
g
R.
Soc
.open
sc
i.
4
[image:9.522.56.468.535.631.2]:160290
...
Table 4.Ranked (by AICc) linear mixed-effects models investigating the relationship, for each humpback whale reproductive class, between total body lipid and the fixed effects of length and month and the random effect of year. See the caption fortable 2for a description of the table elements.
model k AICc wAICc BIC wBIC R2
GLMM(m) R
2 GLMM(c)
males
. . . .
∼length×month+(1|year) 9 0 0.48 15.04 <0.01 0.47 0.57
. . . .
∼length+(1|year) 5 0.13 0.46 0 1.00 0.45 0.55
. . . .
∼length+month+(1|year) 7 4.23 0.06 11.71 <0.01 0.45 0.55
. . . .
∼month+(1|year) 6 189.42 <0.01 193.10 <0.01 0.02 0.15
. . . .
∼1+(1|year) 4 197.50 <0.01 193.55 <0.01 <0.01 0.14
. . . . non-pregnant females
. . . .
∼length+month+(1|year) 7 0 0.73 3.45 0.15 0.34 0.39
. . . .
∼length+(1|year) 5 3.07 0.16 0 0.85 0.32 0.36
. . . .
∼length×month+(1|year) 9 3.72 0.11 13.61 0.01 0.34 0.39
. . . .
∼1+(1|year) 4 58.06 <0.01 51.70 <0.01 <0.01 0.01
. . . .
∼month+(1|year) 6 60.63 <0.01 60.83 <0.01 <0.01 0.01
. . . . pregnant females
. . . .
∼length×month+(1|year) 7 0 0.97 0 0.84 0.55 0.74
. . . .
∼length+(1|year) 5 7.26 0.03 3.59 0.14 0.53 0.73
. . . .
∼length+month+(1|year) 6 9.65 0.01 7.85 0.02 0.52 0.71
. . . .
∼1+(1|year) 4 73.34 <0.01 67.73 <0.01 <0.01 <0.01
. . . .
∼month+(1|year) 5 75.56 <0.01 71.89 <0.01 <0.01 <0.01
. . . . immature
. . . .
∼length+month+(1|year) 6 0 0.58 0.25 0.45 0.43 0.50
. . . .
∼length×month+(1|year) 7 1.27 0.30 4.89 0.04 0.43 0.50
. . . .
∼length+(1|year) 5 3.15 0.12 0 0.51 0.41 0.48
. . . .
∼1+(1|year) 4 125.38 <0.01 118.82 <0.01 <0.01 0.03
. . . .
∼month+(1|year) 5 125.33 <0.01 122.38 <0.01 0.02 0.05
. . . .
Table 5.Ranked (by AIC) linear mixed-effects models investigating the relationships between total body lipid of male sperm whales and the fixed effects of length and season and the random effect of year. See the caption fortable 2for a description of table elements.
model k AICc wAICc BIC wBIC R2
GLMM(m) R
2 GLMM(c)
∼length×season+(1|year) 10 0 1.00 4.25 0.10 0.86 0.86
. . . .
∼length+season+(1|year) 7 20.74 <0.01 8.30 0.01 0.85 0.85
. . . .
∼length+(1|year) 4 29.14 <0.01 0 0.88 0.85 0.85
. . . .
∼season+(1|year) 6 3754.91 <0.01 3736.91 <0.01 0.02 0.02
. . . .
∼1+(1|year) 3 3785.29 <0.01 3750.57 <0.01 <0.01 <0.01
. . . .
stores than those that arrived earlier. We suggest that this is the result of delaying migration to maximize energy stores, by increasing time in the Antarctic foraging grounds [32,37]. Importantly, we developed equations describing the relationship between body lipid and length that can be used both for bioenergetics modelling (e.g. [51–53]) and for predicting body lipid in the extensive historical
whaling datasets held by the IWC [54], which typically include data on length and sex but not
10
rsos
.ro
yalsociet
ypublishing
.or
g
R.
Soc
.open
sc
i.
4
[image:10.522.154.371.39.235.2]:160290
...
12 male sperm whales:y= 1.23x– 9.8
10
8
6
total body lipid
(kl)
4
2
10 11 12 13 14 length (m)
15 16 17
Figure 6.Relationship between sperm whale total body lipid (males only) and length (the top-ranked model from the suite of models tested to explain total body lipid). Shown are the raw values, fitted line and regression equation. Note: the equation provided here is slightly different from that provided for sperm whales infigure 3, as here the data were not truncated.
4.1. Inter-species comparisons
The difference of 2.49 kl of body lipid that we found between male humpback and sperm whales was constant, regardless of body length, indicating that the total energy required during the breeding fast is the same for individuals of all sizes. Consistent with the theory of mass-specific metabolism [15], this demonstrates that the relative energy required for migration is greater for smaller individuals than larger individuals.
As the energy stores of the BSD humpback whales decline through the breeding season [32], and
those of sperm whales are stable throughout the year (table 5), the body lipid difference we found between the two species (2.49 kl) is probably an underestimate of the difference that would be expected when the humpbacks depart from their feeding grounds, carrying maximum energy stores. More specifically, the sampling location (Cheynes Beach Whaling Station) is located approximately 3000 km
north of the BSD feeding grounds [32] and, contrary to that observed in some other humpback whale
populations [55], there is no evidence of feeding during migration. Thus, the energy difference at the
beginning of the migration would be expected to decrease continually throughout the season [32],
until the humpback whales return to their feeding grounds and resume foraging. We suggest that by the time the humpback whales return to their Antarctic feeding grounds, the body lipid difference between humpback and sperm whales may be much smaller than 2.49 kl and possibly even close to zero. Unfortunately, it was not possible to investigate the energy stores of humpback whales on the return journey to their feeding grounds, as they do not pass Cheynes Beach Whaling Station on their southward migration, and oil yields of individual whales were not recorded at the other whaling stations along the Western Australian coast [32].
We can, however, estimate the maximum energy stores of humpback whales by using information
from the Antarctic feeding grounds. Ash [36] reported that humpback whales accumulate 200 l (1.25
barrels) of body lipid each week in the feeding grounds, and by mid-February (the last sampling date) humpback whales of average length 12.8 m (42 ft) stored an average of 6.77 kl (42.3 barrels) of body lipid. Although departure dates from the feeding grounds are not well known, humpback whales are believed to begin departing in mid–late April [37] through to May [54]. Accumulating body lipid at a rate of 200 l per week (1.25 barrels per week) [36], a 12.8 m (42 ft) humpback would store between 8.57 and 8.97 kl (53.5–56 barrels) of lipid by mid–late April. This compares with 8.43 kl (52.7 barrels) for a male humpback whale of the same size, sampled at Cheynes Beach between June and August (using the equation we
developed for male humpback whales;y=1.19x−6.8). This indicates that the maximum difference in
11
rsos
.ro
yalsociet
ypublishing
.or
g
R.
Soc
.open
sc
i.
4
:160290
...
information was provided by Ash about the sex of the whales processed in the Antarctic, or the variation in oil yield according to body length. Regardless of this, our study indicates that the energy required for the annual humpback whale migration is likely to be derived from at least 2.49 kl of body lipid.
In addition to sampling location, we must also account for differences in morphology between sperm and humpback whales, such as the oil-filled spermaceti organ of the sperm whale, which is not believed to play a role in energy storage [56–58]. Given that the sperm whale oil yield records from Cheynes Beach Whaling Station included spermaceti oil as well as sperm oil from the body [41], and that an average of 11% of the total oil produced from a sperm whale is spermaceti oil [57], the difference of 2.49 kl (15.6 barrels) of body lipid that we found between humpback and sperm whales is probably an underestimate of the difference in body lipid that is stored for energy utilization.
Interpreting differences in lipid stores between mysticetes and odontocetes, in terms of energetics, is a complex task due to differences in life history, behaviour, morphology and lipid storage. For example, humpback whales are a baleen whale specialized for long-distance migration. They have thick blubber that plays a role in thermoregulation, but is primarily an energy storage depot [21,28]. Sperm whales, by contrast, are specialized for deep diving. They have large heads that can weigh over one-third of their total body weight [57] and thick blubber that plays a role in structural support, thermoregulation and
energy storage [28]. Previous comparisons between baleen whales and sperm whales have been based
on body and tissue weights [28,59], and have demonstrated differences between slow-swimming baleen whales (humpback and right whales), fast-swimming baleen whales (blue, fin, sei and brydes) and sperm whales; more specifically, that: (i) the slow-swimming baleen whales are heavier per unit body length than sperm whales, while the fast-swimming baleen whales are lighter [59]; (ii) right whales contain greater proportions of blubber than sperm whales, while the fast-swimming baleen whales contain less [28,59] (unfortunately, no information was available for humpback whale blubber); (iii) the fast-swimming baleen whales have a higher proportion of muscle than sperm whales [28,59] and store the majority of their lipid stores in their muscle [16]. Sperm whales, in comparison, store almost no lipid in their muscle [28].
Measurement of total body lipid provides a useful method of comparing energy stores between species, as it enables inclusion of energy stores from all lipid depots, regardless of their function or storage capacity. Although this information is very valuable, there are some limitations of historical whaling data that need to be recognized: (i) the oil extracted from each whale is dependent on factory efficiency [32]; (ii) size classes and reproductive classes were not all equally represented as the whaling industry operated under regulations which included a minimum catch size of 10.7 m (35 ft) for humpback and sperm whales and also prohibited the taking of any calves and accompanying (lactating) females [50]; and (iii) at times, lengths of undersized whales were falsified to avoid infraction reports [32,40]. Despite these limitations, however, the catch records from Cheynes Beach Whaling Station provide an extremely valuable source of information on energy storage in cetaceans as they provide a measure of total body lipid for a large number of individual whales. Large, detailed datasets such as this are exceptionally rare and cannot be replicated in the modern era.
4.2. Intra-species comparisons
4.2.1. Sperm whales
Sperm whales are income breeders that accrue regular energetic ‘income’ [39,60] and adjust their foraging rate according to energy demands [61]. The energy stores of the male sperm whales in this study were fairly consistent throughout the year, indicating that there was adequate food supply to satisfy their energetic demands year-round. There was no evidence of seasonal energy storage such as that found in other income breeders like long-finned pilot whales, which store energy in winter for use in reproduction during spring and summer [62].
12
rsos
.ro
yalsociet
ypublishing
.or
g
R.
Soc
.open
sc
i.
4
:160290
...
4.2.2. Humpback whales
Baleen whale energy stores have been shown to vary according to reproductive status [16,18,32,64–66], with pregnant blue and fin whales accumulating 20–25% more lipid than resting females [16], to satisfy the high energy demands of gestation and lactation [13,16]. Consistent with this, pregnant female humpback whales in this study stored an average of 26.2% and 37.4% more body lipid than non-pregnant females and males, respectively. Interestingly, our body lipid–length equations illustrate that the longer pregnant females stored relatively more energy than the shorter pregnant females, thus having more energy to transfer to their offspring [13]. Maximizing energy stores is critical for capital breeders, who must trade off their own body condition to maximize offspring survival [17,67]. Maternal energy stores have been shown to influence fecundity [68], fetal growth [67], weaning mass [69,70] and, thus, ultimately survival [70,71]. Large maternal energy stores enable longer fasting periods for the mothers [72,73], which in turn provide calves with a thermoregulatory benefit of longer duration in the warm waters of their breeding areas [15]. The relatively low energy stores of the smaller pregnant females in this study suggest that they will be more vulnerable to nutritional stress during the migration fast, particularly after commencing lactation [74], and will probably produce smaller calves with lower survival rates.
Hypothesis (i): mature, non-pregnant females will have variable energy stores due to their varying reproductive states.
As expected, the relative energy stores of the mature non-pregnant females exhibited high variation, due to their different reproductive states [16–18,23,66]. Females in this study presumably include individuals preparing for pregnancy, resting females and those that had recently terminated lactation. Lactating females generally have the lowest energy stores in the population [16–18,66], while those preparing for pregnancy tend to have the highest [23]. Although whaling industry regulations restricted the capture of lactating females accompanying calves [50] (thus preventing inclusion in this dataset), females with weaned calves were allowed to be captured. Given that lactation is generally terminated at the end of June [75], females that recently terminated lactation may have been caught during July and August and thus included in this study.
Hypothesis (ii): mature males will have higher energy stores than mature non-pregnant females, due to their need to compete for, and access, breeding females.
The relative energy stores of the males were similar to those of the non-pregnant females, suggesting that their energy demands over the breeding season are also similar. Contrary to our expectations, there was no evidence to suggest that the males stored higher energy reserves than females to fuel the competitive behaviours observed in the breeding grounds [34,76]. Male energy stores may be driven by a trade-off between energy accumulation in the feeding grounds and time maximization, and hence mating opportunities, in the breeding grounds [77]. It has been shown in other migratory species that males in good condition that reach the breeding grounds first have higher rates of breeding success [78,79]. Thus, the decision for male humpback whales to depart the feeding grounds may be based on accumulating a ‘sufficient’ or ‘ideal’ level of energy stores, rather than maximizing energy stores.
Hypothesis (iii): immature whales will have higher energy stores than mature males and mature non-pregnant females due to the high energy demands of growth.
It is generally accepted that immature mammals, including baleen whales, have greater energy demands than adults due to the energetic costs of body growth [35,80,81] and high mass-specific metabolic demands [12]. The relatively low energy stores of the immature whales in this study, in comparison with all other reproductive classes, suggest that they will be more prone to nutritional stress during the migration fast than mature whales. This appears to be supported by stranding data from the BSD population, which show that the majority of strandings along the migratory corridor are immature whales in generally poor body condition [82].
Hypothesis (iv): individuals sampled at Cheynes Beach Whaling Station later in the season will have higher energy stores than those sampled earlier, as they spend the summer accumulating and storing energy at a rate of 200 l per week, and all migrate at the same speed.
13
rsos
.ro
yalsociet
ypublishing
.or
g
R.
Soc
.open
sc
i.
4
:160290
...
grounds [32,37,83], and thus drive the temporally staggered migration observed in humpback whale populations around the globe [32,77,83]. Our current understanding is that lactating females reside in the foraging grounds for approximately 4.5 months; immature animals, mature non-pregnant females and mature males stay for approximately 5.5 months; and pregnant females remain for about 6.5 months [37]. Our investigations of temporal differences in body lipid within each reproductive group provide evidence of individual variation in residency times in the feeding grounds coupled with an effect on energy stores. In particular, pregnant females sampled at Cheynes Beach Whaling Station later in the season had higher energy stores, on average, than those sampled earlier. As there is no evidence of differences in migration speed [83], arrival date along the Australian coast appears to reflect the departure date from the Antarctic, which in turn reflects residency times in the feeding grounds. Given that humpback whales accrue 200 l of body lipid per week in the feeding grounds [36], and it takes approximately three months for the entire migratory stream to pass Cheynes Beach Whaling Station en routeto the breeding grounds [32], an increase in energy stores with sampling date is perhaps not surprising. Such an increase, however, has not been documented previously, and is the opposite of
what may typically be expected in a capital breeding population. For example, Chittleborough [32]
demonstrated that lipid stores of the BSD humpback whale population decreased during the breeding season, by sampling the population at a fixed point (Carnarvon Whaling Station: 24°53S, 113°38E; approximately 1100 km north of Cheynes Beach Whaling Station) during two different stages of the migration (northbound and southbound). This sampling regime described variation in energy stores betweenthe northbound and southbound migratory streams that resulted from an estimated six-week difference in fasting duration [31,83], plus variation within the migratory streams due to variable residency times in the Antarctic feeding grounds. By contrast, our sampling regime describes variation in energy storeswithinthe northbound migratory stream that are due solely to varying residency times in the Antarctic foraging grounds. Understanding the differences between these two sampling regimes is crucial, as they have significant effects on the results and thus on our interpretation of energy store variation during the breeding season.
Interestingly, our finding of an energetic benefit (for the pregnant females) from extra time in the feeding grounds appears to be restricted to the larger (longer) individuals. The relatively low body lipid stores of the smaller (shorter) pregnant females sampled later in the season may demonstrate their inferior energy storage capabilities due to small body size, size-related foraging efficiency [84] or perhaps late arrival in the feeding grounds. Given that small body size appears to increase vulnerability to nutritional stress during the migration fast [82], the additional energetic demands of reproduction [16] most likely renders the smaller breeding females (and their calves) as the most vulnerable component of the population during the annual migration.
5. Conclusion
The unique data summarized here demonstrate that capital breeding humpback whales store substantially more body lipid than income breeding sperm whales to fuel their annual migration, and that the energy stores of capital breeders are driven by a combination of body size, reproductive status and time spent in the feeding grounds. Pregnant female humpback whales delay their departure from the feeding grounds to maximize energy stores and satisfy the high costs of gestation and lactation. The smaller pregnant females, however, do not accumulate as much energy as the larger females, and are thus more vulnerable to nutritional stress during migration. Our study has provided new insights into the life-history strategies of large cetaceans, and the relationships we have quantified will be useful in developing ecosystem and bioenergetics models, and in understanding the potential impacts of environmental change. Moreover, the data we present here are particularly important given that such a large and detailed dataset on cetacean energy stores will probably never be collected again.
Data accessibility. Summary data are available in appendix S1 in the electronic supplementary material. Raw data
have been made available at the Australian Institute of Marine Science Data Centre (http://data.aims.gov.au/
metadataviewer/uuid/3881b45c-2fdf-40c8-b0ce-dd6de3cb33b7) [85].
Authors’ contributions. L.G.I. located the dataset. L.G.I., M.T. and M.A.H. conceived and designed the study, carried out the statistical analysis and interpreted the data. L.G.I. drafted the manuscript, with all authors contributing to its writing. All authors gave their final approval for publication.
Competing interests. The authors have no competing interests.
14
rsos
.ro
yalsociet
ypublishing
.or
g
R.
Soc
.open
sc
i.
4
:160290
...Acknowledgements. We are grateful to the Cape Conservation Group (Exmouth) for introducing us to B. Teede, to whom we are indebted for showing us the humpback whale catch records from the NorWest Whaling Company and providing valuable information about the commercial whaling era. Without this, the data used in this research would remain hidden away in the historical archives. We thank J. Bannister for providing catch records and other information about sperm whales. We also thank P. Clapham, D. Costa and an anonymous reviewer for their comments and suggestions which helped improve the manuscript. This research was only possible due to the dedicated early work of J. Bannister and the late G. Chittleborough.
References
1. Stearns SC. 1989 Trade-offs in life-history evolution.
Funct. Ecol.3, 259–268. (doi:10.2307/2389364) 2. Jönsson KI. 1997 Capital and income breeding as
alternative tactics of resource use in reproduction.
Ookos78, 57–66. (doi:10.2307/3545800) 3. Stearns SC. 1992The evolution of life histories.
Oxford, UK: Oxford University Press. 4. Stephens PA, Boyd IL, McNamara JM, Houston AI.
2009 Capital breeding and income breeding: their meaning, measurement, and worth.Ecology90, 2057–2067. (doi:10.2307/25592722) 5. Alerstam T, Hedenström A, Åkesson S. 2003
Long-distance migration: evolution and determinants.Oikos103, 247–260. (doi:10.1034/j.1600-0706.2003.12559.x) 6. Dingle H, Drake VA. 2007 What is migration?
Bioscience57, 113–121. (doi:10.1641/B570206) 7. Bertram DF, Mackas DL, McKinnell SM. 2001 The
seasonal cycle revisited: interannual variation and ecosystem consequences.Progr. Oceanogr.49, 283–307. (doi:10.1016/s0079-6611(01)00027-1) 8. Both C, Van Turnhout CAM, Bijlsma RG, Siepel H,
Van Strien AJ, Foppen RPB. 2010 Avian population consequences of climate change are most severe for long-distance migrants in seasonal habitats.Proc. R. Soc. B277, 1259–1266. (doi:10.1098/rspb.2009. 1525)
9. Visser ME, Both C, Lambrechts MM. 2004 Global climate change leads to mistimed avian reproduction.Adv. Ecol. Res.35, 89–110. (doi:10.1016/S0065-2504(04)35005-1) 10. Visser F, Hartman KL, Pierce GJ, Valavanis VD,
Huisman J. 2011 Timing of migratory baleen whales at the Azores in relation to the North Atlantic spring bloom.Mar. Ecol. Progr. Ser.440, 267–279. (doi:10.3354/meps09349)
11. Costa DP. 1991 Reproductive and foraging energetics of high latitude penguins, albatrosses and pinnipeds: implications for life history patterns.
Am. Zool.31, 111–130. (doi:10.2307/3883463) 12. Costa DP. 1993 The relationship between
reproductive and foraging energetics and the evolution of the Pinnipedia.Symp. Zool. Soc. Lond.
66, 293–314.
13. Oftedal OT. 1997 Lactation in whales and dolphins: evidence of divergence between baleen- and toothed-species.J. Mamm. Gland Biol. Neoplasia2, 205–230. (doi:10.1023/A:1026328203526) 14. Oftedal OT. 1993 The adaptation of milk secretion to
the constraints of fasting in bears, seals, and baleen whales.J. Dairy Sci.76, 3234–3246.
(doi:10.3168/jds.S0022-0302(93)77660-2) 15. Brodie PF. 1975 Cetacean energetics, an overview of
intraspecific size variation.Ecology56, 152–161. (doi:10.2307/1935307)
16. Lockyer C. 1981 Growth and energy budgets of large baleen whales from the Southern Hemisphere.
Mammals in the Sea. vol. 3, FAO Fisheries Series, No. 5, pp. 379–487.
17. Bradford AL, Weller DW, Punt AE, Ivashchenko YV, Burdin AM, VanBlaricom GR, Brownell RL. 2012 Leaner leviathans: body condition variation in a critically endangered whale population.J. Mamm.
93, 251–266. (doi:10.1644/11-mamm-a-091.1) 18. Perryman WL, Lynn MS. 2002 Evaluation of the
nutritive condition and reproductive status of migrating gray whales (Esrichtius robustus) based on analysis of photogrammetric data.J. Cetacean Res. Manage.4, 155–164.
19. Lockyer C. 1981 Estimates of growth and energy budget for the sperm whale,Physeter catodon.
Mammals in the Sea. vol. 3, FAO Fisheries Series, pp. 489–504.
20. Rice DW, Wolman AA. 1971The life history and ecology of the gray whale(Eschrichtius robustus). Stillwater, OK: American Society of Mammalogists. 21. Slijper EJ. 1962Whales. London, UK: Hutchinson. 22. Mellish J-AE, Tuomi PA, Horning M. 2004
Assessment of ultrasound imaging as a noninvasive measure of blubber thickness in pinnipeds.J. Zoo Wildl. Med.35, 116–118. (doi:10.1638/03-028) 23. Miller CA, Reeb D, Best PB, Knowlton AR, Brown
MW, Moore MJ. 2011 Blubber thickness in right whalesEubalaena glacialisandEubalaena australis
related with reproduction, life history status and prey abundance.Mar. Ecol. Progr. Ser.438, 267–283. (doi:10.3354/meps09174)
24. Tonnessen JN, Johnsen AO. 1982The history of modern whaling. London, UK: C. Hurst & Co. 25. Lockyer CH, McConnell LC, Waters TD. 1985 Body
condition in terms of anatomical and biochemical assessment of body fat in North Atlantic fin and sei whales.Can. J. Zool.63, 2328–2338. (doi:10.1139/ z85-345)
26. Tomilin AG. 1957 Mammals of the USSR and adjacent countries.Cetacea IX: English Translation, Israel Program for Scientific Translations.1967, 717p.
27. Slijper EJ. 1948 On the thickness of the layer of blubber in Antarctic blue and fin whales.Proc. Koninklijke Nederlandse Akademie van Wetenschappen51, 1033–1316.
28. Lockyer C. 1991 Body composition of the sperm whale,Physeter catodon, with special reference to the possible functions of fat depots.J. Mar. Res. Inst. Reykjavik12, 1–24.
29. Naess A, Haug T, Nilssen EM. 1998 Seasonal variation in body condition and muscular lipid contents in northeast Atlantic minke whale
Balaenoptera acutorostrata.Sarsia83, 211–218. (doi:10.1080/00364827.1998.10413682) 30. Evans K, Hindell MA, Thiele D. 2003 Body fat and
condition in sperm whales,Physeter macrocephalus, from southern Australian waters.Comp. Biochem.
Physiol. Part A: Mol. Integr. Physiol.134, 847–862. (doi:10.1016/s1095-6433(03)00045-x) 31. Jenner KCS, Jenner MNM, McCabe KA. 2001
Geographical and temporal movements of humpback whales in Western Australian waters.
APPEA Journal, 749–765
32. Chittleborough R. 1965 Dynamics of two populations of the humpback whale,Megaptera novaeangliae(Borowski).Mar. Freshw. Res.16, 33–128. (doi:10.1071/MF9650033)
33. Tyack P, Whitehead H. 1982 Male competition in large groups of wintering humpback whales.
Behaviour83, 132–154. (doi:10.1163/156853 982X00067)
34. Baker CS, Herman LM. 1984 Aggressive behavior between humpback whales (Megaptera novaeangliae) wintering in Hawaiian waters.
Can. J. Zool.62, 1922–1937. (doi:10.1139/z84-282) 35. Fortune SME, Trites AW, Rosen DAS, Mayo CA,
Hamilton PK. 2013 Energetic requirements of North Atlantic right whales and the implications for species recovery.Mar. Ecol. Progr. Ser.478, 253–272. (doi:10.3354/meps10000)
36. Ash CE. 1957 Weights and oil yields of Antarctic humpback whales.Norsk Hvalfangst-tidende46, 569–573.
37. Dawbin WH. 1966 The seasonal migratory cycle of humpback whales. InWhales, dolphins, and porpoises(ed. KS Norris), pp. 145–170. Berkeley, CA: University of California Press.
38. Bannister JL. 1964Australian whaling 1963 catch results and research. Cronulla, Sydney: C.S.I.R.O. Division of Fisheries and Oceanography. 39. Bannister JL. 1968 An aerial survey for sperm whales
off the coast of Western Australia 1963–1965.
Mar. Freshw. Res.19, 31–52. (doi:10.1071/MF96 80031)
40. Clapham PJ, Ivashchenko YV. 2016 Stretching the truth: length data highlight falsification of Japanese sperm whale catch statistics in the Southern Hemisphere.R. Soc. open sci.3, 160506, 1–6. (doi:10.1098/rsos.160506)
41. Frost SS. 1978 Whales and whaling volume 1. Report of the independent inquiry conducted by the Hon. Sir Sydney Frost. Canberra, Australia: Australian Government Publishing Service.
42. R Development Core Team. 2013R: a language and environment for statistical computing. Vienna, Austria: R Foundation for Statistical Computing. 43. Pinheiro J, Bates D, DeBroy S, Sarkar D, R Core Team.
2013nlme: linear and nonlinear mixed effects models. R package version 3.1-109.
44. Barton K. 2014MuMIn: multi-model inference. R package version 1.10.5.
15
rsos
.ro
yalsociet
ypublishing
.or
g
R.
Soc
.open
sc
i.
4
:160290
...observations, and comparisons.Behav. Ecol. Sociobiol.65, 23–35. ( doi:10.1007/s00265-010-1029-6)
46. Burnham KP, Anderson DR. 2002Model selection and multi-model inference: a practical information-theoretic approach, 2nd edn. New York, NY: Springer.
47. Link WA, Barker RJ. 2006 Model weights and the foundations of multimodel inference.Ecology87, 2626–2635. (doi:10.1890/0012-9658(2006) 87[2626:MWATFO]2.0.CO;2)
48. Nakagawa S, Schielzeth H. 2013 A general and simple method for obtainingR2from generalized linear mixed-effects models.Methods Ecol. Evol.4, 133–142. (doi:10.1111/j.2041-210x.2012. 00261.x)
49. Zuur AF, Ieno EN, Walker NJ, Saveliev AA, Smith GM. 2009Mixed effects models and extensions in ecology with R. Berlin, Germany: Springer.
50. IWC. (International Whaling Commission). 1950 International Convention for the Regulation of Whaling, 1946.
51. Christiansen F, Lusseau D, Rasmussen M. 2013 Whale watching disrupts feeding activities of minke whales on a feeding ground.Mar. Ecol. Progr. Ser.
478, 239–251. (doi:10.3354/meps10163) 52. Christiansen F, Víkingsson GA, Rasmussen MH,
Lusseau D. 2013 Minke whales maximise energy storage on their feeding grounds.J. Exp. Biol.216, 427–436. (doi:10.1242/jeb.074518)
53. Villegas-Amtmann S, Schwarz LK, Costa DP, Sumich JL, Peters DPC. 2015 A bioenergetics model to evaluate demographic consequences of disturbance in marine mammals applied to gray whales.
Ecosphere6, part183. ( doi:10.1890/ES15-00146.1)
54. Allison C. 2013 IWC individual catch database Version 5.5; 12 February 2013.
55. Stamation KA, Croft DB, Shaughnessy PD, Waples KA. 2007 Observations of humpback whales (Megaptera novaeangliae) feeding during their southward migration along the coast of southeastern New South Wales, Australia: identification of a possible supplemental feeding ground.Aquat. Mamm.33, 165–174. (doi:10.1578/AM.33.2.2007.165)
56. Clarke MR. 1970 Function of the spermaceti organ of the sperm whale.Nature228, 873–874. (doi:10.1038/228873a0)
57. Clarke MR. 1978 Structure and proportions of the spermaceti organ in the sperm whale.J. Mar. Biol. Assoc. UK58, 1–17. (doi:10.1017/S0025315400024371) 58. Morris RJ. 1975 Further studies into the lipid
structure of the spermaceti organ of the sperm whale (Physeter catodon).Deep-Sea Res. Oceanogr. Abstracts22, 483–489. ( doi:10.1016/0011-7471(75)90021-2)
59. Lockyer C. 1976 Body weights of some species of large whales.J. Conseil36, 259–273. (doi:10.1093/ icesjms/36.3.259)
60. Bannister J. 2008Great whales. Collingwood, Australia: CSIRO Publishing.
61. Lockyer C. 2007 All creatures great and smaller: a study in cetacean life history energetics.J. Mar. Biol. Assoc. UK87, 1035–1045. (doi:10.1017/S0025 315407054720)
62. Lockyer C. 1993 Seasonal changes in body fat condition of northeast Atlantic pilot whales, and the biological significance.Rep. Int. Whaling Commission. Special Issue14, 325–350. 63. Gambell. 1972 Sperm whales off Durban.Disc. Rep.
35, 199–358.
64. Lockyer C. 1986 Body fat condition in Northeast Atlantic fin whales,Balaenoptera physalus, and its relationship with reproduction and food resource.
Can. J. Fish. Aquat. Sci.43, 142–147. (doi:10.1139/ f86-015)
65. Lockyer C. 1987 The relationship between body fat, food resource and reproductive energy costs in North Atlantic fin whales (Balaenoptera physalus).
Symp. Zool. Soc. Lond.57, 343–361.
66. Miller CA, Best PB, Perryman WL, Baumgartner MF, Moore MJ. 2012 Body shape changes associated with reproductive status, nutritive condition and growth in right whalesEubalaena glacialisandE. australis.Mar. Ecol. Progr. Ser.459, 135–156. (doi:10.3354/meps09675)
67. Christiansen F, Víkingsson GA, Rasmussen MH, Lusseau D. 2014 Female body condition affects foetal growth in a capital breeding mysticete.Funct. Ecol.28, 579–588. (doi:10.1111/1365-2435.12200) 68. Williams R, Vikingsson GA, Gislason A, Lockyer C,
New L, Thomas L, Hammond PS. 2013 Evidence for density-dependent changes in body condition and pregnancy rate of North Atlantic fin whales over four decades of varying environmental conditions.
ICES J. Mar. Sci.70, 1273–1280. (doi:10.1093/icesjms/fst059)
69. Arnbom T, Fedak MA, Boyd IL, McConnell BJ. 1993 Variation in weaning mass of pups in relation to maternal mass, postweaning fast duration, and weaned pup behaviour in southern elephant seals (Mirounga leonina) at South Georgia.Can. J. Zool.
71, 1772–1781. (doi:10.1139/z93-252)
70. Wheatley KE, Bradshaw CJA, Davis LS, Harcourt RG, Hindell MA. 2006 Influence of maternal mass and condition on energy transfer in Weddell seals.J. Anim. Ecol.75, 724–733. (doi:10.1111/j.1365-2656. 2006.01093.x)
71. McMahon CR, Burton HR, Bester MN. 2000 Weaning mass and the future survival of juvenile southern elephant seals,Mirounga leonina, at Macquarie Island.Antar. Sci.12, 149–153. (doi:10.1017/S0954 102000000195)
72. Lindstedt SL, Boyce MS. 1985 Seasonality, fasting endurance, and body size in mammals.Am. Nat.
125, 873–878. (doi:10.1086/284385) 73. Millar JS, Hickling GJ. 1990 Fasting endurance and
the evolution of mammalian body size.Funct. Ecol.
4, 5–12. (doi:10.2307/2389646)
74. Lockyer C. 1984 Review of baleen whale (Mysticeti) reproduction and implications for management.
Rep. Int. Whaling Commission. Special Issue6, 27–50.
75. Chittleborough R. 1958 The breeding cycle of the female humpback whale,Megaptera nodosa
(Bonnaterre).Mar. Freshw. Res.9, 1–18. (doi:10.1071/MF9580001)
76. Spitz SS, Herman LM, Pack AA, Deakos MH. 2002 The relation of body size of male humpback whales to their social roles on the Hawaiian winter grounds.
Can. J. Zool.80, 1938–1947. (doi:10.1139/z02-177) 77. Craig AS, Pack AA, Herman LM, Gabriele CM. 2003
Migratory timing of humpback whales (Megaptera novaeangliae) in the central North Pacific varies with age, sex and reproductive status.Behaviour
140, 981–1001. (doi:10.1163/1568539033225 89605)
78. Marra PP, Hobson KA, Holmes RT. 1998 Linking winter and summer events in a migratory bird by using stable-carbon isotopes.Science282, 1884–1886. (doi:10.1126/science.282.5395.1884) 79. Smith RJ, Moore FR. 2005 Arrival timing and
seasonal reproductive performance in a long-distance migratory landbird.Behav. Ecol. Sociobiol.57, 231–239. ( doi:10.1007/s00265-004-0855-9)
80. Brody S. 1945Bioenergetics and growth. New York, NY: Hafner Press.
81. Worthy GAJ. 1987 Metabolism and growth of young harp and grey seals.Can. J. Zool.65, 1377–1382. (doi:10.1139/z87-217)
82. Coughran DK, Gales NJ, Smith HC. 2013 A note on the spike in recorded mortality of humpback whales (Megaptera novaeangliae) in Western Australia.
J. Cetacean Res. Manage.13, 105–108. 83. Dawbin WH. 1997 Temporal segregation of
humpback whales during migration in Southern Hemisphere waters.Memoirs Queensland Museum
42, 105–138.
84. Goldbogen JA, Potvin J, Shadwick RE. 2010 Skull and buccal cavity allometry increase mass-specific engulfment capacity in fin whales.Proc. R. Soc. B
277, 861–868. (doi:10.1098/rspb.2009.1680) 85. Irvine LG, Thums M, Hanson C, McMahon CR, Hindell