Ocean Deoxygenation,
a paleo-proxy perspective
by
Axel Durand,
M.Sc
Submitted in partial ful lment of the requirements for the degree of Doctor of Philosophy
Under the supervison of Zanna Chase, Taryn Noble, Ashley Townsend and Nathan Bindo
WI
AA
oxygen
LGM
Holocene
na
ec
O
nr
eh
tu
oS
dn
ala
eZ
we
N
authigenic
Uranium
yti
vit
cu
do
rP
xo
de
R
mu
in
eh
R
depleted
change
no
it
al
uc
ric
yh
par
go
na
ec
oel
aP
climate change
Future
ts
aP
sre
vir
d
Ocean deoxygenation: a paleo-proxy perspective
by
Axel Durand
Abstract
The oceans are losing oxygen because of global warming and the consequences of this ocean
deoxygenation are far reaching, particularly for aerobic marine organisms that depend on
dissolved oxygen to live. Furthermore, in oxygen-deficient waters, ocean deoxygenation
promotes global warming through the microbial production of nitrous oxide, a powerful
greenhouse gas. The study of the Southern Ocean deoxygenation is particularly essential
because through global circulation, it supplies dissolved oxygen to all ocean basins.
More-over, this region is particularly affected by deoxygenation and accounts for one quarter of
the total oxygen losses observed since 1970. However, future oxygenation trends remain
unclear.
To help forecast future Southern Ocean deoxygenation accurately, a precise knowledge
of historical oxygen trends and their drivers is essential. One way to do this is to use
sediments which record and preserve changes in the water column above them and offer a
window on past conditions in the oceans. In this thesis a set of 12 sediment cores retrieved
from the New Zealand region (Campbell Plateau, Challenger Plateau, Solander Trough)
was used to investigate dissolved oxygen changes in the southwest Pacific sector of the
Southern Ocean since the last glacial maximum (LGM) and the potential factors driving
these changes. Moreover, because remineralisation by bacteria at depths constitutes the
main oxygen sink in the ocean interior, export production (EP) changes since the LGM
were also investigated directly.
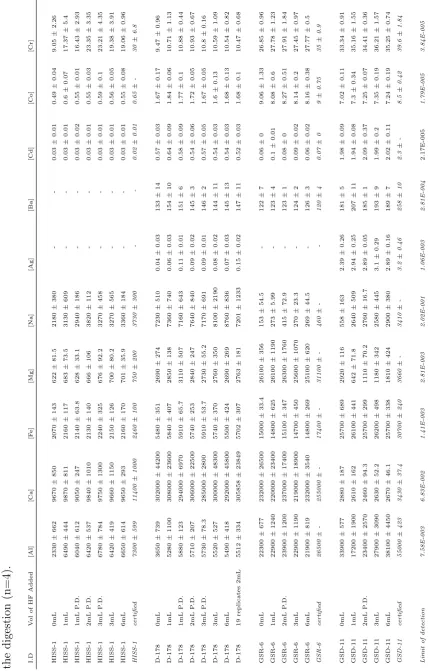
Sediment composition has to be quantified in order to identify potential changes in
oxygenation and EP. This requires the complete digestion (transformation of solid
mate-rial to solution) of the sediments. Previous studies have shown that microwave-assisted
digestion of marine sediments using a mix of hydrochloric, nitric and hydrofluoric acids
provides a complete, rapid and relatively easy digestion method. However, due to the
generated insoluble fluoride precipitate and failed to complete their digestions. Chapter
2 addresses this problem and shows that a pre-digestion step, exposing sediments to
con-centrated HCl at 150◦C before microwave digestion helps eliminate precipitate formation,
leading to the complete digestion of carbonate rich sediments. This method was tested
on four different certified standards with a wide range of carbonate contents. Overall,
around 90% recovery across 20 elements analysed was observed.
In this work, Inductively Coupled Plasma Mass Spectrometry (ICP-MS) was used as
the analytical method of choice for broad screen multi-element analysis. However, for
the determination of radiogenic isotopes of extremely low abundance, a special analytical
methodology was introduced for the first time in our laboratories. Chapter 3 details
the isotopic dilution method employed as well as the incremental analytical developments
necessary to measure precisely low abundance isotopes, such as 230-Thorium (230T h),
using a single collector Sector Field-ICP-MS. The importance of factors such as
instru-mental detector dead time on the precision of the isotopic ratio measurements was also
investigated. Furthermore, the benefit of enhanced sensitivity through the activation of
the instrument Platinum guard electrode in combination with a desolvating nebuliser is
described. The precision of the measurements produced was assessed through
intercom-parison with two other techniques. Overall, measurements of 238-Uranium (238U),232T h,
and 230T h from sediment digests were achieved with deviations of less than 5%.
In chapter 4, 230T h-normalised opal, organic carbon, excess barium and calcium
carbonate fluxes were used to investigate changes in EP in the southwest Pacific
sec-tor of the Southern Ocean since the LGM. The variations of these fluxes reveal that in
Subtropical Waters (STW) and in the Subantarctic Zone (SAZ), EP largely remained
unchanged since the LGM. Only one of the four sites studied shows increased EP during
the deglaciation. At this site it is proposed that a shift in the position of the highly
productive subtropical front to above the core site drove the increase in EP. In STW, it
is suggested that nitrogen has been limiting any EP increase. In the SAZ, it is proposed
that even though the increased glacial dust deposition relieved the iron (Fe)-limitation,
shows that both Si(OH)4 and Fe co-limit EP in the SAZ around New Zealand, and is
consistent with modern process studies. To understand the influence of iron fertilisation
by dust since the LGM, lithogenic supply changes at the core sites were also investigated.
At sites east of New Zealand an unusual lithogenic deposition pattern was observed, offset
from other sites in the rest of the Southern Ocean. An explanation may be that this offset
was driven by intense erosion and glacier melts, which increased the sediment discharged
during the deglaciation.
As EP remained mostly unchanged since the LGM in the southwest Pacific sector of
the Southern Ocean, other factors are likely to have driven any observed oxygen changes.
In chapter 5, authigenic Uranium and Rhenium (aU and aRe) variations in the
sedi-ments were investigated and show that intermediate depths (800-1500 m) of the southwest
Pacific sector of the Southern Ocean were deoxygenated during the LGM compared to the
Holocene. Additionally, data from deeper locations (≥ 1500 m) indicate higher oxygen
content during the LGM compared to the Holocene. To understand the factors driving
these variations all benthic foraminiferal δ13C data available in the New Zealand region
were compiled. These data together with aU and aRe variations are consistent with a
dramatic circulation change in the Southern Ocean, which induced a shallower Antarctic
Intermediate Water (AAIW)-Upper Circumpolar Deep Water (UCDW) boundary during
the LGM compared to the Holocene over the Campbell Plateau. It is proposed that
this shoaling can be explained by either a decrease in the AAIW production or a
north-ward shift of the AAIW formation region. However, aU and aRe also show that AAIW
contained less oxygen during the LGM compared to the Holocene. These results are in
contrast with the enhanced AAIW ventilation inferred during the LGM in the southeast
Pacific sector of the Southern Ocean, and therefore highlight an asymmetry in AAIW
response to climatic forcing during the LGM in the Pacific.
The insights presented in this thesis improve our understanding of how circulation
and EP influence the ventilation of the ocean interior on glacial-interglacial timescales.
Chapter 6details the importance of these findings for future research and also highlights
Declaration and statements
Declaration of originality
This thesis contains no material which has been accepted for a degree or diploma by the University or any other institution, except by way of background information and duly acknowledged in the thesis, and to the best of my knowledge and belief no material previously published or written by another person except where due acknowledgement is made in the text of the thesis, nor does the thesis contain any material that infringes copyright.
Authority of access and statement regarding published work contained in the thesis
The publishers of the papers comprising Chapter 2 and Chapter 4 hold the copyright for that content, and access to the material should be sought from the respective journal. The remaining non published content of the thesis may be made available for loan and limited copying and communication in accordance with the Copyright Act 1968.
Signed:
Axel Durand PhD candidate Date: 22/04/2017
Statement of co-authorship
The following people and institutions contributed to the publication of work undertaken as part of this thesis:
(1) Axel Durand (candidate) — Institute for Marine and Antarctic Studies (IMAS), University of Tasmania, Hobart (TAS), Australia.
(2) Zanna Chase — Institute for Marine and Antarctic Studies (IMAS), University of Tasmania,
Hobart (TAS), Australia.
(3) Taryn L. Noble — Institute for Marine and Antarctic Studies (IMAS), University of Tasmania, Hobart (TAS), Australia.
(4) Ashley T. Townsend — Central Science Laboratory (CSL), University of Tasmania, Hobart,
(5) Nathan Bindoff —Institute for Marine and Antarctic Studies (IMAS), Australian Research Coun-cil Centre of Excellence for Climate System Science, CSIRO Marine Atmospheric Research, ACE CRC, CAWCR, University of Tasmania, Hobart , Australia.
(6) Helen Bostock — NIWA, Wellington, New Zealand.
(7) Samuel L. Jaccard — Institute of Geological Sciences and Oeschger Centre for Climate Change Research, University of Bern, Switzerland.
(8) Helen Neil — NIWA, Wellington, New Zealand.
(9) Geraldine Jacobsend — Australian Nuclear Science and Technology Organisation (ANSTO),
Lucas Heights, New South Wales, Australia.
(10) Priya Kitchener —Institute for Marine and Antarctic Studies (IMAS), University of Tasmania, Hobart (TAS), Australia.
(11) Emily Panietz — Institute for Marine and Antarctic Studies (IMAS), University of Tasmania, Hobart (TAS), Australia.
(12) Chelsea Long — Institute for Marine and Antarctic Studies (IMAS), University of Tasmania, Hobart (TAS), Australia.
(13) Nils Jansen — Institute for Marine and Antarctic Studies (IMAS), University of Tasmania, Ho-bart (TAS), Australia.
(14) Les Kinsley — Australian National University (ANU), Canberra, Australia.
(15) Karsten Goemann —Central Science Laboratory (CSL), University of Tasmania, Hobart, Aus-tralia.
(16) Sean Johnson — Centre of Excellence in Ore Deposits (CODES), University of Tasmania, Ho-bart, Australia.
Author’s contributions
Chapters 2, 4 and 5 of this thesis have been prepared as manuscripts for
submis-sion to peer-reviewed journals. In all cases the design and implementation of the research, data analysis, interpretation of the results, and preparation of the manuscripts were the responsibility of the candidate but were carried out in consultation with supervisors and with the input of specialist contributors. These contributions are highlighted for each of these manuscripts below.
Chapter 2 (Paper 1): Improved methodology for the microwave digestion of
carbonate-rich environmental samples.
A. Durand (first author): laboratory work, data processing, data analysis, manuscript writing.
Z. Chase (author 2): data analysis, manuscript writing.
A.T. Townsend (author 3): laboratory work, data processing, data analysis, manuscript writing.
T.L. Noble (author 4): data analysis, manuscript writing. E. Panietz (author 5): laboratory work.
K. Goemann (author 6): laboratory work, data analysis, manuscript writing.
Chapter 4 (Paper 2): Export production in the New-Zealand region since the last glacial
maximum
A. Durand (first author): laboratory work, data processing, data analysis, manuscript writing.
T.L. Noble (author 3): data analysis, manuscript writing. H. Bostock (author 4): data analysis, manuscript writing. S.L. Jaccard (author 5): data analysis, manuscript writing. P. Kitchener (author 6): laboratory work, data analysis.
A.T. Townsend (author 7): laboratory work, data processing, data analysis, manuscript writing.
N. Jansen (author 8): laboratory work. L. Kinsley (author 9): laboratory work.
G. Jacobsen (author 10): laboratory work, shared data. S. Johnson (author 11): laboratory work
H. Neil (author 12): shared data.
Chapter 5 (Paper 3): Sediment cores reveal a deoxygenated Southern Ocean
surround-ing New Zealand dursurround-ing the last glacial maximum
A. Durand (first author): laboratory work, data processing, data analysis, manuscript writing.
Z. Chase (author 2): laboratory work, data analysis, manuscript writing. T.L. Noble (author 3): data analysis, manuscript writing.
H. Bostock (author 4): data analysis, manuscript writing. S.L. Jaccard (author 5): data analysis, manuscript writing.
A.T. Townsend (author 6): laboratory work, data analysis, manuscript writing. N. Bindoff (author 7): data analysis.
H. Neil (author 8): laboratory work, shared data. G. Jacobsen (author 9): laboratory work, shared data. C. Long (author 10): laboratory work.
We the undersigned agree with the above stated ‘proportion of work undertaken’ for each of the above manuscripts contributing to this thesis:
Signed: Signed:
Dr. Zanna Chase Pr. Craig Johnson
Supervisor Head of centre
Institute for Marine and Antarctic Studies (IMAS) Institute for Marine and Antarctic Studies (IMAS)
University of Tasmania University of Tasmania
Acknowledgements
First, I would like to thank Dr. Zanna Chase for giving me the opportunity to tackle this
exciting project and guiding me all along. Thanks for your infinite patience, your help,
your time, and for being such a great mentor. I have learned so much from you over these
years. You have been an amazing supervisor and are a source of inspiration.
I would also really like to thank Dr. Ashley Townsend for your support all along
this PhD journey. Particularly, thanks for the uncountable hours you spent sharing your
passion and teaching me about Inductively Coupled Plasma-Mass Spectrometry. It has
been a great privilege and an amazing experience to work together. Thanks for taking
me under your wing.
Thanks to Dr. Taryn Noble for your involvement in this project. Thanks for the great
ideas, the inspiring discussions about paleoceanography and the countless feedback that
you gave on each of the chapters composing this thesis.
Thanks to Prof. Nathan Bindoff for taking the time to share your physical expertise
and helping me understand what could have driven the oxygenation changes observed.
Thanks to those who have contributed to parts of this project. Many thanks to Samuel
Jaccard and Helen Bostock for your interest and precious mentoring as developing chapter
4 and 5. Particular thanks to Samuel Jaccard for organising and funding a trip to Kiel to
collect sediment samples. Thanks to Helen Neil and Priya Kitchener for sharing some data
with me. Thanks to Emily Panietz and Chelsea Long for your help in the lab. Special
thanks to Nils Jansen for setting up the opal measurement method in our facility and
helping me with the samples. I am also very thankful to Les Kinsley who helped measuring
samples on the Multi Collector-Inductively Coupled Plasma-Mass Spectrometer at the
scanning electron microscopy and for helping me characterise the insoluble precipitates in
the digested samples. Thanks to Sean Johnson for the help you gave with the total carbon
measurements. Thanks to Pearse for the amazing discussions about ocean deoxygenation
and modelling. Thanks to Verena Lanny for making my trip to Switzerland easy and
helping me analyse samples at the Institute of Geological Sciences and Oeschger Centre
for Climate Change, Bern.
Thanks to the Tasmanian Graduate Research Scholarship that supported my four-year
enrolment at the University of Tasmania. Many thanks to the Graduate Research Office as
well as the Institute for Marine and Antarctic Studies and the Bottom of the Earth Society
for co-funding my attendance to the 12th International Conference of Paleoceanography
in Utrecht.
Thanks to my cheerful family for always supporting me in my choices. Thanks to all the
friends who shared parts of this journey with me and always provided good distractions.
Thanks to all my surf-mates: Malcolm, Guillaume, German, Martin, Marion, Jan, Pier
and many more, for all the adventures and helping keeping me balanced and happy.
Special thanks to Manu for being such a good friend. We have shared so many laughs
together; I always had a big smile when returning to my desk after coffee breaks with you.
Finally, thanks Delphi for sharing this adventure with me and making it such a happy
and fun one. Thanks for the countless hours you spent reading and helping with my work
and for always being so patient and interested. Thanks for cheering me up during the
downs and having so much faith in me.
Thanks for the comments of Stephanie Kienast and Michael Ellwood, which greatly
Contents
Abstract . . . 3
Declaration and statements . . . 7
Acknowledgments . . . 11
List of figures . . . 17
List of tables . . . 21
1 Introduction 23 References . . . 34
2 Improved methodology for the microwave digestion of carbonate-rich environmental samples 43 2.1 Introduction . . . 44
2.2 Experimental section . . . 47
2.2.1 Reagents and material . . . 47
2.2.2 Samples and certified materials . . . 47
2.2.3 Microwave instrument and sequence . . . 49
2.2.4 Digestion procedures . . . 49
2.2.5 Detection instrumentation and techniques . . . 53
2.3 Results . . . 55
2.3.1 HISS-1 . . . 56
2.3.2 GSR-6 . . . 56
2.3.3 GSD-11 . . . 57
2.3.4 D-178 . . . 59
2.3.5 Calcium carbonate reference . . . 59
2.3.6 Summary of the results . . . 60
2.4 Discussion . . . 60
2.4.1 Low carbonate marine sediment: HISS-1 . . . 61
2.4.2 High carbonate materials: D-178, GSR-6 and calcium carbonate . . 61
2.4.3 Low carbonate, high Al sediment: GSD-11 . . . 62
2.5 Conclusion . . . 64
2.6 Acknowledgements . . . 64
References . . . 66
3 Determination of trace isotope concentrations in sediment digests by isotopic dilution using a single collector sector field inductively coupled plasma mass spectrometer 71 3.1 Introduction . . . 72
3.2 Material and methods . . . 74
3.2.2 Sediment digestion . . . 74
3.2.3 Analysis . . . 74
3.2.4 Instrument detector dead-time determination . . . 77
3.2.5 Isotopic dilution calculations . . . 77
3.3 Results and discussion . . . 78
3.3.1 Importance of instrumental dead-time determination . . . 79
3.3.2 Method enhancements associated with use of guard electrode and micro-concentric desolvating nebuliser . . . 79
3.3.3 Intercalibrations . . . 81
3.3.4 Technical issues and recommendations . . . 83
3.4 Conclusion . . . 84
References . . . 85
4 Export production in the New-Zealand region since the last glacial max-imum 89 4.1 Introduction . . . 90
4.2 Methods . . . 94
4.2.1 Age models . . . 94
4.2.2 Sediment digestion . . . 95
4.2.3 Analysis of Uranium, Thorium and Barium . . . 95
4.2.4 Excess Barium calculation . . . 96
4.2.5 Opal, calcium carbonate, organic carbon and lithogenic fraction determination . . . 96
4.2.6 Flux calculations . . . 97
4.3 Results . . . 98
4.3.1 Sediment composition . . . 98
4.3.2 230-Thorium normalised fluxes . . . 98
4.4 Discussion . . . 99
4.4.1 Overview of the export production proxies . . . 102
4.4.2 Export production changes and their drivers . . . 105
4.4.3 Glaciogenic sources contributed to lithogenic fluxes on the Campbell Plateau . . . 110
4.5 Conclusion . . . 112
4.6 Acknowledgements . . . 114
4.7 Supplementary material . . . 114
References . . . 117
5 Sediment cores reveal a deoxygenated Southern Ocean surrounding New Zealand during the last glacial maximum 127 5.1 Introduction . . . 128
5.2 Methods . . . 134
5.2.1 Age models . . . 134
5.2.2 Sediment preparation and digestion . . . 134
5.2.3 Thorium, Uranium and Rhenium Analysis . . . 134
5.2.4 Calculation of authigenic Uranium and Rhenium concentrations . . 135
5.3 Results . . . 135
5.3.1 Authigenic Uranium and Rhenium . . . 135
5.4 Discussion . . . 138
5.4.1 Export production as a dissolved oxygen driver . . . 139
5.4.2 Shallower and deoxygenated glacial AAIW above the Campbell
Plateau . . . 140
5.4.3 Reconciling differences between Campbell and Challenger Plateaux 143
5.5 Conclusion . . . 145
5.6 Acknowledgements . . . 146
5.7 Supplementary material . . . 146
5.7.1 Pangaea database compiling the new data created during this
sec-tion of the PhD . . . 146
5.7.2 Sedimentation rates do not drive authigenic Uranium and Rhenium
variations . . . 146
5.7.3 Calcium carbonate mass accumulation rate variations in the New
Zealand region . . . 147
5.7.4 Radiocarbon ages and uncertainties . . . 149
References . . . 151
6 Conclusions 157
List of Figures
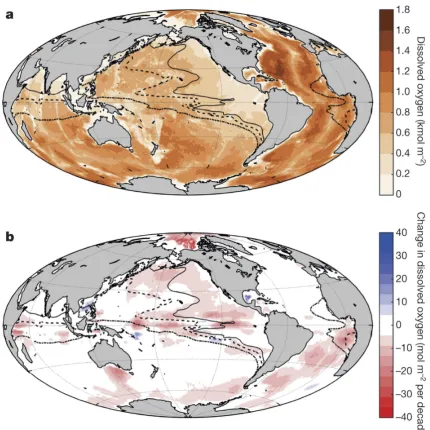
1.1 Amount of dissolved oxygen and changes per decade since 1960.
(Fig-ure from Schmidtko et al. (2017)). (a) Global dissolved oxygen inventory. Lines indicate boundaries of OMZs: dashed doted, region with less than 80µmol.kg−1 oxygen anywhere within the water column; dashed lines and
solid lines similarly represent regions with less than 40 µmol.kg−1 oxygen
and 20 µmol.kg−1 oxygen, respectively. (b) Changes in dissolved oxygen
per decade. Lines show OMZs as in (a). . . 24
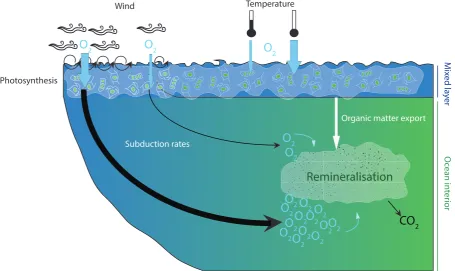
1.2 Summary of the processes driving variations in the oxygen content of the
ocean interior. . . 26
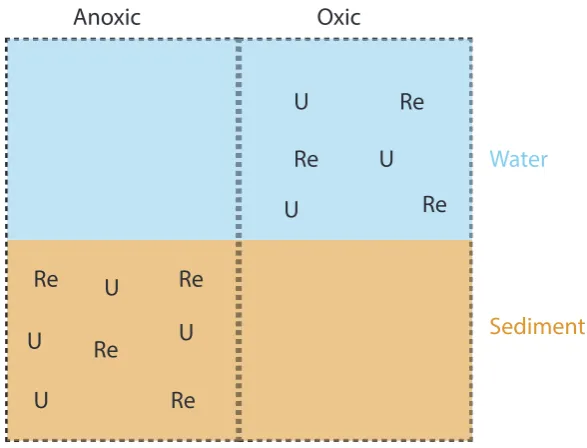
1.3 Summary of the conditions leading to U and Re enrichment in sediments. . 28
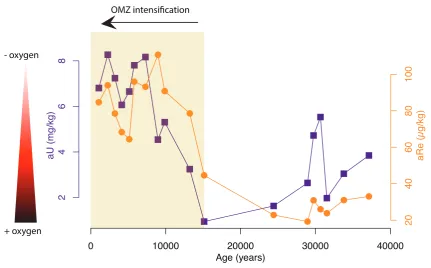
1.4 Authigenic Uranium (aU) and Rhenium (aRe) concentration variations
with time in NH15P sediment core (Mexican continental margin). En-richments of aU and aRe show the intensification of the Oxygen Minimum
Zone (OMZ) above the core site. Data from Nameroff et al. (2004). . . 29
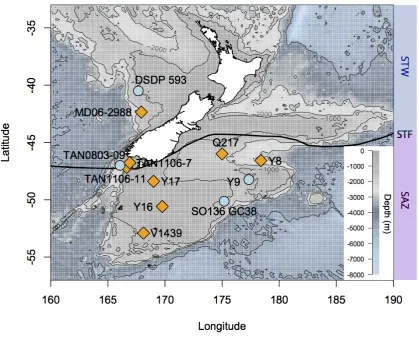
1.5 Map representing the bathymetry of the New Zealand region as well as
sediment core locations. Orange diamonds show the cores where only oxy-genation changes were investigated. Blue dots show the cores where both
oxygenation and export production (EP) changes were reconstructed. . . . 32
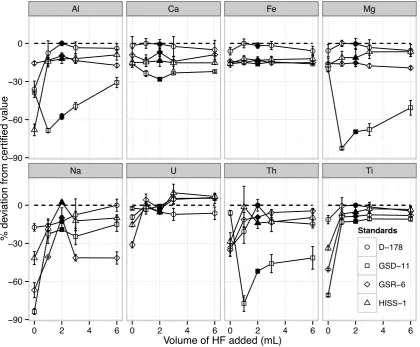
2.1 From left to right : Average overall element recoveries against volume HF
added during digestion; Average overall major element recoveries (Ca, Mg, Al, Fe and Na) against the volume HF added during digestion; average overall trace element recoveries (Cd, Co, Cr, Cu, Mn, Sr, Ti, U and V) against the volume HF added during digestion. Black symbols highlight the proposed optimised procedure (pre-treatment with HCl (32%) on hotplate followed by microwave digestion with 2 mL of HF). The averaged recoveries for the different groups (all elements, major elements, trace elements) pre-sented were calculated by averaging the recovery of each individual element for each group. . . 57
2.2 Deviation from certified concentrations for representative elements in
HISS-1, GSR-6 and GSD-11 after ICP-MS analysis. The deviation represented for D-178 is from the maximal concentration observed. The data for 2 mL of HF added correspond to the proposed optimised procedure, black symbols highlight the proposed optimised procedure (pre-treatment with HCl (32%)) on hotplate followed by microwave digestion); the error bars
shown for n=4 represent the standard error. . . 58
2.3 Trends between Al and Th, Mg and Th, and Al and Ba for different volumes
of HF used during digestion considering sample GSD-11, including the
3.1 Example of the ID technique used for the measurement of230T hwhen229T h
is added as a spike. . . 73
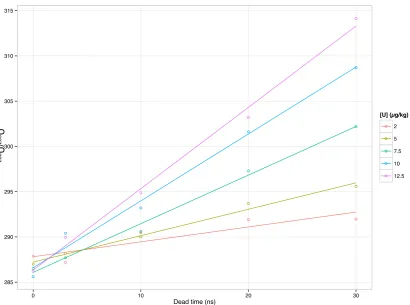
3.2 Variation of measured 238U/235U ratio with preselected instrument
dead-time for different dilutions of the same ’mother’ solution. Intersecting ratio
responses correspond to optimal dead-time value. . . 78
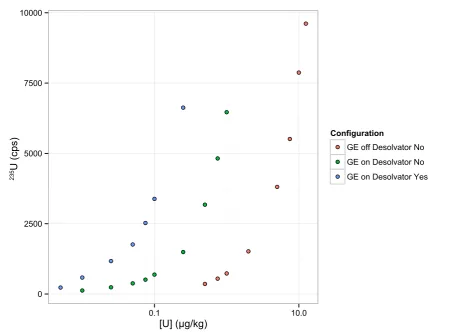
3.3 Influence of GE and micro-concentric DSN on instrument sensitivity (235U
shown as an example). Solutions of different U concentrations were made by dissolution of an in-house uranyl acetate salt, with resultant counts
shown for different instrumental configurations. . . 80
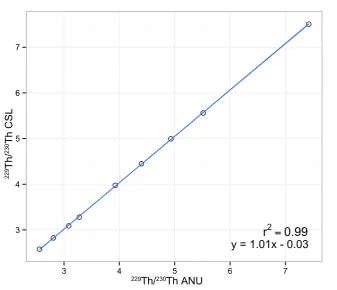
3.4 Comparison between229T h/230T h ratios measured by MC-ICP-MS (ANU)
and ICP-MS (UTAS, method applied) from 1171B and D-178 sediment digests. The 95% probability is represented as shaded area (largely indis-tinguishable from the line). . . 82
3.5 Comparison between238U and 232T hconcentrations measured by
ID-ICP-MS and external calibration ICP-ID-ICP-MS, both using the UTAS instrument
(Element 2), from TAN0803-09 and D-178 sediment digests. The 95%
confidence interval is represented as shaded area. . . 83
4.1 Productivity changes at different core sites since the LGM. Yellow colour
indicates similar productivity across the LGM-Holocene transition, while orange and red means higher productivity during the deglacial (18-12 ka) and LGM (18-21 ka), respectively. Dots represent new data from this study, diamonds represent previously published data. All the data available for this region were included. A list of the different proxies used for each core is available in the supplementary material section. The background represents bathymetry. The mean present (Orsi et al., 1995) and LGM (Bostock et al., 2015) positions of the STF are represented as plain and dashed lines, respectively. Major glaciogenic sediment deposition zones during the LGM are represented as white polygons (Carter et al., 2000).
Arrows show major lithogenic river discharges during the LGM. . . 92
4.2 Mean chlorophyll-a concentration (2014-2016) from SeaWIFS data. The
positions of sediment cores discussed in this paper are indicated. . . 93
4.3 Mean composition of cores considered in this study during the LGM (18-21
ka) and the Holocene (5-12 ka). The lithogenic content was estimated from
232T h as described in the text. The cumulative weight of opal, carbonate
and lithogenic fractions is often less than 100%. This can be due to one or a combination of the following factors: (i)Corg contribution to the total weight (not represented) (ii) anomalous depletion in232T hof the lithogenic
material (iii) analytical errors. . . 99
4.4 Th-normalised (a)Lithogenic, (b)Opal, (c)xsBa, (d)Corg and (e)CaCO3
4.5 Lithogenic fluxes in the region and potential driving forces. (a) Dome C
(EDC, Antarctica) dust flux (Lambert et al., 2008), (b)230T h normalised
lithogenic fluxes of sites in the Southern Ocean where the lithogenic deposi-tion is driven by aeolian dust deposideposi-tion: NBP9802-6PC and TN057-13PC (Anderson et al., 2009), ODP1090 (Mart´ınez-Garcia et al., 2014), PS75/59-2 (Lamy et al., PS75/59-2014), DSPD 593 (This study). SO stands for Southern Ocean and SW for southwest. (c) Lithogenic flux of the Campbell Plateau sites Y9, TAN0803-09 and SO136GC-38 (this study). The colour of the axis matches the colour of the site. (d) South Australian alkenone-derived SSTs from core MD03-2611 (blue shaded area, (Calvo et al., 2007)) and South-ern Alps glacier extent relative to their maximum glacial extent (black line, (Putnam et al., 2010)). . . 101
4.6 Comparison between the total mass accumulation rates (MAR) and
Th-normalised total sediment fluxes, with propagated uncertainties, for the
four sediment cores used in this study. Uncertainties are smaller than
symbols for DSDP 593 and Y9. . . 102
4.7 Th-normalised fluxes from this study in comparison to other sites in the
Southern Ocean. (a) Opal fluxes at SO136GC-38, Y9 and TAN0803-09, to-gether with SAZ sites ODP1090 (Atlantic, (Mart´ınez-Garcia et al., 2014)) and PS75/59-2 (Central Pacific, (Lamy et al., 2014)). (b) Opal fluxes from polar front sites TN057-13PC (Atlantic) and NBP9802-6PC (Pacific)
(An-derson et al., 2009). (c) xsBa fluxes at SO136GC-38, Y9 and TAN0803-09
in comparison to PS75/59-2 (Central Pacific, (Lamy et al., 2014)). (d)xsBa
fluxes of TN057-13PC (Atlantic, (Jaccard et al., 2016)) and NBP9802-6PC
(Pacific, (Chase et al., 2003)). (e)Corg flux at TAN0803-09 in comparison
to TN057-13PC (Atlantic, (Jaccard et al., 2016; Wagner and Hendy, 2015)) and NBP9802-6PC (Pacific, Chase et al. (2003)). Grey shaded area shows the deglaciation (18-12 ka). . . 104
4.8 Present surface silicic acid concentration and core sites. Data from the
World Ocean database). The positions of the Polar Front (red),
Sub-antarctic Front (blue), and Subtropical Front (purple), are shown (Orsi et al., 1995). . . 107
4.9 Comparison between the lithogenic flux changes from this study to the
modelled dust deposition change between the LGM and present. Back-ground: Modelled difference between the dust deposition during the LGM and present (dustLGM - dustpresent) (Albani et al., 2016). Dots: lithogenic
flux differences between the LGM (18-21 ka) and present (≤ 8 ka). At
DSDP 593 and SO136GC-38 observed and modelled changes in flux agree while at Y9 and TAN0803-09 observed changes in lithogenic flux are larger than modelled changes in dust deposition. . . 113
5.1 Map representing the bathymetry of the New Zealand region as well as the
5.2 Oceanographic settings of the New Zealand region. Dissolved oxygen con-centrations from the P15S (a) and P11 (b) sections (WOCE). The positions of the sediment cores analysed (aU, aRe) on the Campbell and Challenger Plateaux are represented on the top and bottom panels respectively. (c)
Carbon isotope composition of Dissolved Inorganic Carbon (δ13DIC) from
the P15S section of the World Ocean Data Base (WOCE). The positions
of the sediment cores from which foraminiferaδ13C were used in this study
were added. A simplified Southern Ocean circulation was adapted from Talley (2013). The southern source AAIW corresponds to the AAIW 1 while the northern source corresponds to the AAIW 2 and 3. . . 131
5.3 Difference in authigenic U and Re (aU: dots and aRe: diamonds) between
the LGM (18-25 ka) and the Holocene (5-12 ka). Positive values indicate higher aU and aRe concentrations in the sediment during the LGM, and lower inferred bottom water oxygen concentrations. . . 136
5.4 Authigenic U and Re (aU and aRe) and benthic foraminifera δ13C as a
function of core depth for LGM (dashed; 18-25 ka) and Holocene (plain; 5-12 ka) time slices on the Challenger (blue triangles) and Campbell (green circles) Plateaux. . . 137
5.5 Comparison between the LGM (18-25 ka) - Holocene (5-12 ka) difference
in benthic foraminifera δ13C and aU for the three sediment cores in this
study where both parameters were measured. From left to right, V1439,
Y17 and DSDP 593. . . 139
5.6 Schematics of the two different scenarios that can explain the differences
between the Campbell and Challenger Plateaux δ13C and redox-sensitive
metal data. On the top panel, modern circulation. On the bottom left panel the southern source AAIW (red) shoaled and left the Campbell Plateau partly bathed by oxygen depleted UCDW, while the deoxygenated north-ern source AAIW (yellow) intensified and bathed the Challenger Plateau,
with noδ13Cchange. On the bottom right panel, the AAIW subducting
re-gion was shifted northward. As a consequence the southern source AAIW did not reach the Campbell Plateau. However, the Challenger Plateau
continued to be bathed by AAIW because it is located 10◦ further north
compared to the Campbell Plateau. . . 143
5.7 CaCO3 MAR variations. The top panel (a) represents the small CaCO3
MAR variations of two sediment cores located on the Campbell Plateau,
while the bottom panel (b) represents the larger CaCO3 MAR variations
List of Tables
2.1 Description of samples considered. . . 48
2.2 Determined elemental concentrations with relative errors following ICP-MS
analysis, for different volumes of HF used during the digestion (n=4). . . . 50
2.3 Visual observations and solid matter compositions following digestion with
different volumes of HF. The solid compositions were determined using SEM analysis. N.E. corresponds to ’Not Enough’ sample for the x-ray
char-acterisation. ’≤’ and ’’ indicate the dominant elemental component(s)
when multiple elements were characterised. . . 53
2.4 Typical instrument conditions and measurement parameters. . . 55
4.1 Summary of the sediment core locations, depths, and age models. . . 93
4.2 Mean focussing factors of the different sediment cores presented in this
study. The focusing factors (ψ) have been calculated for every sample
point and then averaged between 18-21 ka for the LGM timeslice and 5-12
ka for the Holocene timeslice. ψ > 1 indicates sediment focussing, while ψ
< 1 indicates sediment winnowing. . . 98
4.3 Summary of the sediment core locations, depths, proxies used and surface
water masses overlaying sites. MAR refers to Mass Accumulation Rates without Th-normalisation. . . 115
5.1 Summary of the sediment core locations, depths, proxies used and age
models. Delta13C data all correspond to benthic foraminifera δ13C. An
indication of the water masses, bathing the core sites is included, based on the densities of the P15S section from the World Ocean database (WOCE). When the core is at the interface of two water masses, both are reported. (*)Previously published age models were used without modifications (**) New radiocarbon dates were used to update previously published age models133
5.2 Sedimentation rates during the Holocene and the LGM at different core sites147
Chapter 1
Introduction
Observations have shown that oceans have lost 2% of their total oxygen content since 1960
(Schmidtko et al., 2017) and that this deoxygenation is increasing (Helm et al., 2011).
Moreover, deoxygenation is widespread spatially and affects all oceans basins (Diaz and
Rosenberg, 2008; Keeling et al., 2010; Matear et al., 2000; Stramma et al., 2008, 2010)
(Figure 1.1). Regions accounting for the largest deoxygenation, up to 30 mol.m−2 per
decade since 1960, are located in the equatorial and north Pacific Ocean, the Southern
Ocean and the south Atlantic Ocean (Schmidtko et al., 2017). In coastal areas
deoxy-genation has been mostly fuelled by riverine runoff of fertilizers, which boosted oxygen
consumption by marine organisms (Diaz and Rosenberg, 2008). In the pelagic
environ-ment deoxygenation has been the result of higher temperatures which have decreased the
oxygen solubility, and increased stratification which has reduced ventilation. The
spread-ing of oxygen minimum zones (OMZ) as a result of this deoxygenation is of particular
concern because of potentially large impacts on aerobic marine life (Diaz and Rosenberg,
2008; Karstensen et al., 2008; Stramma et al., 2008, 2010). The OMZ expansion could
drive substantial changes in ecosystem dynamics, and could result in the collapse of some
fisheries (Bograd et al., 2008; Chan et al., 2008; Chu and Tunnicliffe, 2015; DePasquale
et al., 2015; Diaz and Rosenberg, 2008). Another consequence of deoxygenation is that
it amplifies global warming by increasing denitrification which results in greater release
of the greenhouse gas nitrous oxide (N2O) (Babbin et al., 2015; Deutsch et al., 2007;
Nevison et al., 1995). Moreover, because higher temperatures decrease oxygen solubility,
(Keeling et al., 2010; Matear and Hirst, 2003). Unfortunately the future trends of ocean
deoxygenation are still uncertain and a deeper understanding of key drivers will be
essen-tial to guide future decisions in order to mitigate deoxygenation consequences (Emerson
[image:24.595.87.518.170.601.2]and Bushinsky, 2014).
Figure 1.1: Amount of dissolved oxygen and changes per decade since 1960. (Figure from Schmidtko et al. (2017)). (a) Global dissolved oxygen inventory. Lines indicate
boundaries of OMZs: dashed doted, region with less than 80µmol.kg−1 oxygen anywhere
within the water column; dashed lines and solid lines similarly represent regions with
less than 40 µmol.kg−1 oxygen and 20 µmol.kg−1 oxygen, respectively. (b) Changes in
dissolved oxygen per decade. Lines show OMZs as in (a).
The oxygen content of the ocean interior is determined by the balance between the
Ocean deoxygenation: a paleo-proxy perspective
bacterial respiration of labile organic matter (remineralisation). Since labile organic
mat-ter is supplied by Export Production (EP), an increase in EP leads to oxygen depletion.
On the other hand, the supply of oxygen to the ocean interior occurs through ventilation,
the process whereby oxygen-rich surface waters are transported into the ocean interior
through subduction (Helm et al., 2011). Therefore, the oxygen content of the subducted
surface waters as well as their subduction rates and circulation influence the ocean
inte-rior oxygenation (Figure 1.2). The transfer of oxygen from the atmosphere to the surface
ocean is driven by temperature and wind intensity, where strong winds and low
temper-ature favour mixing and oxygen enrichment (Jaccard et al., 2014; Matear et al., 2000).
Additionally, the production of dissolved oxygen by phytoplankton photosynthesis
consti-tutes another process supplying dissolved oxygen to the mixed layer. The subduction of
these surface waters, ventilating the ocean interior, occurs mostly through the formation
of intermediate water masses, namely Subantarctic Mode Water (SAMW) and Antarctic
Intermediate Water (AAIW) in subpolar regions of the Southern Ocean (Sloyan and
Rin-toul, 2001). Of the two water masses, AAIW is volumetrically the largest and dominates
the oxygen supply to the ocean interior at low latitudes (Piola and Georgi, 1982).
As AAIW has a central role in ventilating the ocean interior, a large number of studies
have tried to understand the drivers of its formation; however, large uncertainties remain.
Antarctic intermediate water was first described in the 1930s as a fresh water mass of
the ocean interior (Deacon, 1933; Wust, 1935). Over the years multiple possible
mecha-nisms of AAIW formation have been identified (McCartney, 1979; Molinelli, 1981; Piola
and Georgi, 1982; Rintoul and England, 2010; Sloyan et al., 2010); however they are still
under debate today (Bostock et al., 2013). One theory is that AAIW is formed by
con-vection during the Southern Hemisphere winter (McCartney, 1979; Sloyan and Rintoul,
2001; Sloyan et al., 2010). While travelling northward, Antarctic Surface Water (AASW)
interacts with the atmosphere and as a result gets fresher and cooler. This increases
the density of AASW and drives the convection process that leads to AAIW subduction.
Prior to subduction, the northward advection at the surface is the result of Ekman
Temperature Wind
Subduction rates
Organic matter export
Photosynthesis
M
ix
ed la
yer
O
cean in
ter
ior
O
2O
2
O
2O
2O
2O
2O
2O
2O
2O
2O
2O
2O
2O
2O
2O
2O
2O
2CO
2 2O O
[image:26.595.75.531.72.343.2]Remineralisation
Figure 1.2: Summary of the processes driving variations in the oxygen content of the ocean interior.
Lachkar et al., 2007, 2009). Moreover, modelling studies have highlighted the essential
role of shallow bathymetric features to explain why AAIW formation only occurs in a few
hot spots in the Southern Ocean (Bostock et al., 2013; Reid, 1997; Sallee et al., 2010).
Changes in westerly wind stress have been reported as a major factor influencing
AAIW ventilation (Downes et al., 2009, 2010, 2011). On one hand the intensity of the
westerlies controls AAIW subduction: increased winds lead to increased subduction and
enhanced ventilation (Downes et al., 2010). On the other hand, the position of the
westerlies also influences AAIW subduction, where a southward shift in the mean position
of the westerlies enhances AAIW ventilation (Downes et al., 2010). However, increased
temperatures and rainfall have the opposite effect leading to an increase in buoyancy,
which inhibits AAIW ventilation (Gille, 2002; Schmidtko and Johnson, 2012; Wong et al.,
1999). Overall, a complex combination of drivers influence the AAIW formation and
consequent oxygen delivery to the ocean interior, and the influence of climate change on
these drivers and on the AAIW is yet to be fully understood.
Ocean deoxygenation: a paleo-proxy perspective
studies have a great potential to help better predict future oxygen changes. However,
unlike past atmospheric gases, which can be preserved in bubbles trapped in icesheets,
no seawater from the past remains trapped in an unaltered state. Rather, sediments
form the best archive recording oceanic oxygenation changes. The variations of redox
sensitive element concentrations in the sediments, such as Uranium (U) and Rhenium
(Re), have been widely used as proxies to detect past oceanic oxygen changes (Colodner,
1991; Morford and Emerson, 1999; Tribovillard et al., 2006). Uranium and Re solubilities
in seawater vary with the dissolved oxygen concentration of the seawater. When the
oxygen concentration of seawater decreases, U and Re are reduced from their soluble forms
(U O2(CO3)3)4−, U(OH)4, and ReO−4) toward insoluble forms (U O2 and ReO2.2H2O).
This causes U and Re solid phases to accumulate in the sediments. In other words, when
the concentration of dissolved oxygen in the water overlaying the sediment bed decreases,
the concentrations of U and Re in sediments increase (Figure 1.3). This signal is then
preserved and can be used as a proxy to reveal past oceanic oxygen changes (Figure 1.4).
However, U and Re concentrations in sediments only reflect oxygenation changes of the
water at the interface with the sediments and cannot be used to reveal oxygenation of
surface waters. Another weakness is that the relationship between U and Re solubilities
and dissolved oxygen is not linear and is close to a tipping point because the precipitation
of U and Re solid phases occurs only when a redox threshold is reached (Crusius et al.,
1996; Tribovillard et al., 2006). Therefore, U and Re can only be used as qualitative
proxies for oxygenation change.
Other proxies, that directly relate to changes in the oxygen content of the water
overlaying the sediment bed, include sediment lamination and foraminifera assemblages
(Jaccard et al., 2014). Under very low oxygen concentrations (close to anoxia) the mixing
of sediments by burrowing organisms stops. This allows the seasonal cyclicity in the
sediment supply to be preserved as thin layers (lamination) (van Geen et al., 2003).
Therefore, the presence of laminations reflects extremely low oxygen content of the water
overlaying the sediment bed. Changes in foraminifera assemblages have also been used
Anoxic
Oxic
Sediment
Water
Re
U
Re
Re
U
U
Re
Re
Re
Re
U
U
U
[image:28.595.157.451.84.308.2]U
Figure 1.3: Summary of the conditions leading to U and Re enrichment in sediments.
to environmental changes. Thus, the absence of particular species can be used as a
deoxygenation proxy (Corliss, 1985). However, there are considerable weaknesses to the
use of lamination and foraminifera assemblages as oxygenation proxies (Jaccard et al.,
2014). Lamination only occurs in nearly anoxic environments and therefore cannot detect
subtle changes between two ’oxygenated’ states. Moreover, laminations are only observed
in areas of high sediment deposition, which limits its use. Finally, changes in foraminifera
assemblages can be driven by changes independent of oxygenation such as temperature
or organic matter availability. As a consequence, large uncertainties are often associated
with their use as an oxygenation proxy.
In order to interpret changes in oxygenation inferred from redox sensitive metals it is
helpful to also reconstruct water mass circulation and EP. It is beyond the scope of this
chapter to detail every proxy used in paleoceanography that relates to circulation and
EP; instead the ones that are used in this thesis are briefly described. Foraminifera δ13C
(δ13C = ( (
13C 12C)sample
(1312C
C)standard
−1)∗1000) is one of the most widely used proxies in
paleoceanog-raphy because foraminifera preserve the past δ13C signature of seawater in their shells.
Spatial distribution of seawater δ13C can be influenced by photosynthesis,
Ocean deoxygenation: a paleo-proxy perspective
2
4
6
8
a
U
(mg
/kg
)
2
0
4
0
6
0
8
0
1
0
0
a
R
e
(µ
g
/kg
)
0 10000 20000 30000 40000
Age (years)
+ oxygen - oxygen
[image:29.595.77.509.71.339.2]OMZ intensification
Figure 1.4: Authigenic Uranium (aU) and Rhenium (aRe) concentration variations with time in NH15P sediment core (Mexican continental margin). Enrichments of aU and aRe show the intensification of the Oxygen Minimum Zone (OMZ) above the core site. Data from Nameroff et al. (2004).
a proxy for both circulation and EP (Curry and Oppo, 2005; Kroopnick, 1985;
Schmit-tner et al., 2013). Air-sea gas exchange buffers the surface δ13C of the oceans allowing
equilibration with the δ13C of the atmospheric CO2. Moreover, photosynthesis increases
the δ13C of surface waters by preferentially uptaking light 12C. As a result, the organic
matter produced from photosynthesis has low13C abundance and remineralisation of this
organic matter decreases the δ13C of deep waters. Finally, ocean circulation influences
the spatial δ13C distribution by mixing and transporting water masses of differing δ13C.
Subsequently, because various factors influence δ13C, it can be difficult to separate their
effects when they are subject to large variations. Although large uncertainties are
as-sociated with the use of δ13C, it is still widely used as a proxy to estimate changes in
circulation and EP.
Alternatively, reconstruction of past EP changes can be accurately achieved by
opal, barite, organic carbon and calcium carbonate (Chase et al., 2003; Paytan et al.,
1996; Ragueneau et al., 1996). Increased flux of these compounds is linked to increased
EP. However their accumulation in sediment is not only a function of the vertical supply,
but also of the lateral redistribution (sediment winnowing and focussing), which can
in-duce erroneous flux reconstructions (Francois et al., 2004). The sediment redistribution
is particularly important in areas with strong bottom currents like the Southern Ocean
(Dezileau et al., 2003; Frank et al., 1999). The traditional approach to calculate
par-ticulate flux to the seafloor uses sediment density and dated tie-points. However, this
approach does not correct for sediment redistribution (Francois et al., 2004). Fortunately,
the 230-Thorium (230T h)-normalisation method has been widely used to solve this issue.
This method is based on the fact that230T his insoluble and consequently its removal from
the water column by particle scavenging is equal to its known production rate by decay of
234-Uranium (234U) (Francois et al., 2004). Because the dissolved U concentration in the
ocean is essentially the same globally, the production of230T hoccurs quasi-homogenously.
As a consequence the expected flux of230T hreaching the seafloor is known and any
devi-ations from it can be used to correct potential sediment redistribution. The development
of this normalisation method only occurred recently so the results of a large number of
studies prior to this advance have to be interpreted with care.
Using these and other proxies, paleo-studies have revealed that the Atlantic and Indian
sectors of the Southern Ocean intermediate depths were better oxygenated during cold
periods as a result of enhanced AAIW formation (Lynch-Stieglitz and Fairbanks, 1994;
Rickaby and Elderfield, 2005). However, disagreement remains over the Pacific sector
of the Southern Ocean. In the southeast Pacific, Muratli et al. (2009) showed that the
intermediate depths were better oxygenated during Last Glacial Maximum (LGM)
com-pared to the Holocene, using Re preserved in sediments. They attributed this increased
ventilation to greater AAIW formation. Their results are in agreement with those from
Jaccard and Galbraith (2012) and Jaccard et al. (2014), who showed that intermediate
depths were generally better oxygenated during the LGM compared to the Holocene in
Ocean deoxygenation: a paleo-proxy perspective
reported AAIW contraction during glacial periods in the southwest Pacific sector of the
Southern Ocean, based on benthic foraminiferaδ18O,δ30Siandδ13C(Elmore et al., 2015;
Pahnke and Zahn, 2005; Ronge et al., 2015; Rousseau et al., 2016). They proposed that
this AAIW contraction decreased the oxygen content at intermediate depths in this
re-gion. Unfortunately, the proxies used were not directly related to oxygen changes and
as yet, no paleo-studies have directly investigated oxygenation changes in the southwest
Pacific.
This thesis aims to reconstruct oxygenation changes at intermediate depths in the
southwest Pacific sector of the Southern Ocean since the LGM, and thus fill key gaps in
our understanding. To do so changes in oxygenation in parallel with their major drivers
(circulation, EP) were directly investigated, using U, Re,δ13Cand Th-normalised biogenic
fluxes from sediment cores of the New Zealand region (Figure 1.5). This approach has
the potential to evaluate the likelihood of various scenarios and thus reveal the exact
combination of factors driving the oxygenation changes.
The sediment cores used in this study were retrieved from the Campbell and
Chal-lenger Plateaux surrounding New Zealand. The sediment core depths span three out of
the seven main water masses of this region, namely SAMW, AAIW and Upper
Circumpo-lar Deep Water (UCDW) (Chiswell et al., 2015). Other water masses include Subantarctic
Water (SAW), Subtropical Water (STW), Lower Circumpolar Deep Water (LCDW) and
Antarctic Bottom Water (AABW). Subantarctic water and STW are the two
shallow-est water masses and are present at the interface with the atmosphere; therefore, their
dissolved oxygen concentrations are at saturation. Subantarctic water is present south
of the Subtropical Front (STF) in the Subantarctic Zone (SAZ, Figure 1.5), while STW
is present north of the STF. Below these lie the oxygen rich SAMW (500-600 m) and
AAIW (600-1200 m). Below the AAIW, a minimum in oxygen is observed between 1500
and 2500 m where the UCDW flows. Lower Circumpolar Deep Water flows between 2500
and 3000 m, and has intermediate oxygen content resulting from mixing of oxygen rich
AABW and oxygen depleted UCDW. Even though it is the deepest water mass, the high
occur at low temperature right before its subduction.
Figure 1.5: Map representing the bathymetry of the New Zealand region as well as sed-iment core locations. Orange diamonds show the cores where only oxygenation changes were investigated. Blue dots show the cores where both oxygenation and export produc-tion (EP) changes were reconstructed.
The precise quantification of U, Re and 230T h, used in this thesis to identify
oxy-genation and EP changes, requires the complete dissolution (digestion) of the sediments.
The complete digestion of solid material, such as sediments, occurs at high temperature
and pressure in a cocktail of acids. In order to produce the high temperature and
pres-sure, microwave assisted digestion is widely considered as the method of choice because
of its efficiency, rapidity, increased safety, use of smaller acid volumes and the recovery of
volatile samples (Flores, 2014; Kuss, 1992; Smith and Arsenault, 1996). Previous
Ocean deoxygenation: a paleo-proxy perspective
and Hydrofluoric (HF) acids leads to the complete digestion of most marine sediments
(Negre et al., 2009). However, all previously published methods failed to digest the
sed-iments retrieved from New Zealand because their carbonate rich composition caused the
formation of insoluble precipitates. Chapter 2 addresses this problem and details the
development of a new microwave assisted method for the complete digestion of carbonate
rich environmental samples.
Once digested sediment composition needs to be assessed. However, even though the
precise quantification of trace elements in sediments is an essential part of
paleoceanog-raphy, it remains a challenge for many isotopes. Chapter 3 details the isotopic dilution
method used, as well as the analytical developments achieved, to measure precisely the
low abundance isotopes 235U, 234U, 230T h on a single collector Sector Field-ICP-MS.
As bacterial respiration associated with EP is the largest oxygen sink of the ocean
inte-rior, understanding EP changes is important for reconstructing past oxygenation changes.
Several studies have already investigated past EP changes in this region, however, they
presented contradicting results suggesting either no EP change (Ellwood et al., 2005),
an increased EP during the LGM (Carter et al., 2000; Ikehara et al., 2000; Kowalski
and A Meyers, 1997; Lean and McCave, 1998) or during the deglaciation (Carter and
Manighetti, 2006). Moreover, these studies all used different EP proxies and therefore
it is somewhat difficult to compare their results. Finally, these studies reconstructed
the past fluxes of biological material without using the Th-normalisation method, which
could result in erroneous interferences (Francois et al., 2004). To resolve these issues and
reconstruct the overall EP trend in the southwest Pacific sector of the Southern Ocean,
chapter 4presents for the first time Th-normalised fluxes of opal,CaCO3, excess Barium
(xsBa), and organic carbon (Corg) at four core sites in this region.
In chapter 5 potential oxygenation changes are explored in the southwest Pacific
sector of the Southern Ocean, by measuring U and Re contents of 12 sediment cores
retrieved from the Campbell and Challenger Plateaux around New Zealand. These two
plateaux have great potential to record ventilation changes to the Ocean interior because
circu-lation and/or oxygen content (Bostock et al., 2010; Chiswell et al., 2015; Forc´en-V`azquez,
2014). In order to understand whether circulation drove the changes observed, all benthic
foraminiferal δ13C data available in the New Zealand region were compiled.
As a conclusion, a general discussion of the main findings from this thesis as well as
References
Babbin, A. R., Bianchi, D., Jayakumar, A., and Ward, B. B.: Rapid nitrous oxide cycling
in the suboxic ocean, Science, 348, 1127–1129, 2015.
Bograd, S. J., Castro, C. G., Di Lorenzo, E., Palacios, D. M., Bailey, H., Gilly, W.,
and Chavez, F. P.: Oxygen declines and the shoaling of the hypoxic boundary in the
California Current, Geophysical Research Letters, 35, 2008.
Bostock, H. C., Opdyke, B. N., and Williams, M. J.: Characterising the intermediate
depth waters of the Pacific Ocean using δ 13 C and other geochemical tracers, Deep
Sea Research Part I: Oceanographic Research Papers, 57, 847–859, 2010.
Bostock, H. C., Sutton, P. J., Williams, M. J., and Opdyke, B. N.: Reviewing the
circu-lation and mixing of Antarctic Intermediate Water in the South Pacific using evidence
from geochemical tracers and Argo float trajectories, Deep Sea Research Part I:
Oceano-graphic Research Papers, 73, 84–98, 2013.
Carter, L. and Manighetti, B.: Glacial/interglacial control of terrigenous and biogenic
fluxes in the deep ocean off a high input, collisional margin: A 139 kyr-record from
New Zealand, Marine Geology, 226, 307–322, 2006.
Carter, L., Neil, H. L., and McCave, I. N.: Glacial to interglacial changes in non-carbonate
and carbonate accumulation in the SW Pacific Ocean, New Zealand, Palaeogeography,
Palaeoclimatology, Palaeoecology, 162, 333–356, 2000.
Chan, H. Y., Xu, W. Z., Shin, P. K. S., and Cheung, S. G.: Prolonged exposure to low
dissolved oxygen affects early development and swimming behaviour in the gastropod
REFERENCES
Chase, Z., Anderson, R. F., Fleisher, M. Q., and Kubik, P. W.: Accumulation of biogenic
and lithogenic material in the Pacific sector of the Southern Ocean during the past
40,000 years, Deep Sea Research Part II: Topical Studies in Oceanography, 50, 799–
832, 2003.
Chiswell, S. M. and Sutton, P. J. H.: A Deep Eddy in the Antarctic Intermediate Water
North of the Chatham Rise, Journal of Physical Oceanography, 28, 535–540, 1998.
Chiswell, S. M., Bostock, H. C., Sutton, P. J., and Williams, M. J.: Physical oceanography
of the deep seas around New Zealand: a review, New Zealand Journal of Marine and
Freshwater Research, 49, 1–32, 2015.
Chu, J. W. F. and Tunnicliffe, V.: Oxygen limitations on marine animal distributions
and the collapse of epibenthic community structure during shoaling hypoxia, Global
Change Biology, 21, 2989–3004, 2015.
Colodner, D.: PhD thesis: The marine geochemistry of rhenium, iridium and platinum,
Massachusetts Institute of Technology, 1991.
Corliss, B. H.: Microhabitats of benthic foraminifera within deep-sea sediments, Nature,
314, 435–438, 1985.
Crusius, J., Calvert, S., Pedersen, T., and Sage, D.: Rhenium and molybdenum
enrich-ments in sedienrich-ments as indicators of oxic, suboxic and sulfidic conditions of deposition,
Earth and Planetary Science Letters, 145, 65–78, 1996.
Curry, W. B. and Oppo, D. W.: Glacial water mass geometry and the distribution of
δ13C of ΣCO2 in the western Atlantic Ocean, Paleoceanography, 20, 2005.
Deacon, M.: A general account of the hydrology of the South Atlantic Ocean, 1933.
DePasquale, E., Baumann, H., and Gobler, C. J.: Vulnerability of early life stage
North-west Atlantic forage fish to ocean acidification and low oxygen, Marine Ecology Progress
Ocean deoxygenation: a paleo-proxy perspective
Deutsch, C., Sarmiento, J. L., Sigman, D. M., Gruber, N., and Dunne, J. P.: Spatial
coupling of nitrogen inputs and losses in the ocean, Nature, 445, 163–167, 2007.
Dezileau, L., Bareille, G., and Reyss, J. L.: The 231Pa/230Th ratio as a proxy for past
changes in opal fluxes in the Indian sector of the Southern Ocean, Marine Chemistry,
81, 105–117, 2003.
Diaz, R. J. and Rosenberg, R.: Spreading dead zones and consequences for marine
ecosys-tems, Science, 321, 926–929, 2008.
Downes, S. M., Bindoff, N. L., and Rintoul, S. R.: Impacts of climate change on the
subduction of mode and intermediate water masses in the Southern Ocean, Journal of
Climate, 22, 3289–3302, 2009.
Downes, S. M., Bindoff, N. L., and Rintoul, S. R.: Changes in the subduction of Southern
Ocean water masses at the end of the twenty-first century in eight IPCC models, Journal
of Climate, 23, 6526–6541, 2010.
Downes, S. M., Budnick, A. S., Sarmiento, J. L., and Farneti, R.: Impacts of wind stress
on the Antarctic Circumpolar Current fronts and associated subduction, Geophysical
Research Letters, 38, 2011.
Ellwood, M. J., Kelly, M., Neil, H., and Nodder, S. D.: Reconstruction of paleo–particulate
organic carbon fluxes for the Campbell Plateau region of southern New Zealand using
the zinc content of sponge spicules, Paleoceanography, 20, 2005.
Elmore, A. C., McClymont, E. L., Elderfield, H., Kender, S., Cook, M. R., Leng, M. J.,
Greaves, M., and Misra, S.: Antarctic Intermediate Water properties since 400 ka
recorded in infaunal (Uvigerina peregrina) and epifaunal (Planulina wuellerstorfi)
ben-thic foraminifera, Earth and Planetary Science Letters, 428, 193–203, 2015.
Emerson, S. R. and Bushinsky, S.: Oxygen Concentrations and Biological Fluxes in the
REFERENCES
Flores, E. M. M.: Microwave-assisted sample preparation for trace element determination,
Elsevier, Amsterdam, 2014.
Forc´en-V`azquez, A.: PhD thesis: Oceanography of the New Zealand subantarctic region,
University of Wellington, 2014.
Francois, R., Frank, M., Rutgers van der Loeff, M. M., and Bacon, M. P.: 230Th
normal-ization: An essential tool for interpreting sedimentary fluxes during the late Quaternary,
Paleoceanography, 19, 2004.
Frank, M., Gersonde, R., and Mangini, A.: Sediment Redistribution, 230Thex-
Normal-ization and Implications for the Reconstruction of Particle Flux and Export
Paleo-productivity, in: Use of Proxies in Paleoceanography, pp. 409–426, Springer Berlin
Heidelberg, Berlin, Heidelberg, 1999.
Gille, S. T.: Warming of the Southern Ocean since the 1950s, Science, 295, 1275–1277,
2002.
Hanawa, K. and Talley, L. D.: Mode waters, International Geophysics Series, 77, 373–386,
2001.
Helm, K. P., Bindoff, N. L., and Church, J. A.: Observed decreases in oxygen content of
the global ocean, Geophysical Research Letters, 38, 2011.
Ikehara, M., Kawamura, K., Ohkouchi, N., Murayama, M., Nakamura, T., and Taira, A.:
Variations of terrestrial input and marine productivity in the Southern Ocean (48°S)
during the last two deglaciations, Paleoceanography, 15, 170–180, 2000.
Jaccard, S. L. and Galbraith, E. D.: Large climate-driven changes of oceanic oxygen
concentrations during the last deglaciation, Nature Geoscience, 5, 151–156, 2012.
Jaccard, S. L., Galbraith, E. D., Froelicher, T. L., and Gruber, N.: Ocean
(De)Oxygenation across the last deglaciation, insights for the future, Oceanography,
Ocean deoxygenation: a paleo-proxy perspective
Karstensen, J., Stramma, L., and Visbeck, M.: Oxygen minimum zones in the eastern
tropical Atlantic and Pacific oceans, Progress in Oceanography, 77, 331–350, 2008.
Keeling, R. F., K¨ortzinger, A., and Gruber, N.: Ocean deoxygenation in a warming world,
Annual Review of Marine Science, 2, 199–229, 2010.
Kowalski, E. A. and A Meyers, P.: Glacial–interglacial variations in Quaternary
produc-tion of marine organic matter at DSDP Site 594, Chatham Rise, southeastern New
Zealand margin, Marine Geology, 140, 249–263, 1997.
Kroopnick, P. M.: The distribution of 13C of ΣCO2 in the world oceans, Deep Sea
Research Part A. Oceanographic Research Papers, 32, 57–84, 1985.
Kuss, H.-M.: Applications of microwave digestion technique for elemental analyses,
Fre-senius’ Journal of Analytical Chemistry, 343, 788–793, 1992.
Lachkar, Z., Orr, J. C., Dutay, J. C., and Delecluse, P.: Effects of mesoscale eddies on
global ocean distributions of CFC-11, CO2, and Delta C-14, Ocean Science, 3, 461–482,
2007.
Lachkar, Z., Orr, J. C., Dutay, J.-C., and Delecluse, P.: On the role of mesoscale eddies
in the ventilation of Antarctic intermediate water, Deep Sea Research Part I:
Oceano-graphic Research Papers, 56, 909–925, 2009.
Lean, C. M. B. and McCave, I. N.: Glacial to interglacial mineral magnetic and
palaeo-ceanographic changes at Chatham Rise, SW Pacific Ocean, Earth and Planetary Science
Letters, 163, 247–260, 1998.
Lynch-Stieglitz, J. and Fairbanks, R. G.: Glacial-interglacial history of Antarctic
Interme-diate Water: relative strengths of Antarctic versus Indian Ocean sources,
Paleoceanog-raphy, 9, 7–29, 1994.
Matear, R. and Hirst, A.: Long-term changes in dissolved oxygen concentrations in the
REFERENCES
Matear, R., Hirst, A., and McNeil, B.: Changes in dissolved oxygen in the Southern
Ocean with climate change, Geochemistry, Geophysics, Geosystems, 1, 1050, 2000.
McCartney, M. S.: Subantarctic Mode Water, Woods Hole Oceanographic Institution,
Woods Hole, 1979.
Molinelli, E. J.: The Antarctic influence on Antarctic intermediate water, Journal of
Marine Research, 39, 267–293, 1981.
Morford, J. L. and Emerson, S.: The geochemistry of redox sensitive trace metals in
sediments, Geochimica et Cosmochimica Acta, 63, 1735–1750, 1999.
Muratli, J., Chase, Z., Mix, A., and McManus, J.: Increased glacial-age ventilation of the
Chilean margin by Antarctic Intermediate Water, Nature Geoscience, 3, 23–26, 2009.
Nameroff, T. J., Calvert, S. E., and Murray, J. W.: Glacial-interglacial variability in
the eastern tropical North Pacific oxygen minimum zone recorded by redox-sensitive
trace metals, Paleoceanography, 19, n/a–n/a, doi:10.1029/2003PA000912, URL http:
//dx.doi.org/10.1029/2003PA000912, pA1010, 2004.
Negre, C., Thomas, A. L., Mas, J. L., Garcia-Orellana, J., Henderson, G. M., Masqu´e,
P., and Zahn, R.: Separation and measurement of Pa, Th, and U isotopes in marine
sediments by microwave-assisted digestion and multiple collector inductively coupled
plasma mass spectrometry, Analytical Chemistry, 81, 1914–1919, 2009.
Nevison, C. D., Weiss, R. F., and Erickson, D. J.: Global oceanic emissions of nitrous
oxide, Journal of Geophysical Research, 100, 15 809–15 820, 1995.
Pahnke, K. and Zahn, R.: Southern Hemisphere water mass conversion linked with North
Atlantic climate variability, Science, 307, 1741–1746, 2005.
Paytan, A., Kastner, M., and Chavez, F. P.: Glacial to interglacial fluctuations in
produc-tivity in the equatorial Pacific as indicated by marine barite, Science, 274, 1355–1357,
Ocean deoxygenation: a paleo-proxy perspective
Piola, A. R. and Georgi, D. T.: Circumpolar properties of Antarctic intermediate water
and Subantarctic Mode Water, Deep Sea Research Part A. Oceanographic Research
Papers, 29, 687–711, 1982.
Ragueneau, O., Leynaert, A., Tr´eguer, P., Demaster, D. J., and Anderson, R. F.: Opal
studied as a marker of paleoproductivity, Eos, Transactions American Geophysical
Union, 77, 491–491, 1996.
Reid, J. L.: On the total geostrophic circulation of the Pacific Ocean: flow patterns,
tracers, and transports, Progress in Oceanography, 39, 263–352, 1997.
Rickaby, R. and Elderfield, H.: Evidence from the high-latitude North Atlantic for
varia-tions in Antarctic Intermediate water flow during the last deglaciation, Geochemistry,
Geophysics, Geosystems, 6, 2005.
Rintoul, S. R. and England, M. H.: Ekman Transport Dominates Local Air–Sea Fluxes
in Driving Variability of Subantarctic Mode Water, Journal of Physical Oceanography,
32, 1308–1321, 2010.
Ronge, T. A., Steph, S., Tiedemann, R., Prange, M., Merkel, U., N¨urnberg, D., and Kuhn,
G.: Pushing the boundaries: Glacial/Interglacial variability of intermediate- and
deep-waters in the southwest Pacific over the last 350,000 years, Paleoceanography, 30, 23–38,
2015.
Rousseau, J., Ellwood, M. J., Bostock, H. C., and Neil, H.: Estimates of late Quaternary
mode and intermediate water silicic acid concentration in the Pacific Southern Ocean,
Earth and Planetary Science Letters, 439, 101–108, 2016.
Sallee, J.-B., Speer, K., Rintoul, S., and Wijffels, S.: Southern Ocean Thermocline
Ven-tilation, Journal of Physical Oceanography, 40, 509–529, 2010.
Schmidtko, S. and Johnson, G. C.: Multidecadal Warming and Shoaling of Antarctic