CLIMATE TRENDS AT MACQUARIE ISLAND AND EXPECTATIONS OF FUTURE
CLIMATE CHANGE IN THE SUB-ANTARCTIC
by Neil Adams
(with 11 text-figures)
Adams, N. 2009 (11 :xi): Climate trends at Macquarie Island and expectations of future climate change in the sub-Antarctic. Papers and
Proceedings of the Royal Society ofTasmania 143 (I): 1-8. https://doi.org/10.26749/rstpp.143.1.1 ISSN 0080-4 703.
Bureau ofMeteorology, GPO Box 727, Hobart, Tasmania 7001, Australia. Email: N.Adams@bom.gov.au
Macquarie Island has experienced a marked shift in its climate since 1970, with increasing precipitation, accompanied by a steady increase in mean wind speed associated with increased cyclonic activity. These trends are consistent with an increase in the Southern Annular Mode (SAM) index, albeit with a shift to an anomalous atmospheric trough over the western Pacific Ocean. However, our understanding of the twentieth-century climate across the entire sub-Antarctic is limited by very sparse data and the relatively poor quality of global re-analyses across the Southern Hemisphere. Chapter IO of the Inter-governmental Panel on Climate Change (IPCC) fourth Assessment Report (AR4) provides an assessment of global atmospheric trends out to the end of the twenty-first century and provides some clues as to the regional trends expected across the sub-Antarctic. This paper provides a synopsis of the changes experienced at Macquarie Island, and a look to future trends, and the need for increased atmospheric research in the mid- to high latitudes of the Southern Hemisphere.
Key Words: climate, climate change, Macquarie Island, sub-Antarctic.
INTRODUCTION
Variability and change in the weather and climate of the sub-Antarctic have received very little attention in the scientific literature. This region of the Southern Hemisphere has its southern boundary near the Antarctic convergence and a somewhat arbitrary northern boundary around 40°5.
Pendlebury & Barnes-Keoghan (2007) provided a very good synopsis of the climate and climate change science in the sub Antarctic but highlighted the very real need for more research. Fyfe (2003) in his modelling study on extra-tropical cyclones in the Southern Hemisphere concluded that the number of cyclones in the sub-Antarctic oceans has been decreasing over the past 50 years, and is projected out to 2100 to continue decreasing, with a continued drying and
warming trend for the sub-Antarctic. Chapter 10 of the Inter-governmental Panel on Climate Change (IPCC) fourth Assessment Report (IPCC AR4) (IPCC 2007) also highlighted a significant warming
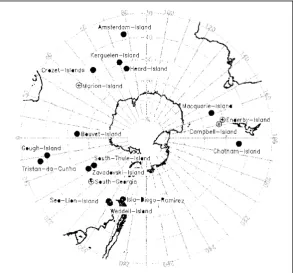
to monitor the sub-Antarctic climate. Figure 1 shows the sparse network of stations darted across the islands of the sub Antarctic, and highlights the complete lack of observational sites directly south of the Australian mainland.
Of the two Australian sub-Antarctic islands, only Macquarie Island has an unbroken meteorological record that stretches back to 1948, whereas the record for Heard Island is discontinuous, with the bulk of observations limited to surface pressure and temperature. However, the Macquarie Island record offers a wealth of information from which to make comment on climate variability and change on the island and place these in the context of changes within the entire sub-Antarctic region. Furthermore the Macquarie Island weather record is a valuable quantum of
Amsterdam-Island
ffi'.
Kerguelen-lsland '
�
. trend across the sub-Antarctic over allseasons. However, precipitation changes were both regionally and seasonally more complex than suggested by Fyfe (2003), with a reduction in sub-Antarctic precipitation limited to more northern latitudes during
f
\Crozet-lslcnds
BJ \ .©Heord-lslond
0
(±)Marion-Islandsummer, with winter precipitation generally increasing over most of the sub-Antarctic and in particular in the longitudes of Macquarie Island. One of the problems in drawing conclusions from such broad-scale modelling studies is that the sub-Antarctic spans all longitudes and regional trends may vary significantly. This is compounded by a key limiting factor in the number of long-term meteorological datasets available
FIG. I -Sub-Antarctic stations reporting meteorological data.
r·
$ Bouvet-lsland.
[image:1.558.218.512.495.768.2]Gough-Island
... ... ·�
... Ef,
ffi ·South-Thule-Island
Tristan-do-Cunha g:i& Zavodovskl-lsland .·.·� .•
<!';Sa uth-Geor;ia
Macquarie-Island EB
J,8Enderby-lsland
, W:· .
-:c:1.,.J'
Campbell�lsiand
,.;r
ffi Chatham-Island
2 NeilAdams
information with which to bC'tter understand broad-scale
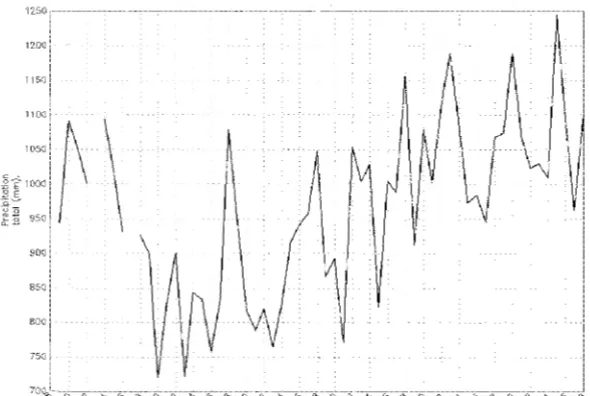
changes seen in the biota of the island itself. Figure 2 shows the annual precipitation totals over the 60-year period from the beginning of records in 1948. In the first two decades of the record a dear reduction in precipitation was observed, followed by a steady and marked increase from around 1970 to the present day, with annual totals over the past decade exceeding those from the beginning of the record. This paper presents an analysis of the meteorological record from Macquarie Island over the 38 years since 1970, places the observed changes within the context of the broader scale changes seen in the sub-Antarctic, and provides a synopsis of some current research into expected changes out to the end of the twenty-first century.
THE
MACQUARIE ISLAND RECORD
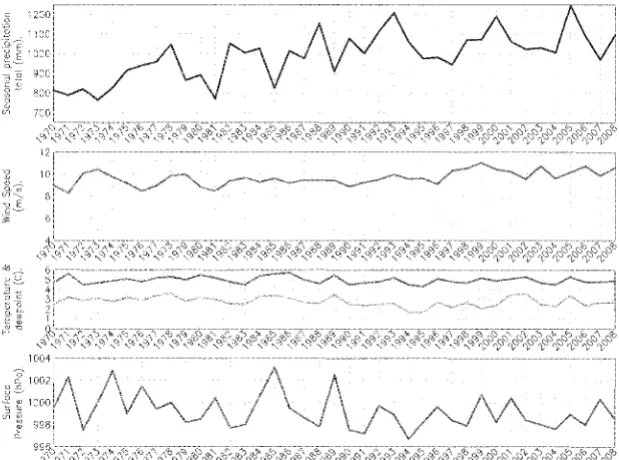
The most striking feature of the Macquarie Island meteorological record is the large change in observed rainfall since 1970. Over the 38 years since then there has been a steady increase in the annual total from around 800 mm/a in the very early 1970s, to around 1080 mm/a averaged over the past several years, as highlighted in the top panel of
figure 3. The steady increase since 1970 amounts to about
a 35% increase in precipitation. This striking change is not mirrored in the other meteorological records, with means in the near-surface wind speed, air temperature, dew-point and surface pressure (lower panels in fig. 3) not showing such striking changes. The wind speed record in figure 3 does show a slight increasing trend, and the dew-point has decreased slightly over the record, as has surface pressure, but these changes are subtle and confound any clear explanation of meteorological changes that would explain the dramatic increase in precipitation.
A seasonal breakdown of the meteorological data shows subtle increases in summer (9%), autumn (20%) and spring (28%) precipitation totals, but with a 55% increase in winter-time precipitation since 1970. August monthly totals in precipitation have increased from 1970 by about 120%. It is unlikely that any inhomogeneities in the rainfall observing practices are responsible for the large increases seen since 1970. Alterations in instrumentation or practice could be an explanation for some of these changes. For
110()
10~0
r
\
10(J(l
950
90(,
8SCJ
example, in 1995 a snowfall recorder was installed on the island to catch snowfall that overflowed the rainfall recorder. However, it is unlikely that this additional amount of measured precipitation would be large, and there is no obvious signal in the rainfall record around this time. Other possible inhomogeneities are still under investigation (Ian Barnes-Keoghan pers. comm.) but it is not expected that any changes in the rainfall recording are likely to be responsible for the observed increases.
Clearly, the precipitation record has been markedly influenced by changes in the winter-time weather. Figure 4 highlights the August rainfall totals since 1970, together with the mean monthly surface weather variables. The precipitation time-series shows a clear step change just after 1980 and a steady increase thereafter. Apart from a subtle increase in mean wind speed, and a decrease in surface pressure, no striking meteorological changes are apparent in the remaining surface weather variables. However, a more careful analysis of the near surface (10 m) wind record highlights differences between the pre-1982 and post-1982 climate. Figure 5a shows the wind-rose analysis for both periods, with the 1982-2008 data in pale grey overlaying the 1970-81 record in black.
There are two aspects of the wind-rose diagrams that are of note. First, the number of observations of northwesterly wind has decreased, the number of observations of a strong
(1 0-20 ms-1) north to northwesterly wind has increased,
and the number of calm days has decreased. The changes in the number of calm days and north to northwesterly flow is even more marked when the 1982-2008 period is compared with the earlier records from 1948-69 (fig. 5b). The reduction in the number of calm days at the island would partly explain the increasing mean wind speeds (figs 3, 4), as would the increases in the strong north to northwesterly flow. Furthermore, the increasing north to northwesterly flow is indicative of a more meridional pattern and suggestive of more active rain-bearing frontal systems sweeping up to the island.
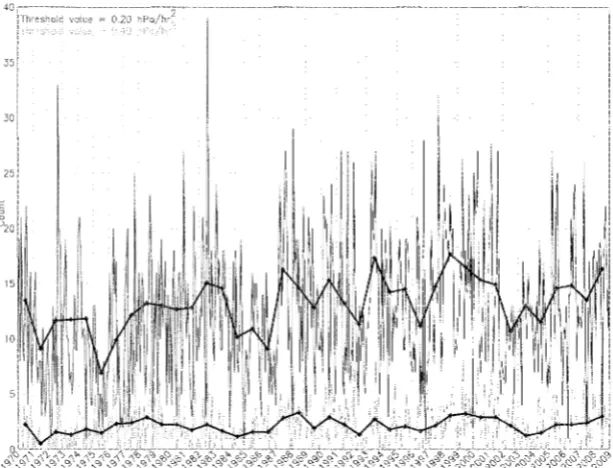
To further investigate cyclonic activity at the island the three-hourly surface pressure record was analysed for cyclonic changes. The second derivative of the pressure with respect to time (6 = d2slp/dt2) was analysed. A positive value of i'l implies falling pressure followed by rising pressure, or more precisely a low pressure event passing the island. The number of these events exceeding threshold values was counted for each month. Figure
6 shows the monthly counts for 0 = 0.2
hPa/h2, (a moderate change), and 0 = 0.4
hPa/h2 , (a strong change), for the period
January 1970 to December 2008, with the annual means overlaid on the charts (thicker lines). A clear upward trend in the number of moderate changes crossing the island has occurred, with an increase from
around 10 events per month to nearly 15
per month. With the strong events, there is a subtle increase from around two events
per month to just under three. Clearly the
inference from the Macquarie Island wind
[image:2.560.45.340.568.766.2]FIG. 3 -- 7he Macquarie Island meteorological record for the period 1970-2008, with annual total precipitation (top panel), annual mean wind speed (second panel), annual mean temperature and dew~
point temperature (third panel) and annual mean surfoce level pressure (bottom panel).
FIG. 4 - 7he Macquarie Island meteorological record for August for the period 1970-2008, with monthly total precipitation (top panel), monthly mean wind speed (second panel), monthly mean temperature and dew-point temperature (third panel) and monthly mean surfoce level pressure (bottom panel).
HG. 5 -lvfacquarie Island near-surfoce wind rose comparison for (A) the period 1970-81 and the period 1982-2008; and (B) the period 1948--69 and the period 1982-2008.
Wmd f~ose data tor station wmo = 94998 (macca-'1970-81)
I 0% of Observations
f---~----1 (Radius of circle=% calm Observations) (34322 Observations used.)
1!1/1970to31/12/1981
(a)
Wind Rose data tor stat1on wrno == 94998 (macca-1948-69)
(600930bservallonsused.)
1/4/1948to31/1?/1969
[image:3.560.206.516.54.284.2] [image:3.560.206.515.315.544.2]4
NeilAdamsFIG. 6 - Significant pressure change events at Macquarie Island, expressed as the number of events in each month where the second order derivative of surface pressure with respect to time exceeded threshold values of 0.20 and 0.40 hPa/ hr2. The annual mean monthly count for both threshold values is also plotted
as thicker dark lines.
FIG. 7 - Upper air anomalies for temperature, dew-point temperature and wind speed for (A) the period 1982-2008 minus the period 1970 to 1981; and (B) the period 2000-2008 minus the period 1990-99.
[image:4.560.48.355.56.290.2] [image:4.560.46.362.296.765.2]and pressure record is rhat the number of crossing the island has u"-"-'"'"'~'
events in an mcrease
in the number of events.
clt Island have not been
confined to near the surface. An of radiosonde data
from 1970-2008 also shows clear throughout the
troposphere and Figure 7a shows the
in the mean upper air wind temperature and
dew-fields post-1980. 1he temperature signal is weak
wilh a very slight cooling in the lower troposphere
500 hPa, and slight in the troposphere. 'T11e
suatosphere has a slight
Wind speeds have increased the allllv,p.ln .. l
but most notably in the 'Ihe
record extends to 500 hPa fur the earlier part
period; there has been a dramatic
free atmosphere between 850 and 500 h Pa
5000- -18 500 feet), which is unlikely to be associated humidity sensor changes" Figure 7b highlights the changes
from the decade pre-2000 to where a small
temperature increase in the lower troposphere is as
is a continued drying in the free atmosphere. Tropospheric
wind haven't altered dranutically, apart from a slight
increase in near-surface wind
ln summary, an analysis of the weather record at Macquarie Island has highlighted a shift in the weather regime around
1982, to a pattern that is slightly windier, and drier through
the free atmosphere compared with the pre-1982 climate. The higher precipitation totals are consistent with an increase in significant cyclonic weather events, occurring in
a background atmosphere that is with the increases
most notable during the winter months. Tne increased mean wind speed, coupled with the drier atmosphere has probably
led to an increase in surface evaporation and a drying of the
island surface, although there are no records
from the island to verify this. 'The increases in wind speed
and decreases in free atmosphere dew-points appear to agree
with the trends noted by Fyfe (2003). However, the increase
in precipitation appears to be at odds with his findings. An
analysis ofERA-40 re-analysis data in the following section attempts ro address this issue in defining the regional nature of the sub-Antarctic zone.
ERA-40 RE-ANALYSIS DATA OVER
E
SUB-ANTARCTIC
The European Centre for Medium Range Weather Forecasting
(ECMWF) has undertaken a re-analysis project (ERA40) to
produce an analysis dataset of the global atmosphere spanning
the period 1957-2002. These arc generated using
all available surface, upper air and satellite observations, and assimilated within a modern Numerical Weather Prediction model to produce a four-dimensional grid of weather elements spanning the global troposphere and stratosphere, four times a day for the full period (Uppala et al. 2005). The ERA40 re-analysis dataset is just one of several datasets available to researchers, with the other most notable being the NCEP-NCAR re-analysis project (Kalnay et al. 1996). However, several studies have highlighted issues with the NCEP/ NCAR re-analysis data at high southern latitudes (Marshall
2003, Bromwich & Fogt 2004) and noted the improved
representation of high southern latitudes within the ERA40 data. Both studies highlighted the significant improvement in the re-analyses post-1979 as a result of the introduction
of satellite data into the (2004) further noted that did improve from 1970 onwards.
and Bromwich et al.
of the ERA40 analyses
To highlight the accuracy of the ERJ'AO re-analyses, monthly means of near-surface weather parameters from the analysis grid-point closest to Macquarie Island were extracted
for the period 1970-2002 and compared to the observations
from Macquaric Island R). Several key points are of
note from the comparison. First, the ERA40 precipitation analysis does nm increase as much as observed over the 32-year period, although rbere is an upward trend. Second, the
re-analysis wind are lower than observed. the
remammg of temperatun:, dew-point and surface
pressure are remarkabiywell-structured within the
data. Observations of are not assimilated
re-analysis but are through parameterisarion
schemes the numerical weather prediction
model. These parameterisation schemes may not necessarily capture all of the physical process involved in the hydrological cycle. For example, the resolution of the re-analysis system
is such that Island is not resolved and the
point used within the system is entirely oceanic, meaning that no orographic influences on the precipitation would be
present. 'Ihe weaker wind within the model may be
a reflection of the relatively coarse horizontal resolution of the model (approximately 125 km), or the parameterisation
scheme used to reduce the model wind speeds down to the
10m level. However, the trends in the wind speed are very well reproduced over the 32-year period.
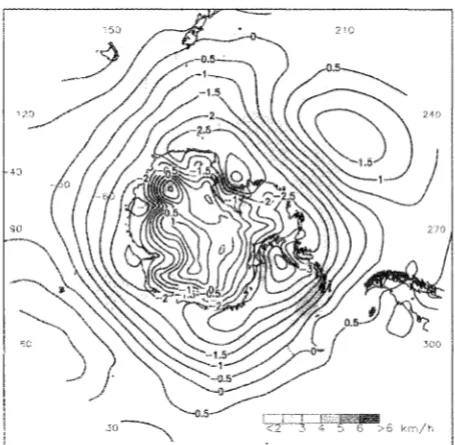
To further investigate the dynamical reasons behind the shift in Macquarie Island weather posr-1981 the long-term differences in the ERA40 near-surface wind and pressure were compared for the period 1970-81, and 1982-2002. Figure 9 shows the difference field of wind speed (grey shaded) between the two periods, with the contour analysis showing the surface pressure differences. In broad terms there is a notable increase in the speed of the westerly flow in the sub-Antarctic zone (50°S-60oS) over much of the hemisphere,
zn wind
[image:5.560.288.516.501.724.2]6
NeilAdamsFIG. IO-ERA40 diffirence patterns over the Macquarie Island sector for (A) near surface wind speed (greyscale shaded plot) and sea level pressure (contour analysis) for the period I982-2002 minus the period I970-8I; and (B) precipitation for the period I982-2002 minus the period I970-I98I.
-40
A
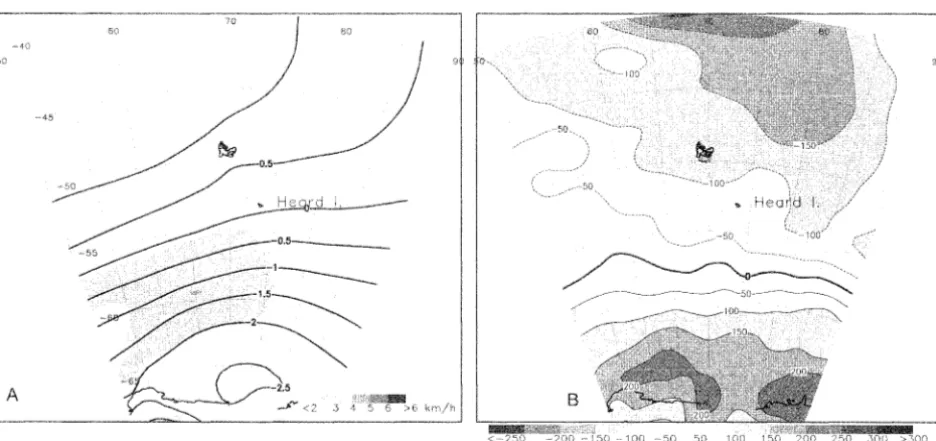
FIG. II - ERA40 diffirence patterns over the Heard Island sector for (A) near surface wind speed (greyscale shaded plot) and sea level pressure {contour analysis) for the period I982-2002 minus the period I970-8I; and(B) Precipitation for the period
[image:6.562.47.522.112.328.2] [image:6.562.48.516.396.616.2]to the south of Australia. The increasing flow is consistent with the studies Fyfe 2003) an increase in the Southern
Mode (SAM) index (Marshall 2003) over the past several decades. In the longitudes of Macquarie Island the most notable feature in figure 9 is the strong trough oflow pressure in the westerly flow extending out of the Antarctic near Cape Adare (l and northward just east of Zealand. Pigure lOa highlights the lsland area of figure 9 and the shift to more cyclonic
quite evident. 1he difference field in is shown in f1gure 1 Ob and the associated increase in precipitation associated with the increase in is evident over rhe island and to the southeast and south.
Ihe regional differences in two decades shown in figure 9 arc quite need to be careful in malting generaiised statements about changes across the entire sub-Antarctic obvious. l l shows the same information as in figure 10 but for the area around Heard Island, and quite clearly the at Heard Island are significantly different to those at Island. Wind speeds have increased slightly and the
have become slightly more cyclonic as at However, Heard Island has experienced
pressure and the annual precipitation totals fallen quite significantly in the ERA40 re-analyses, consistent with the generalised statements of changes in the sub-Antarctic by Fyfe (2003), and comparable the NCEP-NCAR reanalysis data (http://www.bom.gov.au/cgi-bin/ climate/ change/trendmaps.cgi).
FUTURE TRENDS IN
E SUB-ANTARCTIC
Little may be found in the literature specifically addressing the issues of climate variability and change in the sub-Antarctic. From an analysis of transient climate change scenarios spanning 1850-2100 based on the Global Climate Model (GCM) from the Canadian Centre for Climate Modelling (CCCma), Pyfe concluded that under a "business as usual" carbon emissions scenario, the number of sub·-Antarctic Ocean would continue
to fall and be at 30% of early twentieth-century numbers by the end of the century, with the depth of these cyclones also diminishing. 1he analysis also concluded that the number of Antarctic Ocean cyclones would increase which
is consistent v.rith a polevvard shlft in the baroclinic zone
and increasing westerly Aow through the southern regions of the sub-Antarctic. 'The looked at sub-Antarctic-wide statistics but, as mentioned, the ERA40 re-analysis data show strong regional differences across the sub-Antarctic.
ln the IPCC AR4 a multi-model was taken to assess likely atmospheric changes out to the end of the twenty-first century. In an analysis of the mid- to high carbon emissions scenario (A1 B) AR4 (chapter 10, IPCC 2007) also concluded that the observed increasing trend in the SAM index would continue out to the end of the century. However, the report differed in the expected changes in precipitation across the sub-Antarctic, highlighting significant regional and seasonal differences. Figure 10.9 from the report link to chapter 10 under http://www.ipcc.ch/ipccreports/ ar4-wgl.htrn) highlights the expected changes between the multi-model means for the period 2080-99 relative
rhe sub-Antarctic summer months a reduction in is expected southward to around 50°5, although rrf'-vv:lvf' pattern with areas of increased precipitation the east coast of South America, south of Madagascar in the longitudes of Macquarie Island
and New Zealand, although not at a statistically significant level. significant summer-time increases in ex]pe,:teei between 55oS and 65°S. During mulli-modcl ensemble mean shows a statistically significant increase in precipitation over much of the sub--Antarctic highlights local maxima in the increase in the Island longitudes. "Jhe winter-time trends in figure l 0.9 from the highlight a of the polar trough
the south of Island, with an increase in pressure over Ausualia and the north island of New L__,c,,u.'-"'"'
giving a trend towards a strengthening winter-time long wave trough west of Island.
CONCLUSIONS
An analysis of the Island observational record has shown a dear trend in increasing precipitation and a modest increase in wind speed on theisland oven he past four decades, consistent with rhe expected response to a globally changing climate under increased greenhouse gases. Re-analysis data from the ERA40 has captured the changing sub-Antarctic environment, characterised increasing "''"'«P'""' flow in the mid-latitudes with a corresponding increased to the south
of
the sub-Antarctic resulting in regional increases in precipitation over parts of the sub-Antarctic, Analysis of the multi-model output for the AlB scenario from the IPCC AR4 climate projections suggests a continuation of these trends over the twenty-first century although the details of these changes over the sub-Antarctic are not well resolved.The sub-Antarctic needs a more careful analysis of the past and current climate to better understand the atmospheric dynamics and the of the system over the coming decades to climate
ACKNOWLEDGEMENTS
Ihe :ER/1}.40 data vvere supplied
Centre for Medium Range Weather Forecasting
'Thanks to Ian Barnes-Keoghan for assistance in verifying the surface observations from Island.
REFERENCES
Bromwich, D.H. & Fogt, R.L 2004: Strong trends in the skill of the ERAAO and NCEP-NCAR reanalyses in the high and midlatitudes of the Southern Hemisphere. journal of
Climate 17: 4603--4619.
Fyfe,
J.C.
2003: Extratropical Southern Hemisphereharbingers of climate change? of Climate 16:
2802-2805.
IPCC 2007: Climate Change 2007: The Science Basis. Contributions of Working Group to the Fourth
Assessment Report of the Intergovernmental Panel on
8 NeilAdams
Z. Chen, M.
L. Miller ( eds)].
UK and New York NY, 9%
Ka.lnay, E. Kanru:nitsu, M., Kistler, R., Deaven, D., Gaudin, L, Iredell, M., Saha, S., \Vhite, G., "Wi:wHen,
J.,
Zhu, Y., l.eetmaa, A., ancl R 1996: 'The NCEP/NCARAmerican
Marshall, G.J. 2003: from observations and
4134-4143.
Pendlelmry, S.E & Barnes-Keoghan, Ll~
climate in the Sub-Antarctic.
Mode Hi: 2007: Climate and
S.M., Killlberg, P.W., Simmons, U., da Costa Bechtold, V., Fiorino, M., Gibson,
J.K.,
Haseler,
J.,
Hernandez, A., Kelly, G.A., Li, X., Onogi, K., Saarinen, S., Sokka, N., Allan, R.I~, Andersson,E., Arpe, K., Balmaseda, M.A., Beljaars, A.C.M.,
va.."l de Berg, L., Bi.dlot,
J.,
Bormann, N., Caires, S., Chevallier, E, Dethof, A., Dragosavac, lVI., Fisher, M., Fuentes, M., Hagemann, S., Holm, E., Hoskins, B.J.,Isaksen, L., Janssen, R., McNally, A.P., Mahfout:J.-F., Morcrette,J.-J., Rayner, N.A., Saunders, R.W., Simon, I~, Sterl, A., Trenberth, ICE., Untch, A., Vasiljevk, D., Viterbo, P. & Woollen, The
ERA-40 tc-.oHdtY""· '-'"UilUIV