Assessing the drivers shaping global patterns of urban vegetation
landscape structure
C. Dobbs
a,⁎
, C. Nitschke
b, D. Kendal
baDepartamento de Medio Ambiente y Ecosistemas, Facultad de Agronomia e Ingenieria Forestal, Pontificia Universidad Catolica de Chile, Vicuna Mackenna 4860, Macul, Santiago, Chile bSchool of Ecosystem and Forest Sciences, University of Melbourne, VIC 3010, Australia
H I G H L I G H T S
• We studied urban vegetation at the landscape scale for one hundred cities and its relation to sociodemographic and climate
• The landscape metrics best describing urban vegetation structure: amount, fragmentation and distribution of green cover
•The climate and socioeconomic context relates to the degree of fragmentation and amount of urban vegetation
•Planning can improve vegetation struc-ture by increasing, connecting and bet-ter distributing vegetation in cities
G R A P H I C A L A B S T R A C T
a b s t r a c t
a r t i c l e i n f o
Article history:
Received 12 December 2016 Received in revised form 7 March 2017 Accepted 7 March 2017
Available online xxxx
Editor: Elena Paoletti
Vegetation is one of the main resources involve in ecosystem functioning and providing ecosystem services in urban areas. Little is known on the landscape structure patterns of vegetation existing in urban areas at the global scale and the drivers of these patterns. We studied the landscape structure of one hundred cities around the globe, and their relation to demography (population), socioeconomic factors (GDP, Gini Index), climate factors (temperature and rain) and topographic characteristics (altitude, variation in altitude). The data revealed that the best descriptors of landscape structure were amount, fragmentation and spatial distribution of vegetation. Populated cities tend to have less, more fragmented, less connected vegetation with a centre of the city with low vegetation cover. Results also provided insights on the influence of socioeconomics at a global scale, as land-scape structure was more fragmented in areas that are economically unequal and coming from emergent econ-omies. This study shows the effects of the social system and climate on urban landscape patterns that gives useful insights for the distribution in the provision of ecosystem services in urban areas and therefore the maintenance of human well-being. This information can support local and global policy and planning which is committing our cities to provide accessible and inclusive green space for all urban inhabitants.
© 2017 Elsevier B.V. All rights reserved. Keywords:
Urban ecosystems Socio-ecological systems Urban ecology Landscape metrics Climate GDP Gini Index
1. Introduction
Urbanization constantly reshapes the structure and extent of cities and towns. The consequences of this process includes the expansion of urban areas, urban population growth, environmental degradation, and exploitation of natural resources which are often detrimental to ⁎ Corresponding author at: Departamento de Medio Ambiente y Ecosistemas, Facultad
de Agronomia e Ingenieria Forestal, Pontificia Universidad Catolica de Chile, Vicuna Mackenna 4860, Macul, Santiago, Chile.
E-mail address:cydobbs@uc.cl(C. Dobbs).
http://dx.doi.org/10.1016/j.scitotenv.2017.03.058
0048-9697/© 2017 Elsevier B.V. All rights reserved.
Contents lists available atScienceDirect
Science of the Total Environment
biodiversity and the provisioning of ecosystem services (McDonald, 2008; Secretariat of the Convention on Biological Diversity, 2012). Urban planning and local and international policymaking can minimise or even reverse these impacts by integrating the process of urbanization with urban greening in cities (Grimm et al., 2008a; McDonald, 2008). Implementing these goals relies on the recognition and understanding of the effects of urbanization on biodiversity and ecosystem services.
Vegetation is one of the main providers of ecosystem services in urban environments, sequestering and storing carbon, regulating cli-mate, facilitating soil productivity, providing recreational opportunities; and, regulatingflooding (Escobedo and Nowak, 2009; Dobbs et al., 2011; Pataki et al., 2011). Urbanization results in massive changes in vegetation patterns, which typically become reduced, fragmented and dispersed. Understanding existing composition and structural patterns of urban vegetation is necessary to inform planning and aid in achieving sustainable development. The quantification of global urban vegetation patterns is required to provide baseline information for assessing eco-system services and for determining which local planning instruments are best suited to facilitate the development of sustainable cities (Grimm et al., 2008a).
The structure of vegetation, as an expression of its configuration and connectivity in the landscape, is important for understanding how ur-banization is linked to the provision of ecosystem services (Mitchell et al., 2013). Yet previous studies have typically focussed on the quanti-ty of vegetation alone (e.g. tree cover) rather than the structure of the vegetation (e.g. patchiness, connectivity). For example,Kendal et al. (2011)and Aronson et al. (2014) explored the composition of urban vegetation globally but not the spatial context in which those species were embedded. Many global studies of urbanization have explored urban form (Bigsby et al., 2014) and focused on the measurement of im-permeable surfaces (Angel et al., 2005; Huang et al., 2007; Schwarz, 2010). Studies focussed on the landscape structure of vegetation are more commonly explored at the city and at the regional scale (Schneider and Woodcock, 2008; Seto and Shepherd, 2009); however, there has been little exploration of urban landscape vegetation patterns in much of the world including Australasia, Latin America or Africa (Luck et al., 2009; Inostroza et al., 2012; Banzhaf et al., 2013).
It is necessary to understand links between vegetation patterns, so-cial systems and human behaviour (Angelstam et al., 2013); as urban vegetation patterns are the result of both biophysical and socio-cultural factors (Alberti and Marzluff, 2004; Grimm et al., 2008a; Bigsby et al., 2014; Ramage et al., 2013). Most research on the drivers of urban vegetation patterns have been restricted to biophysical factors; however, a few studies have found that income, race and education are important drivers of vegetation diversity (Kinzig et al., 2005; Escobedo et al., 2006; Boone et al., 2009; Cook et al., 2011; Kendal et al., 2012; Bigsby et al., 2014) and structure (Grove et al., 2006; Lin et al., 2017). The relationship between vegetation patterns and socio-economic var-iables is not unidirectional and depends on the characteristics of both the city and its inhabitants. Analogous results have been found in the urban morphology literature, where patterns of the urban form were re-lated not only to urban economies, topography or hydrology, but also to technological advances and political change (Irwin et al., 2009). Like Irwin et al. (2009), we recognize the existence of underlying processes that drive urban dynamics and that the effects of these are not necessar-ily equal among cities. There is a need however for increased under-standing of how the interaction among bio-socio-political factors and nature creates spatial heterogeneity (Musacchio, 2011) and how to in-corporate this information into decision-making.
Here we seek to understand, at a global scale, the combination of economic, social and bioclimatic processes shaping vegetation structure that are forming and transforming cities. We determine their role using a landscape approach, which integrates social and ecological systems (Folke et al., 2005; Axelsson et al., 2011). In order to demonstrate this relationship, a selection of commonly used landscape metrics obtained from remote sensing were used to compare vegetation patterns from
100 cities located on six continents. We hypothesize that observed pat-terns are not necessarily the same for cities with similar demographics, economies or climate alone, but that the combination of these factors shapes the amount, size and distribution of vegetation. Understanding the range of consequences that urbanization has for vegetation is neces-sary to better inform urban planning. The information generated by this research will add to the knowledge on the effects of urbanization on vegetation and inform the development of appropriate urban greening targets based on the social and biophysical context of a city.
2. Materials and methods
One hundred cities around the world were selected from a pool of urban areas with N100.000 inhabitants stratified by location i.e. America, Australasia, Europe and Africa. The set of cities include a wide range of climate, economies, demographics, political backgrounds, ages, sizes, and shapes. The list of cities is supplied in Supplementary material (Table A.1). Cities were selected from a global pool where good quality satellite imagery (Landsat 5 TM) was available during the vegetation growing season between years 2006 to 2011. Remote sens-ing was used to extract urban vegetation; we used Landsat imagery cap-tured within the last 5 years (USGS,http://earthexplorer.usgs.gov/) and from late spring in each hemisphere. A detailed description of the meth-od to extract urban vegetation can be found inDobbs et al. (2014).
To extract vegetation, the red and infrared bands were used and a combination of the normalized difference vegetation index (NDVI) and normalized built-up index (NDBI) was calculated (Zha et al., 2003). An unsupervised classification was applied to the resulting image following the methods used byZha et al. (2003),Jensen (2005), Buyantuyev and Wu (2007)andHe et al. (2010). We created a map with 3 classes: vegetation, impermeable surface, and water. An accuracy assessment of the classification was done by selecting 160 random points from high resolution imagery (Google Earth) for each city. The land cover accuracy as determined by the Kappa coefficient was 0.8, suggesting that classification is in substantial agreement with observed land cover (Coops et al., 2011). The user's accuracy was 75% and 85% for vegetation and impermeable areas respectively, while the producer's accuracy for vegetation was 80% and for impermeable areas 82%.
2.1. Landscape metrics
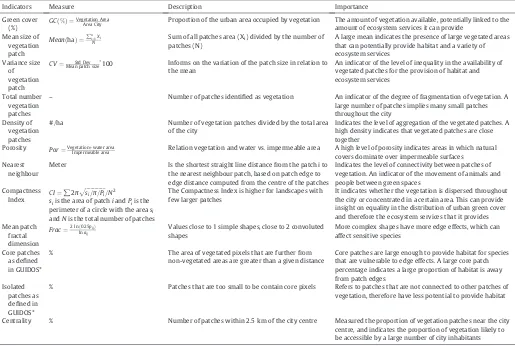
To evaluate the spatial patterns of vegetation and corresponding bio-diversity and ecosystem services they support, the mean and standard deviation of 13 landscape metrics were calculated from the extracted vegetation land cover map, followingForman (1995),Riitters et al. (1995)andVogt et al. (2006). The selected metrics included measures of landscape composition, connectivity and configuration (Table 1). Vegetation patch size, core area (i.e. patches big enough to provide one hectare of interior habitat:Vogt et al., 2006; Bierwagen, 2007) and connectivity affect ecosystem services such as carbon sequestration,
flood regulation, climate regulation, biodiversity potential (Whitford et al., 2001; Tratalos et al., 2007), the probability of occupancy and per-sistence for some species (Fahrig, 2003); and, theflows of energy, mate-rial and species across the urban landscape (Zipperer et al., 2000). The distribution of urban vegetation can also influence human well-being by spatially aggregating/segregating ecosystem services within an urban landscape (Pedlowski et al., 2002). Segregation of urban vegeta-tion can affect thermal comfort (Jenerette et al., 2016) and access to green spaces and natural areas (Romero et al., 2012).
2.2. Socio-biophysical metrics
At the local and regional scales several studies have shown that social drivers, such as total population, income and education level, can shape vegetation structure, distribution and composition (Heynen et al., 2006; Fuller and Gaston, 2009; Kendal et al., 2012). Physical vari-ables such as climate and topography can also shape vegetation patterns at regional scales (Nowak et al., 1996; Grimm et al., 2008b).
2.3. Data analysis
A subset of landscape metrics were selected for further analysis using a principal component analysis (PCA); a technique commonly used in urban morphology, sustainability, economics, and ecosystem services research (Ewing et al., 2003; Vyas and Kumaranayake, 2006; Raudsepp-Hearne et al., 2010; Schwarz, 2010). This method reduces re-dundancy by selecting relatively uncorrelated measures that can char-acterize the different dimensions of the vegetation pattern that characterize the 100 studied cities. Two additional principal component analyses were used to select reduced sets of relatively uncorrelated de-mographic and socio-economic variables, and climatic variables respec-tively (Table A.3 and A.4 in Supplementary information). All components with eigenvalues N1 were included (Vyas and Kumaranayake, 2006).
A Bayesian regression analysis was used to determine the influence climate-socio-economic parameters on the landscape metrics. Because no previous information was available on relationships at the global scale, uninformative and normally distributed Jeffrey priors were used for the model parameterization (Proc Genmod, version 9.3, SAS Institute Inc., Cary, NC). Jeffrey priors are recommended as they are uniform for normally distributed data. For data covering a large butfinite range
this means that the priors influence will fall below the measurement error of the data and thus provide a robust posterior distribution to the prior chosen (O'Hagan and Forster, 2004; Killen, 2005). Posterior probabilities were obtained using a Monte Carlo Markov chain, simulat-ing 90,000 iterations with a burn-in of 2000 iterations. Burn-in refers to the number of initial iterations that are discarded and not sampled when determining posterior probabilities which minimises the effect of initial values on the posterior inference (Gamerman and Lopes, 2006). Thinning, by a factor of 1, was used to reduce sample autocorre-lations as high sample autocorrelation can result in biased Monte Carlo standard errors (Proc Genmod, Proc Princomp, version 9.3, SAS Institute Inc., Cary NC). Convergence of the model was tested by the Geweke and Heidelberger-Welch diagnostics (Littell et al., 2006). For each parame-ter, we estimated the 2.5% and 97.5% credible intervals of simulated pos-terior values. All statistical analyses were done in SAS (Proc Genmod, Proc Princomp, version 9.3, SAS Institute Inc., Cary NC).
3. Results
[image:3.595.46.561.77.423.2]The 100 cities showed a great deal of variation in landscape structure (Table 3). Green cover varied from 10% to 50% and average patch size varied fromb0.3 ha toN2 ha. There were significant differences be-tween cities in the degree of fragmentation as measured by nearest neighbour distance, the number of isolated patches, and porosity (Table 3). There was also a great deal of variation in climate, with cities ranging from continental to tropical climes and in socio-economic char-acteristics with cities classified as being extremely disadvantaged to some of the most advantaged cities in the world (Table A.2 Supplemen-tary material).
Table 1
Set of landscape metrics to analyse urban vegetation patterns.
Indicators Measure Description Importance
Green cover
(%) GCð%Þ ¼
Vegetation Area
Area City Proportion of the urban area occupied by vegetation The amount of vegetation available, potentially linked to the
amount of ecosystem services it can provide Mean size of
vegetation patch
MeanðhaÞ ¼∑n i¼1Xi
N Sum of all patches area (Xi) divided by the number of
patches (N)
A large mean indicates the presence of large vegetated areas that can potentially provide habitat and a variety of ecosystem services
Variance size of vegetation patch
CV¼ Std Dev Mean patch size
100 Informs on the variation of the patch size in relation to
the mean
An indicator of the level of inequality in the availability of vegetated patches for the provision of habitat and ecosystem services
Total number vegetation patches
– Number of patches identified as vegetation An indicator of the degree of fragmentation of vegetation. A
large number of patches implies many small patches throughout the city
Density of vegetation patches
#/ha Number of vegetation patches divided by the total area
of the city
Indicates the level of aggregation of the vegetated patches. A high density indicates that vegetated patches are close together
Porosity Por¼Vegetationþwater area
Impermeable area Relation vegetation and water vs. impermeable area A high level of porosity indicates areas in which natural
covers dominate over impermeable surfaces Nearest
neighbour
Meter Is the shortest straight line distance from the patch i to
the nearest neighbour patch, based on patch edge to edge distance computed from the centre of the patches
Indicates the level of connectivity between patches of vegetation. An indicator of the movement of animals and people between green spaces
Compactness Index
CI¼∑2πpffiffiffiffiffiffiffiffiffiffiffiffiffiffiffisi=π=Pi=N2
siis the area of patchiandPiis the perimeter of a circle with the areasi
andNis the total number of patches
The Compactness Index is higher for landscapes with few larger patches
It indicates whether the vegetation is dispersed throughout the city or concentrated in a certain area. This can provide insight on equality in the distribution of urban green cover and therefore the ecosystem services that it provides Mean patch
fractal dimension
Frac¼2 lnð0:25pijÞ lnaij
Values close to 1 simple shapes, close to 2 convoluted shapes
More complex shapes have more edge effects, which can affect sensitive species
Core patches as defined in GUIDOS*
% The area of vegetated pixels that are further from
non-vegetated areas are greater than a given distance
Core patches are large enough to provide habitat for species that are vulnerable to edge effects. A large core patch percentage indicates a large proportion of habitat is away from patch edges
Isolated patches as defined in GUIDOS*
% Patches that are too small to be contain core pixels Refers to patches that are not connected to other patches of
vegetation, therefore have less potential to provide habitat
Centrality % Number of patches within 2.5 km of the city centre Measured the proportion of vegetation patches near the city
A PCA of the landscape metrics determined that four landscape structure components characterised the data. The four components were related to the fragmentation, amount, and configuration of vegeta-tion. The four landscape structure components explained 78% of the total variability (Table 4). Thefirst component described a compact landscape structure and included the Compactness Index (0.55) and patch density (−0.53). The second component described a high-cover landscape structure characterised by a positive relationship to green cover (0.76) and a negative relationship with core patch area (−0.50). The third component described a fragmented landscape structure with a positive relation to number of isolated patches (0.6). Finally,
the fourth component described a landscape structure with high patch density located in the centre of the city (0.57;Table 4).
[image:4.595.38.557.75.421.2]Principal component analysis identified that three demographic and socio-economic variables explained most of the variation in urban veg-etation structure: (1) Gini Index, (2) variance in GDP; and, (3) popula-tion (Table A.1). These three variables loaded separately on thefirst three principal components, all with loadings over 0.9, and explained 78% of the total variation. Four climate metrics, mean annual
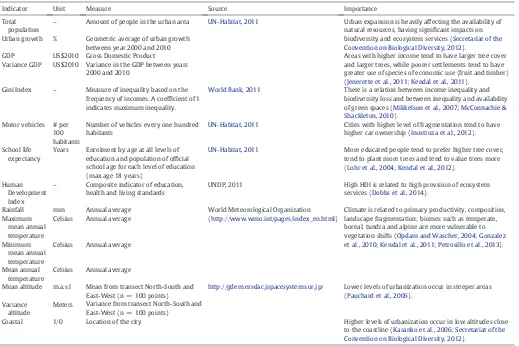
Table 2
Socioeconomic, demographic and climatic variables for exploring the drivers of urban vegetation patterns.
Indicator Unit Measure Source Importance
Total population
– Amount of people in the urban area UN‐Habitat, 2011 Urban expansion is heavily affecting the availability of
natural resources, having significant impacts on biodiversity and ecosystem services (Secretariat of the Convention on Biological Diversity, 2012).
Urban growth % Geometric average of urban growth
between year 2000 and 2010
GDP US$2010 Gross Domestic Product Areas with higher income tend to have larger tree cover
and larger trees, while poorer settlements tend to have greater use of species of economic use (fruit and timber) (Jenerette et al., 2011; Kendal et al., 2011).
Variance GDP US$2010 Variance in the GDP between years 2000 and 2010
Gini Index – Measure of inequality based on the
frequency of incomes. A coefficient of 1 indicates maximum inequality.
World Bank, 2011 There is a relation between income inequality and biodiversity loss and between inequality and availability of green spaces (Mikkelson et al., 2007; McConnachie & Shackleton, 2010).
Motor vehicles # per 100 habitants
Number of vehicles every one hundred habitants
UN‐Habitat, 2011 Cities with higher level of fragmentation tend to have higher car ownership (Inostroza et al., 2012).
School life expectancy
Years Enrolment by age at all levels of education and population of official school age for each level of education (max age 18 years)
UN‐Habitat, 2011 More educated people tend to prefer higher tree cover, tend to plant more trees and tend to value trees more (Lohr et al., 2004; Kendal et al., 2012).
Human Development Index
– Composite indicator of education,
health and living standards
UNDP, 2011 High HDI is related to high provision of ecosystem
services (Dobbs et al., 2014).
Rainfall mm Annual average World Meteorological Organization
(http://www.wmo.int/pages/index_en.html)
Climate is related to primary productivity, composition, landscape fragmentation; biomes such as temperate, boreal, tundra and alpine are more vulnerable to vegetation shifts (Opdam and Wascher, 2004; Gonzalez et al., 2010; Kendal et al., 2011; Petrosillo et al., 2013). Maximum
mean annual temperature
Celsius Annual average
Minimum mean annual temperature
Celsius Annual average
Mean annual temperature
Celsius Annual average
Mean altitude m.a.s.l Mean from transect North-South and East-West (n = 100 points)
http://gdem.ersdac.jspacesystems.or.jp/ Lower levels of urbanization occur in steeper areas (Pauchard et al., 2006).
Variance altitude
Meters Variance from transect North-South and East-West (n = 100 points)
Coastal 1/0 Location of the city Higher levels of urbanization occur in low altitudes close
to the coastline (Kasanko et al., 2006; Secretariat of the Convention on Biological Diversity, 2012).
Table 3
Summary statistics of landscape metrics and bio-socio-economic variables for the hundred cities included in the study.
Indicators Mean Std.
dev.
CV 5th
percentile 95th percentile
Green cover (%) 32.6 12.1 37 15.2 53.4
Mean patch area (ha) 1.03 0.66 64.3 0.3 2
Variance patch area (m2
) 552.2 1104 200 5.95 2922
Total number patches 2334 2414 103.4 435.5 7293.5
Patch density (#/ha) 0.33 0.13 39.3 0.16 0.54
Porosity 34.5 12 34.8 16.4 53.7
Nearest neighbour (m) 253.5 61.9 24.4 195.6 323.4
Compactness Index 0.0002 0.0003 160 0.00001 0.0005
Mean patch fractal dimension 1.45 0.04 2.6 1.4 1.5
Core patches (%) 53 24.1 45.6 5.7 89.3
Isolated patches (%) 44 24 55.2 3.2 93.7
[image:4.595.304.553.587.726.2]Centrality (%) 6.2 7.11 114 0.7 18.5
Table 4
Principal component analysis of 13 landscape metrics from a hundred cities. Variables se-lected resulted from eigenvectors valuesN0.5 from principal component with eigenvalues
N1. Only principal components with eigenvalues over 1 are shown. All eigenvalues are sig-nificant atα= 0.05.
PC1 PC2 PC3 PC4
Eigenvalue 4.29 2.13 1.73 1.15
Variance explained 35.81 17.76 14.44 9.60
Green cover 0.02 0.76 0.13 0.10
Patch area 0.41 0.04 0.17 −0.29
Var. patch size 0.38 −0.04 0.03 −0.20
# Patches −0.53 0.16 −0.40 0.07
Density patches 0.42 0.03 0.00 0.09
Porosity 0.44 −0.05 0.08 0.14
Nearest neighbour 0.23 0.01 0.24 −0.43
Compactness Index 0.55 −0.14 0.37 0.19
Fractal dimension 0.30 −0.14 −0.08 0.29
Core patches −0.10 −0.50 0.49 0.03
Isolated patches 0.11 0.15 0.60 −0.05
Patches in the centre −0.01 0.41 0.10 0.57
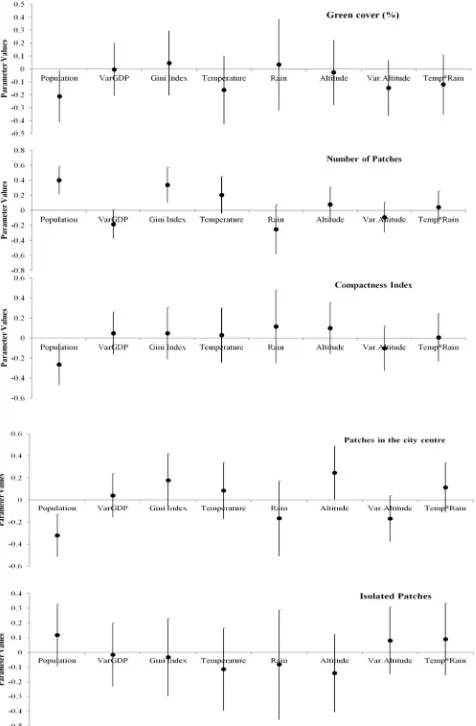
[image:4.595.34.284.613.745.2]temperature, rainfall, altitude and variance in altitude, were selected explaining 85% of the variability in the cities (Table A.2). These variables were used in the Bayesian regression as independent variables. Details of the Bayesian analysis are summarised in Table A.5 (Supplementary material).
The influence of the climate-socio-economic factors on landscape metrics, as estimated by the Bayesian analysis (Fig. 1), identified that more populated cities tend to have less green cover. A more fragmented landscape, as measured by the number of patches, is more likely to occur in more populated, warm and more unequal cities (higher Gini Index), while cities with less variance in GDP tend to be less fragmented (Fig. 1). Cities that are less populated tend to have a more compact land-scape structure and more vegetation in the city centre (Fig. 1). Cities lo-cated in higher altitudes tend to have more vegetation lolo-cated in the city centre. The proportion of isolated patches however did not appear to be affected by any of the analysed factors. These trends were
con-firmed by the Bayesian analysis (Fig. 1).
4. Discussion
We found that urban landscape structure at the global scale was
in-fluenced by multiple factors. The best descriptors of landscape structure included vegetation cover as well as its configuration and distribution. These metrics are known to influence biodiversity and the ecological
processes that support the provisioning of ecosystem services (Whitford et al., 2001; Grimm et al., 2008a; DeFries et al., 2010; Syrbe and Walz, 2012; Zipperer et al., 2012). The inclusion of configuration and distribution metrics revealed in greater detail how urbanization can affect landscape structure and, potentially, key ecological processes (Tratalos et al., 2007).
The influence of demographics, socioeconomics, and climate on landscape vegetation structure showed similarities between cities, in-dependent of their location. We found that population and Gini Index were the main variables shaping landscape structure of urban vegeta-tion. Green cover was negatively related to total population which is similar tofindings fromFaryadi and Taheri (2009). Fragmentation was positively related to population and economy. The quality of urban veg-etation decreased (e.g. lower green cover, smaller patches and more fragmentation) in more populated and socially unequal locations. More populated cities tended to have less green cover, with patches of vegetation that are likely to experience greater edge effects. An increase in population typically causes cities to either to sprawl or infill which af-fects the amount and distribution of vegetation within city boundaries and can lead to the fragmentation of peri-urban areas (Pauleit et al., 2005; DeFries et al., 2010). Less green space also reduces recreation po-tential, habitat provision forflora and fauna, carbon mitigation,flood regulation and reduces the capacity of the ecosystem to provide climate regulation, air pollution removal, runoff reduction and water quality amelioration (Tratalos et al., 2007; Zipperer et al., 2012). Vegetation cover in the centre of the city decreased with increasing population, es-pecially in urban areas located at higher altitudes. This could have con-sequences for ecosystem services; as a decrease in vegetation cover increases the urban heat island effect; particularly in city centres, mak-ing people more vulnerable to heat stress and leadmak-ing to increased ex-penditures in energy for cooling (Zhou et al., 2011).
The level of economic inequality of urban areas had a strong infl u-ence on landscape structure. Cities with economically unequal societies contained more fragmented landscapes. This is consistent with studies showing that biotic impoverishment is driven by lower socioeconomic status (Luck et al., 2009). This highlights that equitable societies typical-ly have increased access to environmental resources (Pedlowski et al., 2002; Kates and Parris, 2003; Perkins et al., 2004). The distribution of vegetation was also strongly influenced by total population and topog-raphy. Cities located in valleys (i.e. having high variation in altitude) tended to have less vegetation in the city centre, likely caused by valley bottoms being thefirst sections to be cleared for infrastructure ment, in turn leaving elevated areas under less pressure for develop-ment (Luck et al., 2009).
This study highlights that patterns previously found in local and re-gional studies scale up to the global level.Pauleit et al. (2005)and Whitford et al. (2001)reported a reduction in local and regional scale vegetation with densification in the UK. Ourfinding that fragmentation was influenced by high population levels and by large differences in wealth between city inhabitants is supported by thefindings ofLuck et al. (2009)who reported that wealth together with biophysical vari-ables were strong predictors of urban vegetation patterns at the region-al scregion-ale. At the locregion-al scregion-ale, population and weregion-alth have been found to influence canopy cover (Pedlowski et al., 2002; Grove et al., 2006; Landry and Chakraborty, 2009; Banzhaf et al., 2013), while education, reflected in the Gini Index, has been identified as influential for obtaining access to environmental resources (Pickett et al., 2010). The congruency in factors shaping urban vegetation across scales highlights the of the need to consider socio-demographic variables in conjunction with physical variables for understanding the processes that influence the structure and pattern of vegetation in the urban environment.
[image:5.595.50.288.318.681.2]Findings from this study can be used to inform planning by showing that more populated cities being developed without including vegeta-tion as part of the planning process can lead to adverse impacts on veg-etation structure and facilitate unsustainable city designs for providing ecosystem services. In more socioeconomically unequal countries,
Fig. 1.Coefficient estimates for Bayesian models offive landscape metrics. The lines
vegetation is typically not seen as a priority, creating further environ-mental inequity and facilitating a further reduction in the well-being of urban inhabitants. The sustainable management of urban vegetation is a realistic opportunity that provides a meaningful approach for achieving sustainable development goals (Haase et al., 2012; Griggs et al., 2013). The need for urban green space policy has been recognised at an international level in the recent Sustainable Development Goals including a universal target for accessible green space, and the New Urban Agenda (an outcome of the UN's Habitat III conference) identify-ing the creation, restoration and protection of urban greenspace and urban ecosystems as transformative commitments to sustainable urban development. Green infrastructure and nature-based solutions can be affordable and implemented in high-population cities with lim-ited ground space available (e.g.Tian et al., 2011). Urban green cover underpins ecologyincities (Jansson, 2013). Numerous studies show that increasing green cover can help redress inequities associated with socioeconomic disadvantage (e.g.Mitchell and Popham, 2008). Increas-ing green cover can also aid sustainability transformations through fa-cilitating public interaction (McCormick et al., 2013). This in turn is an important component of sustainability, that helps reconnect develop-ment to the capacity of biosphere (Folke et al., 2011), thereby providing many ecosystem services and health and wellbeing benefits (Haase et al., 2012).
5. Conclusion
The socio-ecological analysis presented in this study found that mul-tiple factors interact to influence the structure of urban vegetation. An-thropogenic variables (population and economy) are key factors influencing the degree of fragmentation and loss of vegetation cover. Geographical context was also found to play a significant role with cities in valleys and in warmer areas tending to be more fragmented, which suggests that vegetation patterns in these cities are still influenced by the legacies of historical development. The insights from this study should enable decision makers and managers to develop and imple-ment policies that can aid in the achieveimple-ment of sustainable urban de-velopment (Andersson, 2006). Urban vegetation is a natural resource that can be affordable, does not require technological advancements or strong policy changes to conserve and manage. Managing urban veg-etation sustainably will improve the provision of ecosystem services and improve human wellbeing; particularly in urban areas with limited resources, poverty issues or political constraints.
Acknowledgements
CD is supported by Fondecyt 3150351“Urban ecosystem service provision, exploring the effects of urban planning, urbanization, climate and environmental conditions of the urban forest of Santiago and La Serena”. We would like to thank two anonymous reviewers for their in-sightful comments.
Appendix A. Supplementary data
Supplementary data to this article can be found online athttp://dx. doi.org/10.1016/j.scitotenv.2017.03.058.
References
Alberti, M., Marzluff, J.M., 2004.Ecological resilience in urban ecosystems: linking urban pat-terns to human and ecological functions. Urban Ecosyst 7, 241–256.
Andersson, E., 2006. Urban landscapes and sustainable cities. Ecol. Soc. 11.http://www. ecologyandsociety.org/vol11/iss1/art34/.
Angel, S., Sheppard, S.C., Civco, D.L., Buckley, R., Chabaeva, A., Gitlin, L., Kraley, A., Parent, J., Perlin, M., 2005.The Dynamics of Global Urban Expansion. Transport and Urban Develop-ment DepartDevelop-ment, The World Bank, Washington D.C.
Angelstam, P., Grodzynskyi, M., Andersson, K., Axelsson, R., Elbakidze, M., Khoroshev, A., Kruhlov, I., Naumov, V., 2013.Measurement, collaborative learning and research for sus-tainable use of ecosystem services: landscape concepts and europe as laboratory. Ambio 42, 129–145.
Axelsson, R., Angelstam, P., Elbakidze, M., Stryamets, N., Johansson, K., 2011.Sustainable devel-opment and sustainability: landscape approach as a practical interpretation of principles and implementation concepts. J. Landsc. Ecol. 4, 5–30.
Banzhaf, E., Reyes-Paecke, S., Müller, A., Kindler, A., 2013.Do demographic and land-use changes contrast urban and suburban dynamics? A sophisticated reflection on Santiago de Chile. Habitat Int. 39, 179–191.
Bierwagen, B.G., 2007.Connectivity in urbanizing landscapes: the importance of habitat confi g-uration, urban area size, and dispersal. Urban Ecosyst. 10, 29–42.
Bigsby, K.M., McHale, M.R., Hess, G.R., 2014.Urban morphology drives the homogenization of tree cover in Baltimore, MD, and Raleigh, NC. Ecosystems 17 (2), 212–227.
Boone, C.G., Cadenasso, M.L., Grove, J.M., Schwarz, K., Buckley, G.L., 2009.Landscape, vegetation characteristics, and group identity in an urban and suburban watershed: why the 60s mat-ter. Urban Ecosyst 13, 255–271.
Buyantuyev, A., Wu, J., 2007.Effects of thematic resolution on landscape pattern analysis. Landsc. Ecol. 22, 7–13.
Cook, E.M., Hall, S.J., Larson, K.L., 2011.Residential landscapes as social-ecological systems: a synthesis of multi-scalar interactions between people and their home environment. Urban Ecosyst 15, 19–52.
Coops, N.C., Waring, R.H., Beier, C., Roy-jauvin, R., Wang, T., 2011.Modeling the occurrence of 15 coniferous tree species throughout the Pacific Northwest of North America using a hybrid approach of a generic process-based growth model and decision tree analysis. Appl. Veg. Sci. 14, 402–414.
DeFries, R.S., Rudel, T., Uriarte, M., Hansen, M., 2010.Deforestation driven by urban population growth and agricultural trade in the twenty-first century. Nat. Geosci. 3, 178–181.
Dobbs, C., Escobedo, F.J., Zipperer, W.C., 2011.A framework for developing urban forest ecosys-tem services and goods indicators. Landsc. Urban Plan. 99, 196–206.
Dobbs, C., Nitschke, C.R., Kendal, D., 2014.Global drivers and tradeoffs of three urban vegetation ecosystem services. PLoS ONE 9 (11), e113000.
Escobedo, F.J., Nowak, D.J., 2009.Spatial heterogeneity and air pollution removal by an urban forest. Landsc. Urban Plan. 90, 102–110.
Escobedo, F.J., Nowak, D.J., Wagner, J., De la Maza, C.L., Rodríguez, M., Crane, D.E., Hernández, J., 2006.The socioeconomics and management of Santiago de Chile's public urban forests. Urban For. Urban Green. 4, 105–114.
Ewing, R., Schmid, T., Killingsworth, R., Zlot, A., Raudenbush, S., 2003.Relationship between urban sprawl and physical activity, obesity, and morbidity. J Health Promot]–>Am. J. Health Promot. 18, 47–57.
Fahrig, L., 2003.Effects of habitat fragmentation on biodiversity. Annu. Rev. Ecol. Evol. Syst. 34, 487–515.
Faryadi, S., Taheri, S., 2009.Interconnections of urban green spaces and environmental quality of Tehran. Int. J. Environ. Res. 3, 199–208.
Folke, C., Hahn, T., Olsson, P., Norberg, J., 2005.Adaptive governance of social-ecological systems. Annu. Rev. Environ. Resour. 30, 441–473.
Folke, C., Jansson, Å., Rockström, J., Olsson, P., Carpenter, S.R., Chapin III, F.S., et al., 2011.
Reconnecting to the biosphere. Ambio 40, 719–738.
Forman, R.T.T., 1995.Some general principles of landscape and regional ecology. Landsc. Ecol. 10, 3.
Fuller, R.A., Gaston, K.J., 2009.The scaling of green space coverage in European cities. Biol. Lett. 5, 352–355.
Gamerman, D., Lopes, H.F., 2006.Markov Chain Monte Carlo: Stochastic Simulation for Bayesian Inference. second ed. Chapman & Hall/CRC, Boca Raton, FL.
Gonzalez, P., Neilson, R.P., Lenihan, J.M., Drapek, R.J., 2010.Global patterns in the vulnerability of ecosystems to vegetation shifts due to climate change. Glob. Ecol. Biogeogr. 19, 755–768.
Griggs, D., Stafford-Smith, M., Gaffney, O., Rockström, J., Ohman, M.C., Shyamsundar, P., Steffen, W., Glaser, G., Kanie, N., Noble, I., 2013.Policy: sustainable development goals for people and planet. Nature 495, 305–307.
Grimm, N.B., Faeth, S.H., Golubiewski, N.E., Redman, C.L., Wu, J., Bai, X., Briggs, J.M., 2008a.Global change and the ecology of cities. Science 319, 756–760.
Grimm, N.B., Foster, D., Groffman, P., Grove, J.M., Hopkinson, C.S., Nadelhoffer, K.J., Pataki, D.E., Peters, D.P., 2008b.The changing landscape: ecosystem responses to urbanization and pol-lution across climatic and societal gradients. Front. Ecol. Environ. 6, 264–272.
Grove, J.M., Troy, A.R., O'Neil-Dunne, J.P.M., Burch, W.R., Cadenasso, M.L., Pickett, S.T.A., 2006.
Characterization of households and its implications for the vegetation of urban ecosystems. Ecosystems 9, 578–597.
Haase, D., Schwarz, N., Strohbach, M.W., Kroll, F., Seppelt, R., 2012. Synergies, trade-offs, and losses of ecosystem services in urban regions: an integrated multiscale framework applied to the Leipzig-Halle region, Germany. Ecol. Soc. 17.http://www.ecologyandsociety.org/ vol17/iss3/art22/.
He, C., Shi, P., Xie, D., Zhao, Y., 2010.Improving the normalized difference built up index to map urban built-up areas using semiautomatic segmentation approach. Remote Sens. Lett. 1, 213–221.
Heynen, N.C., Perkins, H.A., Roy, P., 2006.The political ecology of uneven urban green space: the impact of political economy on race and ethnicity in producing environmental inequality in Milwaukee. Urban Aff. Rev. 42, 3–25.
Huang, J., Lu, X.X., Sellers, J.M., 2007.A global comparative analysis of urban form: applying spa-tial metrics and remote sensing. Landsc. Urban Plan. 82, 184–197.
Inostroza, L., Baur, R., Csaplovics, E., 2012.Urban sprawl and fragmentation in Latin America: a dynamic quantification and characterization of spatial patterns. J. Environ. Manag. 115C, 87–97.
Irwin, E.G., Jayaprakash, C., Munroe, D.K., 2009.Towards a comprehensive framework for modeling urban spatial dynamics. Landsc. Ecol. 24, 1223–1236.
Jansson, Å., 2013.Reaching for a sustainable, resilient urban future using the lens of ecosystem services. Ecol. Econ. 86, 285–291.
Jenerette, G.D., Harlan, S.L., Stefanov, W.L., Martin, C.A., 2011.Ecosystem services and urban heat riskscape moderation: water, green spaces and social inequality in Phoenix, USA. Ecol. Appl. 21 (7), 2637–2651.
Jenerette, G.D., Harlan, S.L., Buyantuev, A., Stefanoc, W.L., Declet-Barreto, J., Ruddell, B.L., Myint, S.W., Kaplan, S., Li, X., 2016.Micro-scale urban surface temperatures are related to land-cover features and residential heat related health impacts in Phoenix, AZ USA. Landsc. Ecol. 31, 745–760.
Kasanko, M., Barredo, J.I., Lavalle, C., McCormick, N., Demicheli, L., Sagris, V., Brezger, A., 2006.
Are European cities becoming dispersed? A comparative analysis of 15 European urban areas. Landsc. Urban Plan. 77, 111–130.
Kates, R.W., Parris, T.M., 2003.Long-term trends and a sustainability transition. Proc. Natl. Acad. Sci. U. S. A. 100, 8062–8067.
Kendal, D., Williams, N.S.G., Williams, K.J.H., 2011.A cultivated environment: exploring the glob-al distribution of plants in gardens, parks and streetscapes. Urban Ecosyst 15, 637–652.
Kendal, D., Williams, N.S.G., Williams, K.J.H., 2012.Drivers of diversity and tree cover in gardens, parks and streetscapes in an Australian city. Urban For. Urban Green. 11, 257–265.
Killen, P.R., 2005.Replicability, confidence, and priors. Psychol. Sci. 16, 1009–1012.
Kinzig, A.P., Warren, P.S., Martin, C.A., Hope, D., Katti, M., 2005.The effects of human socioeco-nomic status and cultural characteristics on urban patterns of biodiversity. Ecol. Soc. 10.
Landry, S.M., Chakraborty, J., 2009.Street trees and equity: evaluating the spatial distribution of an urban amenity. Environ. Plan. A 41, 2651–2670.
Lin, B.B., Gaston, K.J., Fuller, R.A., Wu, D., Bush, R., Shanahan, D.F., 2017.How green is your gar-den?: urban form and sociodemographic factors influence yard vegetation, visitation and ecosystem service benefits. Landsc. Urban Plan. 157, 239–246.
Littell, R., Milliken, G.A., Stroup, W.W., Wolfinger, R.D., Schabenberger, O., 2006.SAS for Mixed Models. second ed. SAS Institute Inc., Cary, NC.
Lohr, V., Pearsen-Mims, C.H., Tarnai, J., 2004.How urban residents rate and rank the benefits and problems associated with trees in cities. J. Arboric. 30, 28–35.
Luck, G.W., Smallbone, L.T., Brien, R.O., 2009.Socio-economics and vegetation change in urban ecosystems: patterns in space and time. Ecosystems 12, 604–620.
McConnachie, M.M., Shackleton, C.M., 2010.Public green space inequality in small towns in South Africa. Habitat Int. 34, 224–248.
McCormick, K., Anderberg, S., Coenen, L., Neij, L., 2013.Advancing sustainable urban transforma-tion. J. Clean. Prod. 50, 1–11.
McDonald, R.I., 2008.Global urbanization: can ecologists identify a sustainable way forward? Front. Ecol. Environ. 6, 99–104.
Mikkelson, G.M., Gonzalez, A., Peterson, G.D., 2007.Economic inequality predicts biodiversity loss. Plos One 2 (5), e444.
Mitchell, R., Popham, F., 2008.Effect of exposure to natural environment on health inequalities: an observational population study. Lancet 372, 1655–1660.
Mitchell, M.G.E., Bennett, E.M., Gonzalez, A., 2013.Linking landscape connectivity and ecosys-tem service provision: current knowledge and research gaps. Ecosysecosys-tems 16, 894–908.
Musacchio, L.R., 2011.The world's matrix of vegetation: hunting the hidden dimension of land-scape sustainability. Landsc. Urban Plan. 100, 356–360.
Nowak, D.J., Rowntree, R.A., McPherson, E.G., Sisinni, S.M., Kerkmann, E.R., Stevens, J.C., 1996.
Measuring and analyzing urban tree cover. Landsc. Urban Plan. 36, 49–57.
Opdam, P., Wascher, D., 2004.Climate change meets habitat fragmentation: linking landscape and biogeographical scale levels in research and conservation. Biol. Conserv. 117, 285–297.
O'Hagan, A., Forster, J., 2004.Kendall's Advanced Theory of Statistics: Vol. 2B: Bayesian Infer-ence. second ed. Oxford University Press, New York.
Pataki, D.E., Carreiro, M.M., Cherrier, J., Grulke, N.E., Jennings, V., Pincetl, S., Pouyat, R.V., Whitlow, T.H., Zipperer, W.C., 2011.Coupling biogeochemical cycles in urban environ-ments: ecosystem services, green solutions, and misconceptions. Front. Ecol. Environ. 9, 27–36.
Pauchard, A., Aguayo, A., Pena, E., Urrutia, R., 2006.Multiple effects of urbanization on the bio-diversity of developing contries: the case of fast growing metropolitan areas (Concepcion, Chile). Biol. Conserv. 127, 272–281.
Pauleit, S., Ennos, R., Golding, Y., 2005.Modeling the environmental impacts of urban land use and land cover change—a study in Merseyside, UK. Landsc. Urban Plan. 71, 295–310.
Pedlowski, M.A., Da Silva, V.A.C., Adell, J.J.C., Heynen, N.C., 2002.Urban forest and environmental inequality in Campos dos Goytacazes, Rio de Janeiro, Brazil. Urban Ecosyst 6, 9–20.
Perkins, H., Heynen, N.C., Wilson, J., 2004.Inequitable access to urban reforestation: the impact of urban political economy on housing tenure and urban forests. Cities 21, 291–299.
Pickett, S.T.A., Cadenasso, M.L., Grove, J.M., Boone, C.G., Groffman, P.M., Irwin, E., Kaushal, S.S., Marshall, V., McGrath, B.P., Nilon, C.H., Pouyat, R.V., Szlavecz, K., Troy, A.R., Warren, P., 2010.Urban ecological systems: scientific foundations and a decade of progress. J. Environ. Manag. 92, 331–362.
Pretosillo, I., Semeraro, T., Zaccarelli, N., Aretano, R., Zurlini, G., 2013.The possible combined ef-fects of land-use changes and climate conditions on the spatio-temporal patterns of prima-ry production in a natural protected area. Ecol. Indic. 29, 367–375.
Ramage, B.S., Roman, L.A., Dukes, J.S., 2013.Relationships between urban tree communities and the biomes in which they reside. Moody A., editor. Appl. Veg. Sci. 16, 8–20.
Raudsepp-Hearne, C., Peterson, G.D., Bennett, E.M., 2010.Ecosystem service bundles for analyz-ing tradeoffs in diverse landscapes. Proc. Natl. Acad. Sci. U. S. A. 107, 5242–5247.
Riitters, K.H., O'neill, R.V., Hunsaker, C., Wickham, J.D., Yankee, D.H., Timmins, S.P., Jones, K.B., Jackson, B.L., 1995.A factor analysis of landscape pattern and structure metrics. Landsc. Ecol. 10, 23–39.
Romero, H., Vasquez, A., Fuentes, C., Salgado, M., Schmidt, A., Banzhaf, E., 2012.Assessing urban environmental segregation (UES). The case of Santiago de Chile. Ecol. Indic. 23, 76–87.
Schneider, A., Woodcock, C.E., 2008.Compact, dispersed, fragmented, extensive? A comparison of urban growth in twenty-five global cities using remotely sensed data, pattern metrics and census information. Urban Stud. 45, 659–692.
Schwarz, N., 2010.Urban form revisited—selecting indicators for characterising European cities. Landsc. Urban Plan. 96, 29–47.
Secretariat of the Convention on Biological Diversity, 2012.Cities and Biodiversity Outlook (Montreal, Quebec, Canada H2Y 1N9).
Seto, K.C., Shepherd, J.M., 2009.Global urban land-use trends and climate impacts. Curr. Opin. Environ. Sustain. 1, 89–95.
Seto, K.C., Güneralp, B., Hutyra, L.R., 2012.Global forecasts of urban expansion to 2030 and direct impacts on biodiversity and carbon pools. Proc. Natl. Acad. Sci. U. S. A. 109, 16083–16088.
Syrbe, R.U., Walz, U., 2012.Spatial indicators for the assessment of ecosystem services: provid-ing, benefiting and connecting areas and landscape metrics. Ecol. Indic. 21, 80–88.
Tian, Y., Jim, C.Y., Tao, Y., Shi, T., 2011.Landscape ecological assessment of green space fragmen-tation in Hong Kong. Urban For. Urban Green. 10 (2), 79–86.
Tratalos, J., Fuller, R.A., Warren, P.H., Davies, R.G., Gaston, K.J., 2007.Urban form, biodiversity po-tential and ecosystem services. Landsc. Urban Plan. 83, 308–317.
UN-Habitat, 2011.Cities and Climate Change: Global Report on Human Settlements. EarthScan, London, Washington D.C.
Vogt, P., Riitters, K.H., Estreguil, C., Kozak, J., Wade, T.G., Wickham, J.D., 2006.Mapping spatial patterns with morphological image processing. Landsc. Ecol. 22, 171–177.
Vyas, S., Kumaranayake, L., 2006.Constructing socio-economic status indices: how to use prin-cipal components analysis. Health Policy Plan. 21, 459–468.
Whitford, V., Ennos, A.R., Handley, J.F., 2001.“City form and natural process” —indicators for the ecological performance of urban areas and their application to Merseyside, UK. Landsc. Urban Plan. 57, 91–103.
World Bank, 2011.World Development Indicators 2011. Washington D.C. World Bank http:// data.worldbank.org.
Zha, Y., Gao, J., Ni, S., 2003.Use of normalized difference built-up index in automatically map-ping urban areas from TM imagery. J Remote Sens]–>Int. J. Remote Sens. 24, 583–594.
Zhou, W., Huang, G., Cadenasso, M.L., 2011.Does spatial configuration matter? Understanding the effects of land cover pattern on land surface temperature in urban landscapes. Landsc. Urban Plan. 102, 54–63.
Zipperer, W.C., Wu, J., Pouyat, R.V., Pickett, S.T.A., 2000.The application of ecological principles to urban and urbanizing landscapes. Ecol. Appl. 10, 685–688.