White Rose Research Online URL for this paper:
http://eprints.whiterose.ac.uk/82686/
Article:
Pogge Von Strandmann, PAE, Coath, CD, Catling, DC et al. (2 more authors) (2014)
Analysis of mass dependent and mass independent selenium isotope variability in black
shales. Journal of Analytical Atomic Spectrometry, 29 (9). 1648 - 1659. ISSN 0267-9477
https://doi.org/10.1039/c4ja00124a
eprints@whiterose.ac.uk
https://eprints.whiterose.ac.uk/
Reuse
Unless indicated otherwise, fulltext items are protected by copyright with all rights reserved. The copyright
exception in section 29 of the Copyright, Designs and Patents Act 1988 allows the making of a single copy
solely for the purpose of non-commercial research or private study within the limits of fair dealing. The
publisher or other rights-holder may allow further reproduction and re-use of this version - refer to the White
Rose Research Online record for this item. Where records identify the publisher as the copyright holder,
users can verify any specific terms of use on the publisher’s website.
Takedown
If you consider content in White Rose Research Online to be in breach of UK law, please notify us by
Analysis of mass dependent and mass independent
selenium isotope variability in black shales
Philip A. E. Pogge von Strandmann,*abChristopher D. Coath,aDavid C. Catling,ac Simon W. Poultondand Tim Elliotta
The measurement of selenium isotope ratios is of increasing interest for understanding redox conditions in present and past surface environments. Se has six stable isotopes, and is therefore well suited for isotope analysis by double spiking. However due to relatively large interferences on every isotope, and complex chemical purification methods that frequently do not generate 100% yields, rigorously determining the accuracy of measurements is critical. Here we present analyses of USGS shale standards (SCo-1 and SGR-1b), as representatives of material which might be of interest to Se isotope studies. We have made analyses using two separate double spikes (74Se
–78Se and78Se
–82Se), and compare them to previously published results. In addition, we present models of the effects of uncorrected interferences on double spike inversions. This leads us to proposed82/76Se (parts per thousand deviation of82Se/76Se from NIST SRM-3149) values of 0.220.15 for SCo-1, and +0.250.17 for SGR-1b. Further, we present a new method of measuring Se isotopes by desolvation nebulisation. Se sensitivity is enhanced by a factor of 100–200 times by doping solutions with pure Mg, leading to almost a factor of two less material required compared to the more standard hydride generation. Interferences are different compared to our standard hydride generation protocol, but analyses of double spiked NIST-3149 shows that this method can generate accurate isotope ratios. Finally, mass independent fractionation (MIF) of sulphur isotopes has generated considerable interest for constraining the early oxygenation of the atmosphere. Given the chemical similarities between S and Se, Archean shales with S MIF might be expected to exhibit Se MIF. However, within our analytical uncertainty of0.4–0.5‱(parts per 10 000), there is no resolvable Se MIF in these samples, indicating different atmospheric cycling of Se and S.
1.
Introduction
Selenium and its stable isotopes are increasingly generating interest in the geochemical community for their potential to trace present and past surface water redox processes.1–7As for S,
microbial reduction of Se is thought to be the dominant cause of natural Se isotope fractionation.3,8The chemistries of S and
Se have notable similarities but, signicantly, the redox tran-sitions between the highest naturally occurring oxidation state of selenium, Se(VI), and its common reduced forms, Se(IV), Se(0) and Se(-II), occur at higher pE than for the dominant sulphur redox states, S(VI) and S(-II).3,6,9–12 Selenium isotope
measure-ments may therefore be suited to trace changes in ocean redox at relatively oxidised conditions, aer the great oxidation event.
Of the existing means of analysis, gas-source spectrometry requires prohibitively large quantities of Se.6Negative thermal
ionisation mass spectrometry has proven to be useful,2
but it has only been since the development of multi-collector plasma ionisation mass spectrometers that interest in Se isotope measurements for geochemical purposes has begun to grow.13
Even so, Se ionises poorly in a plasma and Se is generally introduced as a Se-hydride gas, thereby avoiding the sensitivity loss due to a hydrous carrier matrix.13,14 However, hydride
generation has its own inherent problems, as elements that directly interfere with Se isotopes (e.g.Ge and As), as well as those that may cause matrix effects (e.g.Sb), also readily form hydrides, and therefore pre-analysis chemical purication must take place, as well as interference corrections. Coupled with interferences stemming from the plasma carrier gas (ArAr and Kr), these factors make Se isotope measurements challenging.
Purication chemistry for Se from common geological matrices has been described by a number of authors, using the now fairly well established thiol cottonbre method.7,9,13,15–17
However, given the difficulty in obtaining 100% yields from this chemistry, the potential exists for isotopic fractionation of the sample to occur during sample preparation. This concern can
aBristol Isotope Group, School of Earth Sciences, Bristol University, Wills Memorial
Building, Queen's Road, BS8 1RJ, Bristol, UK
bInstitute of Earth and Planetary Sciences, University College London and Birkbeck,
University of London, Gower Street, WC1E 6BT, London, UK. E-mail: p.strandmann@ucl.ac.uk
cDepartment of Earth and Space Sciences, University of Washington, Seattle, WA
98195, USA
dSchool of Earth and Environment, University of Leeds, LS2 9JT, Leeds, UK
Cite this:J. Anal. At. Spectrom., 2014,
29, 1648
Received 16th April 2014 Accepted 6th June 2014
DOI: 10.1039/c4ja00124a
www.rsc.org/jaas
PAPER
Published on 06 June 2014. Downloaded by University of Leeds on 23/12/2014 10:01:15.
View Article Online
be circumvented by using a double-spiked approach, which corrects for any mass-dependent fractionation during sample processing if the samples and spike are equilibrated prior to chemical purication.1,3,7,14,16,18–21 Double spiked analyses are
also robust against possible differential instrumental fraction-ation of samples with residual matrix compared to clean solu-tion standards, which is a major considerasolu-tion in sample-standard bracketing methods. Selenium has six stable isotopes, apparently providing ample choice for selecting the four isotopes required for double spiked analysis. The potential drawback of this method, however, is that these four isotopes must be fully corrected for any interferences, compared to only two required in sample-standard bracketing. The benets of double spiking outlined above should outweigh those of sample-standard bracketing in measuring mass dependent isotope variability, but interferences must be resolved or accu-rately corrected. Here we examine a number of these issues, with reference to our own work and to also to different studies in the literature.
Since Se is strongly associated with organic matter,8,22,23
shale is the most commonly used rock type for Se isotope analyses of ancient past environments. Therefore well-charac-terised shale standards are required in order for Se isotope studies to be cross-calibrated. However, published values for the common USGS shale standard SGR-1 differ by up to 0.74& on the82Se/76Se ratio.7,13,17,19,24,25Here we examine the Se isotope
composition of two USGS shales (SGR-1 and SCo-1) with multiple, independently constrained, double spike inversions, with the aim of providing useful isotopic reference composi-tions. We also examine some Archean rocks for the potential of Se mass independent fractionation (MIF), given the presence of sulphur MIF in these rocks.
2.
Double spike
Selenium has six stable isotopes (given that82Se has a half life of 1020years and can be considered stable):74Se,76Se,77Se,78Se, 80
Se and82Se. Their natural abundances are detailed in Table 1. Two separate double spikes were trialled in this study. Both were made up from enriched single isotope standards from
Cambridge Isotope Laboratories, Inc., with certied enrichment factors between 92% for82Se, 97% for78Se and >99% for74Se. The enriched material was dissolved individually in concen-trated HNO3to ensure no reductive loss of Se, diluted, and then mixed gravimetrically, according to the compositions suggested by the double spike toolbox.26
The double spikes were calibrated by standard addition, by mixing NIST-3149 and the double spike in various proportions, which were then used to constrain the pure spike composition. This composition was also veried by measuring a pure double spike by sample-standard brack-eting with NIST-3149.
Initially we used a74Se
–78Se spike (calibrated ratios:74Se/78Se ¼0.856,74Se/77Se¼90.445,78Se/77Se¼105.645), with77Se and 82Se as the other isotopes for the inversion. This approach has
the disadvantage that it has a signicant Ge interference on 74
Se, which can be up to 70% of the signal. We also used a 78
Se–82Se spike (calibrated ratios:78Se/82Se¼0.185,78Se/76Se¼ 110.847, 82Se/76Se ¼ 598.23), with an inversion scheme that additionally uses 76Se and 77Se measurements. The latter procedure allows analyses at lower Se intensities, because the interfered74Se is not required. However, it does use76Se, which has three signicant interferences: 40Ar36Ar, 76Ge and 75AsH, albeit the sum of these contributions is typically smaller (3–
10%) relative to the mass 76 intensity than74Ge to mass 74. The 78Se
–82Se spike was used most extensively, although results from both spikes are presented below to provide multiple constraints on the compositions of the shale standards.
All isotope ratios are presented asd82/76Se, which is the& deviation of the82Se/76Se ratio of the sample from that of NIST SRM-3149 (Lot no. 992106). This reference material is a NIST 10.0420.051 mg g 1single element standard solution, which is not isotopically certied, although its absolute composition has been reported,27 and has become the isotopic reference
standard of choice for Se.1,5,7,17,19,28
Our standard is from the same lot as for some other studies.5,17,28
The74Se–78Se double spike inversion does not use76Se, so these ratios are converted tod82/76Se notation fromd82/77Se using the exponential mass fractionation law.
[image:3.595.46.553.571.730.2]Concentrations of samples were determined by isotope dilution as part of the double spike inversion, with an
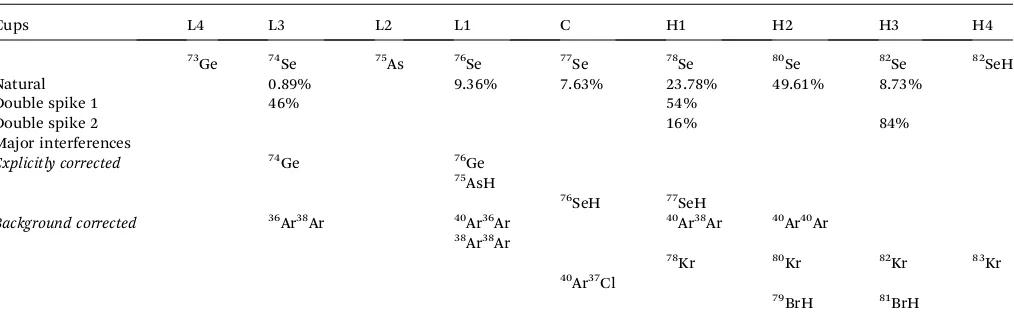
Table 1 Details of the cup configuration and double spikes used, as well as the main interferences on each mass
Cups L4 L3 L2 L1 C H1 H2 H3 H4
73Ge 74Se 75As 76Se 77Se 78Se 80Se 82Se 82SeH
Natural 0.89% 9.36% 7.63% 23.78% 49.61% 8.73%
Double spike 1 46% 54%
Double spike 2 16% 84%
Major interferences
Explicitly corrected 74Ge 76Ge
75AsH
76SeH 77SeH
Background corrected 36Ar38Ar 40Ar36Ar 40Ar38Ar 40Ar40Ar 38Ar38Ar
78
Kr 80Kr 82Kr 83Kr
40 Ar37Cl
79
BrH 81BrH
inaccuracy of4% (likely dominated by weighing inaccuracy), as determined by repeat analyses of the USGS shales described below.
3.
Experimental
3.1 Hydride-generation MDF chemistry
The chemical purication of Se for both isotope ratio analysis and isotope dilution has been well described in a number of studies. In general we follow the methods of Rouxelet al.(2002) and Elwaer and Hintelmann (2008). Briey, this involves dissolution of the powdered shale samples in repeated steps of HF–HNO3and HNO3–H2O2, without exceeding 80C in order to avoid loss of Se by volatilisation. The double spike was normally introduced to the sample at the end of dissolution (during the nal HNO3step to allow spike-sample equilibration), but before chemistry, so as to be able to respike the same dissolved material if initial sample/spike mixtures were sub-optimal. Our experiments show that identical isotope ratios and concentra-tions result from adding the spike at various stages during dissolution. Because shales can contain a signicant amount of organic matter, we also experimented with dissolution of rock powders at high temperature and pressure, using an Anton-Paar HPA-S ashing system (2 hours at 220 C and 100 bar, in
concentrated HF and HNO3).
Following dissolution, the samples were reduced in 4 M HCl for 1 hour at 80C, and then passed three times through 0.2 g of
Thioglycollic Cotton Fibre (TCF).13Se was then desorbed from
the TCF by placing the TCF in a centrifuge tube with 1 ml concentrated HNO3and then heating the tube in a boiling water bath for 20 minutes. The oxidised TCF was then diluted with 3 ml MQ H2O and centrifuged. Multiple extractions ensure higher yields, but also dilute the sample more, because completely drying the sample down can cause the formation of insoluble thiol salts. It is, however, possible to extract Se several times (typically three times), and dry the resulting solution down to a pre-determined volume, in order to increase the Se concentration in the solution (by decreasing the solution volume). Following this, concentrated HCl was added to make the sample up to 1.6 M HCl, and heated at 80C for one hour, to
reduce the Se(VI) to Se(IV), ready for hydride generation.14,16,17 Yields of 100% can be obtained for experiments with pure Se, but comparisons of Se beam intensity on the mass spectrometer with concentrations derived from the double spike inversion clearly show that additional matrix can lead to lower yields. The yields from purifying shale samples are80–100%,1 and can
vary randomly with individual samples. This would likely not be observable in this, or indeed in other, studies unless some form of isotopic spiking were involved. Ashing samples leads to lower yields (50–60%), possibly because the high temperatures cause Se loss, as described elsewhere.13,29
However, this effect does not cause resolvable differences in the isotope ratio, due to addition of double spike prior to ashing. The total procedural blank from this method is0.4 pg Se, which is too low to determine a typical blank isotope ratio.
The TCF chemistry efficiently removes major elements (e.g.
post-chemistry Al/Se of SCo-110 5, determined on a Thermo
Finnigan Element 2 sector-eld ICP-MS, by calibrating against a set of synthetic multi-element standards), as well as matrix elements that could compete for hydride generation (S/Se of SCo-1 is reduced from700 to 0.002 by chemical purication, a similarnal ratio to NIST 3149). Complete elemental scans of puried SCo-1 have showed that Sb has relatively high post-chemistry abundance (Sb/Se reduced from 2.8 to 0.01). Such matrix effects should not affect double spiked measurements, but may inuence sample-standard bracketing (SSB), because Sb forms hydrides relatively easily,13and therefore its possible
inuence should be monitored in SSB studies. Abundances of elements with nuclides that isobarically interfere with the Se isotope spectrum are also reduced by the chemistry: As/Se in SCo-1 is reduced from 13.5 to 0.01, and Ge/Se from 1.7 to 10 4. Nevertheless these abundances are sufficient to cause signi-cant perturbation of the Se isotope ratios if not corrected and this effect can be greater in other shale samples as both As/Se and Ge/Se can be several orders of magnitude higher than in SCo-1 and SGR-1.
3.2 Analyses
All analyses were performed on a Thermo Finnigan Neptune multicollector inductively coupled plasma mass spectrometer, with a hydride-generation introduction system (HG-MC-ICP-MS) in the laboratories of the Bristol Isotope Group, University of Bristol. In order to reduce levels of oxide and hydride inter-ferences, standard“H”skimmer cones were used, rather than the more sensitive“X”cones. Since various NiO isotopologues produced from commonly used Ni cones can interfere on Se isotopes (e.g.58Ni16O0.03 pA, typically0.2–1% of the74Se beam), all cones used were aluminium, which reduced the intensity of58Ni16O by an order of magnitude. This also has the advantage of a15% sensitivity increase, likely because of the higher working temperatures of Al cones.
Samples were introduced using a Cetac HGX 200 hydride generator. This system features a frosted glass rod that allows enhanced mixing between the sample and the hydride forming reagent (NaBH4) and therefore a high efficiency of Se-hydride generation. However, this system also has the disadvantage that the frosted glass rod causes long wash-out times–on the order of tens of minutes to obtain natural ratios aer spiked samples.
In order to avoid using large volumes of rinse acid,75% of this rinse was performed while aspirating air, leaving the continu-ously pumped NaBH4to clean the glass rod.
At the beginning of an analytical session, the samples were taken up into 1.6 M HCl, ready for introduction into the hydride generator. For analysis, samples were mixed with 1% NaBH4 dissolved in 0.014 M NaOH in the hydride generator. All solu-tions were pumped through the hydride generator, using a multi-channel peristaltic pump. Using an uptake rate of300ml min 1, a 200 ng ml 1Se solution gave an intensity of30 pA on 76
Se. Including uptake time, the analyses requires 2 ml of sample and ideally a total of 400 ng of Se. Up to 3–4 times less Se can be analysed, although uncertainty begins to increase at the lower end of this spectrum, as the role of interferences starts to become critical (see Section 4.1). The amount of Se required is
generally similar to, or slightly higher, than reported by other recent studies,7,17,19and considerably more than reported for a
collision-cell instrument.13 Interestingly, this is the rst Se
isotope study to employ a Neptune, rather than Nu or Isoprobe MC-ICP-MS, potentially hinting that the relative sensitivity for interferences (such as argides, as detailed in Section 4.1) is somewhat higher on a Neptune. All measurements were bracketed with on-peak background measurements, and double-spiked NIST-3149 was analysed every 3–4 measure-ments. Each individual sample and blank measurement con-sisted of 50 ratios (210 s integration time).
4.
Interference corrections
A series of interference corrections were performed on measured samples. The justication and evaluation of these corrections are detailed below but, briey, analyses were back-ground corrected, to remove contributions from the plasma gas
and carrier matrix, followed by correction for Ge, SeH and AsH interferences. Most of these corrections are standard for Se isotope analysis,6,7,13,14,17,18,30 although we explore potential
pitfalls in these corrections to a greater degree than previous studies. The formulae used for the novel approach of simulta-neous correction of these interferences, together with the double spike inversion, are given in the appendix.
All nine faraday cups of the Neptune were used for the measurements, which allowed analysis of all Se isotopes and requisite Se-free isobaric interferences without peak jumping. The dominant beams collected in each cup, including the main interferences, are detailed in Table 1.
4.1 ArAr corrections (background correction)
Argon dimers from the plasma gas interfere on several Se isotopes. Most notably, typical40Ar40Ar intensities of 40 pA mean that its inuence on80Se cannot be accurately corrected,
Fig. 1 Se peaks determined at high resolution (M/DM10 000, 5–95% peak edge width) on an Element 2 HG-ICP-MS. Black lines represent the beam from a 25 ng g 1NIST-3149 solution. Grey lines represent beams obtained when aspirating clean acid. The resolved argide peaks have identical intensities in the sample and in the clean acid solution, indicating that Se aspiration and hydride formation does not affect argide formation, and therefore that background subtraction is a viable form of argide correction.
[image:5.595.76.520.273.679.2]but this is not the case for the minor Ar dimers. The most straightforward method for correcting for Ar dimer interference is by subtracting the background measured in clean acid (“ on-peak background”). It is alternatively possible to correct for ArAr by measuring the80Se-corrected40Ar40Ar beam, and using this to calculate the other ArAr beams.5,17
However, this method would require an appropriate functional relationship between 40
Ar40Ar and the other dimers; an assumption of an exponential mass dependent relationship as used for elemental species might be the most obvious. Although the exponential form is widely used for inter-relating atomic species its effectiveness for dimers is not well documented and need not necessarily be similarly appropriate. Further complications arise from the need to correct for80Kr or79BrH interferences on mass 80.
In contrast, an ‘on-peak’ background correction has the advantage that all machine-generated backgrounds are cor-rected (i.e.also those from Kr and ArArH), but this approach requires long wash-out times (up to 45–60 min) in order to return to a normal background aer analysis of a spiked
solu-tion. An assumption also needs to be made that the ArAr beams remain identical when aspirating Se-bearing and Se-free acidic solutions, although this is a common approach in MC-ICP-MS. However, we have tested this assumption, by connecting the hydride generator to an Element 2 ICP-MS run at high resolu-tion (M/DM10 000, 5–95% peak edge width), with which it is possible to resolve Se and ArAr peaks (albeit with a loss of almost an order of magnitude of sensitivity). As shown in Fig. 1, the ArAr peaks remain at the same intensity whether there is a Se peak present or not, justifying the use of a background correction. The40Ar37Cl interference, which is entirely domi-nated by the HCl matrix, on mass 77 is similarly corrected. The potential effect of uncorrected ArAr interferences is further explored in Section 4.4.
Nevertheless, a minimum Se intensity threshold is neces-sary, below which the background intensities of even the minor dimers, particularly 36Ar40Ar (typically 0.3 pA), cannot be corrected for with sufficient accuracy. A 10% background
contribution to the measured mass 76 intensity, using our inversion including76Se, causes a2.5&d82/76Se inaccuracy in measurements on NIST SRM-3149 (Fig. 2), whereas for a back-ground contribution of5% the measurements are within error of the reference value. In contrast, the38Ar40Ar background does not exceed0.1% of the 78 beam in either double spike system and therefore does not compromise the analyses.
4.2 Ge corrections
Germanium-73 was monitored to correct for Ge interferences on 74Se and76Se. Since fractionation of Se and Ge are likely subtly different, this correction will likely only work well at low Ge/Se relative abundances. It is therefore critical that tests were undertaken using Se standards doped with variable amounts of Ge to establish the limit of Ge/Se at which the correction is robust. The results of these tests, shown in Fig. 3, demonstrate that a Se mass bias can be used to correct Ge interferences accurately up to a Ge/Se intensity ratio of0.1 in the puried samples. The analysed Se fractions of the shale standards reported here have Ge/Se < 0.05 (mostly <0.03). Such correction problems are likely duplicated in any method that uses the Se mass bias to correct Ge interferences, and studies analysing samples with higher post-chemistry Ge/Se should monitor two Ge isotopes for accurate mass bias generation.
4.3 Hydride corrections (AsH, SeH, GeH, ArArH)
The use of a hydride generator results in large amounts of free hydrogen gas entering the plasma, which may subsequently bind to other elements introducing hydride molecular ions into the mass spectrometer. The method we employ to correct for hydride ions is to determine the degree of SeH formation by monitoring the background-corrected 82Se and mass 83, assumed to consist of only82SeH. The background correction (“on-peak background”) on mass 82 corrects for82Kr and81BrH, assuming Br dominantly stems from the carrier matrix (HCl), based on scans via an Element 2 ICP-MS, and on mass 83
Fig. 2 Se isotope ratios determined with decreasing Se intensity, and therefore increasing background contribution of 40Ar36Ar. This demonstrates the minimum signal to noise ratio for accurate data when using76Se for the double spike inversion. The error bars repre-sent the 2 s.e. of the analyses.
Fig. 3 Ge doping experiments on NIST-3149. In the insert the solid line represents 0&, and the dashed lines the external uncertainty (2 s.d.).
[image:6.595.47.287.508.671.2] [image:6.595.308.549.512.690.2]corrects for83Kr interference. Depending on the tuning of the hydride generator (e.g. concentrations of NaBH4) and of the mass spectrometer, the resulting SeH/Se is 10 3 to 10 4. Typically, tuning was optimised to minimise hydride formation. The correction of 76SeH on 77Se, and of 77SeH on 78Se is straightforward (see Appendix). The hydride correction is mass bias corrected for the difference in mass between 82Se/82SeH and the other hydride-forming isotopes.
Arsenic hydride is a signicant interference on 76Se. For example, an uncorrected AsH interference at an As/Se¼0.2 will decrease thenald82/76Se by 1 to 5&, depending on the sample introduction and mass spectrometer tuning. Since As is mon-oisotopic we assume, out of necessity, that the As/AsH ratio is identical to 82Se/82SeH. This relationship has been assessed using tests with the NIST-3149 standard doped with As, with ratios up to As/Se1.5 (As/76Se16; Fig. 4). Post chemistry, samples rarely exceed As/Se0.3 but occasionally shales with very high original As/Se (>100) may exceed this. Such samples were discarded, as the inuence of the interference is uncali-brated at such ratios, although it is possible that the correction will still be accurate.
Doping experiments have also shown that the GeH/Ge ratio is identical within uncertainty to that of SeH/Se (separate analyses of GeH formation (74Ge/74GeH) from a pure Ge solu-tion and SeH formasolu-tion from a pure Se solusolu-tion performed within a few minutes of each other, with the same tuning parameters). However, given the low abundance of Ge in puri-ed samples (typically0.1 pA on mass 73), no GeH correction was performed.
A further interfering hydride on the Se isotopic spectrum is ArArH. The degree of argide dimer hydride formation is different from that of SeH formation. We determined this from measurements of 40Ar40ArH/40Ar40Ar at
‘medium resolution’
(M/DM 6000, 5–95% peak edge width), which resolves the hydride from81Br. We found ArArH/ArAr0.01, 1
–2 orders of
magnitude greater than SeH/Se, which makes direct correction difficult because, given the number of faraday cups on a Neptune, a peak jump would have to be performed to measure the degree of argide dimer hydride formation at mass 81. Our observations on ArArH formation, however, have a bearing on studies that perform argide corrections based on the beam at mass 80 (e.g.ref. 17 and 21), rather than a background correc-tion, unless, for example, this is experimentally calibrated.17
Fortunately, as demonstrated above, the levels of argide dimer, and therefore also the levels of ArArH, are identical within measurement uncertainty in blank acid and sample and, therefore, ArArH is also corrected for in the background subtraction. The formulae for the simultaneous correction of all the above interferences as part of the double spike inversion are given in the appendix.
4.4 Double spike interference models
Although individual interferences can be corrected in the tests described above, it is nevertheless necessary to determine whether natural samples have had all interferences corrected. Generally this is hard to accomplish, especially with an isotopic system with few published studies or standards. However, the effectiveness of our correction procedure can be checked by spiking a natural sample with variable amounts of double spike, to generate different spike/sample ratios (fspike–dened as the mixture M in Rudge et al., 2009). Clearly, consistent results should be obtained regardless offspike, if the interferences are correctly accounted for. These results can also be compared with a similar test conducted on a variably spiked pure Se standard. Since double spike inversions respond non-linearly to interferences, and because changing the sample/spike ratio effectively varies the ratio of potential interferences to Se (at very
Fig. 4 Arsenic doping experiments on NIST-3149. The data represent experiments at several different mass spectrometer tuning settings, and therefore different levels of hydride formation. The error bars represent the 2 s.e. internal uncertainty of the analyses.
Fig. 5 Results of variably spiking standards and samples. The approach is detailed in the text. Both SGR-1 and SCo-1 data have been diff er-enced to their“true”d82/76Se value, as detailed in Table 2, in order to directly compare these data to NIST and model data. This approach shows that both NIST and shale samples behave identically to each other, demonstrating that all interferences are corrected. The NIST data also indicate the ideal sample-spike mix, where the uncertainty is smallest (fspike0.55–0.75).
[image:7.595.50.285.47.227.2] [image:7.595.308.550.458.640.2]high fspike only two Se isotopes are present, whereas at very lowfspikeSe is present in virtually natural abundances), a large
fspikerange provides the opportunity to test the accuracy of the isotopic data.
The results of variably spiking NIST-3149 and the USGS shales SGR-1 and SCo-1 are shown in Fig. 5. This exercise not only shows the optimal sample/spike ratio (“cocktail”26
), but also shows that isotope ratios resulting from variable spiking of the NIST standard and variable spiking of shales coincide. This demonstrates that all interferences, both instrumental- and sample-generated, are fully corrected for. In order to demon-strate how sensitive spiked samples are to uncorrected inter-ferences, we also show forward models for the78Se
–82Se double spike inversion with uncorrected interferences on various isotopes. Clearly the isotope with the greatest potential for uncorrected interferences is76Se (in an inversion using76Se, 77
Se,78Se and82Se), where explicit76Ge and75AsH corrections are required on top of a signicant back-ground correction (for 40
Ar36Ar). The variability of d82/76Se against fspike (Fig. 6) in models with incompletely corrected interference is strikingly different from the invariant results of rock standards run at different fspike, demonstrating that these interferences are correctly accounted for in the samples. This model indicates
that even an uncorrected 1&(0.1%) interference on76Se can push the nal d82/76Se by several permil from the true ratio, which demonstrates the necessity for careful interference correction. Modelling shows that the effect of the more minor argon dimer isotopologues is insignicant compared to that of 40
Ar36Ar.
Fig. 6 also shows the model results for an uncorrected interference at mass 82, which affects the d82/76Se to a lesser extent, but still demonstrates that any existing interferences are fully corrected in our data reduction.
5.
Analytical results and discussion
5.1 Shaled82/76Se and analytical uncertainty
The various tests described above give condence in the accu-racy of our analyses. Two USGS shale standards (SCo-1 and SGR-1b) were repeatedly analysed, including multiple dissolutions and chemical purication. Importantly, both were analysed using both double spikes described above, as a further test on sensitivity to inaccuracy of different aspects of our data reduc-tion. The results are shown in Fig. 7.
Fig. 6 Modelled results for variable spiking (see Fig. 5) if interferences are left uncorrected. For example, the black lines show results for a 2& uncorrected interference on76Se (A) and82Se (B), respectively. The data from variably spiked NIST (Fig. 5) are shown for comparison.
Fig. 7 Results from this study's analyses of both USGS shales (closed symbols), compared to published values (open symbols). (1): Schilling
et al., 2011; (2): St¨uekenet al., 2013; (3): Mitchellet al., 2012; (4) Rouxel
et al., 2002; (5) Layton-Matthewset al., 2006, 2013. The error bars in all cases represent the 2 s.d. analytical reproducibility. The small open diamonds represent this study's individual analyses.
[image:8.595.306.549.340.662.2] [image:8.595.51.282.351.682.2]The internal reproducibility of an analysis is strongly dependent on the sample/background ratio (Fig. 2). Since the beam from a hydride generator is inherently unstable, due to the instability in reagentow generated by the peristaltic pump, a low-intensity beam will be more strongly affected by back-ground noise. This instability results in periodic beam uctu-ations that will cause a degradation in the internal reproducibility which can be larger than the external repro-ducibility. Thus, for a <5% background contribution on76Se, the internal reproducibility is (0.03–0.1)& on d82/76Se, whereas for a 10% background contribution the reproducibility is 1& (Fig. 2). Samples were not run with a background contribution >5%. External uncertainty, based on repeated analyses (including dissolution and chemistry) of both USGS shales is0.17&(2sd) ond82/76Se.
Thed82/76Se values of both SCo-1 (d82/76Se¼ 0.220.15, 2sd,n¼18) and SGR-1 (0.250.17, 2sd,n¼16) from this study generally compare well to those published by Rouxel et al.
(2002), Schillinget al.(2011) and Layton-Matthewset al.(2006, 2013). The results from SGR-1 from this study and those of St¨uekenet al.(2013) are within analytical uncertainty of each other, but the population means of this study and that of Mitchellet al.(2012) are distinct from each other at the 95% condence level (studentt-test, using data from Mitchell 2013, pers. comm.). These studies present a mix of double spike7,19
and sample-standard bracketing analyses.13,17,24,25We note that
the study of Rouxelet al.(2002) used a collision cell instrument that is no longer manufactured, which likely had a very different interference spectrum to correct. In addition, the different dissolution methods trialled in this study (“standard” HF–
HNO3 dissolution vs. high temperature ashing) resulted in identical isotope ratios within analytical uncertainty. The values for both shales using these different methods are reported in Table 2. Given that we have determined these values with two separate double spike inversion systems, we recommend these USGS shales as useful and easily accessible rock standards for assessing accuracy, or at least inter-study reproducibility, for future Se isotope analyses. We can, as yet, offer no explanation for the differences in published values of SGR-1, especially compared to those reported by Mitchell et al., 2012. Further work is needed to determine whether SGR-1 is isotopically heterogeneous, or whether some studies have unresolved analytical issues.
5.2 Desolvation analysis of Se isotopes
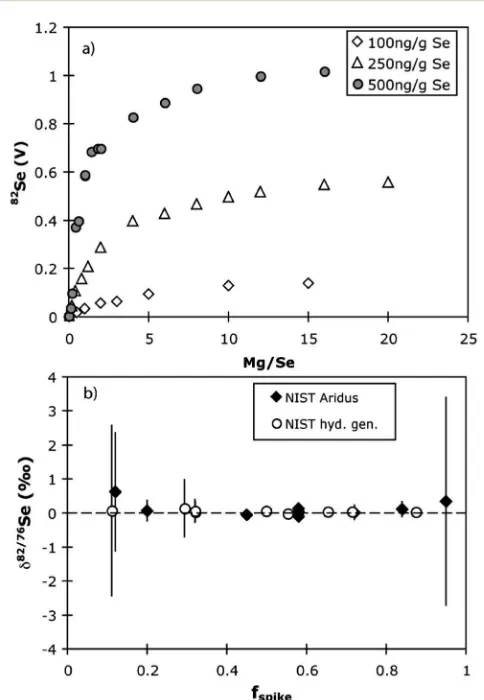
Generally the sensitivity of an MC-ICP-MS for Se is50 times better when using a hydride generator than a desolvation neb-uliser such as a Cetac Aridus. However, we have discovered that doping a Se (or sulphur) solution with magnesium (in this case, the Mg isotope standard DSM-3) enhances the sensitivity when using “wet” (Elemental Scientic Inc. Apex) or “dry” (Cetac Aridus) plasma by up to a factor of 100–200 (Fig. 8a). The greatest Se sensitivity occurs at Mg/Se mass ratios of 10–20. When normalised to uptake rate (50ml min 1), the sensitivity of Mg-doped Se using an Aridus is 1.6–1.9 times greater than that of a hydride generator. Here, Se was introduced as selenate, in 2% HNO3. Yield enhancement of Se when using ICP-MS has been reported when doping the solution with carbon31 or in
H2SO4- or HCl-based matrices.32However, these enhancements are only a factor of 2–3 (two orders of magnitude less than this study), and is thought to be due to the transfer of electrons to the C ions, because Se has a lower ionisation potential than C.31
[image:9.595.306.548.326.676.2]Clearly this effect cannot be causing the sensitivity enhance-ment by Mg, because Mg has a lower ionisation potential than Se. Recently, sulphate sensitivity has been enhanced by a factor
Table 2 Results of the two USGS shale standards analysed in this study.*indicates ratios converted tod82/76Se fromd82/77Se. Unless indicated, results were obtained using a78Se–82Se spike
dissolution n d82/76Se 2 sd [Se]mg g 1
SCo-1 Standard 14 0.23 0.16
Ashing 3 0.20 0.13
74Se
–78Se spike Standard 1 0.09*
Mean 18 0.22 0.15 0.79
SGR-1b Standard 12 0.26 0.15
Ashing 2 0.19 0.06
74
Se–78Se spike Standard 2 0.21* 0.09
Mean 16 0.25 0.17 3.10
Fig. 8 (a) Mg doping of Se solutions when using an Aridus introduction system. Mg/Se is given as a mass ratio. (b) Results of variably spiking Mg-doped NIST-3149, also using an Aridus. The error bars represent the 2 s.e. internal reproducibility.
[image:9.595.41.292.618.726.2]of20, by doping with Na.33That study was also not able to
explain these effects, and proposed that it might be related to the desolvating membrane. Our experiments with a membrane-less Apex, as well as a desolvating Aridus, now demonstrate this not to be the case. To our knowledge, sensitivity enhancement by Mg doping has not been reported to date. The enhancement effect also means that Se concentration analyses in any matrix containing Mg may be highly inaccurate unless either isotope dilution is used, or concentration analyses are performed by hydride generation ICP-MS.
The sensitivity enhancement effect of Mg could however be used to analyse Se isotope ratios in low concentration samples. Advantages of using desolvation introduction systems over hydride generation include faster washout times, more stable beams, and an introduction system that is more widely used. An obvious drawback is that in dry plasma mode, argide dimer production is higher. However, this can be overcome by tuning gas ows, torch positions and RF generator power until the background on76Se is sufficiently low (<5%) for corrections to be accurate.
Double-spike was used to analyse the Mg-doped Se solutions. Differences in mass bias style (i.e.deviations from exponential mass bias) due to Mg addition to pure Se solutions are not resolvable in double spike inversions. As shown in Fig. 8b, mixtures of the NIST standard with amounts of spike yield consistent results whether run by hydride generator or with Mg-addition and desolvation, which implies that, whilst the relative importance of different interferences using the two techniques might change, our procedure corrects for these accurately.
The intensity of the main interferences (Ge and As) are little affected by Mg doping, and desolvation nebulisation is not an efficient means of generating Ge beams. Thus a solution with Ge/Se¼0.2, when doped with Mg, has a measured Ge/Se¼0.05. In contrast, the sensitivity of As when using desolvation nebu-lisation is not as poor as for Ge, and the yield of Mg-doped SeH is different from that of AsH in the same solution, so that the SeH yield cannot be used to correct for AsH. This means that a double spike scheme that avoids76Se is advisable, for example the alternative inversion scheme detailed in this study, or in other studies.19Nevertheless, this method provides the
poten-tial for Se isotope analysis by laboratories with no hydride generation facilities.
5.3 Mass independent fractionation of selenium
Sulphur mass independent fractionation (MIF) has been reported in samples from the Archean, and is generally thought to reect photolysis of S-bearing tropospheric gases by ultravi-olet radiation and the production of elemental sulphur particles in the atmosphere.34–36 Thus, the widespread occurrence of
signicant non-zeroD33S (D33S¼(33S/32S)
sample/(33S/32S)V-CDT [(34S/32S)
sample/(34S/32S)V-CDT]0.515) in rocks deposited prior to 2.4 Ga (ref. 34) suggests that atmospheric O2 was <10 5 of present atmospheric levels,37,38and that reducing gases such as
methane or hydrogen were considerably more abundant than today.39Given the chemical similarities between S and Se, partly
through the volcanic cycle,6 and the ability of both to form
compounds that are gases, it is possible that Se isotopes could demonstrate MIF in a manner similar to S isotopes.
To test the hypothesis that Se MIF may be preserved in Archean shales, we have performed Se isotope analyses onve Neoarchean shales from a well-preserved drill core (GKF01) from the2.65–2.5 Ga Ghaap Group, South Africa,40
all of which record largeD33S fractionations ( 1.7 to +6.9&; Table 341
). Our analyses were identical to those described above for hydride generation mass dependent fractionation, except that samples were not double-spiked, and new plasma interface cones were employed in the mass spectrometer that had not been used for any double spiked analyses. While no memory effect from spike tracer has been observed on the cones in this study, changing cones countered any such possibility. In addition, the hydride generator was thoroughly cleaned prior to analyses, and all sample introduction tubing was replaced. Finally, sample analyses were bracketed by analyses of NIST-3149, in order to be able to correct for any non-exponential law instrumental mass fractionation. Due to the potential mass-dependent fraction-ation effects of the chemistry, MDF results are not reported from these samples.
There are no MIF Se data reported in any previous studies. Those studies that have used SSB to determine mass-dependent fractionation (MDF)4,13,17,24,25neither report su
fficient statistical detail nor, with one exception,13the results of repeat analyses,
[image:10.595.46.554.587.727.2]making it impossible to retrospectively calculate the uncertainty of the MIF. In principal, SSB-determined MDF ratios may be used for reporting MIF, but care needs to be taken to propagate the uncertainties, and their correlations, to correctly determine
Table 3 Se mass independent fractionation isotope ratios.D33S data from Zerkleet al.(2012)
Sample Formation D33S (&) 376=77Se
82 78(
‱) 2 se 382=77Se
82 78(
‱) 2 se
SGR-1b 1.654 0.416 0.496 0.276
SGR-1b 2.853 0.522 0.208 0.393
GKF01 Depth (m)
832.1 U. Nauga Fm. 4.5 1.489 0.720 0.543 0.373
982 L. Nauga Fm. 4.6 1.651 0.894 0.460 0.370
1141.8 L. Nauga Fm. 6.9 2.206 0.395 0.180 0.270
1413.6 Monteville Fm. 1.7 1.871 0.250 0.433 0.149
1462.3 Lokammona Fm. 4.7 2.028 0.485 0.361 0.340
2 sd 2 sd
Mean Archean shales 1.849 0.574 0.395 0.274
the uncertainty in the MIF. In general, the correlations between the isotope ratios are such that explicit MIF measurements using internal normalisation are signicantly more precise than MDF measurements. The study by Rouxelet al.(2002), wherein isotope measurements on repeat analyses of a MERCK Se standard are reported, allows us one point of comparison of the uncertainty to our own MIF data. We have calculated the MIF on each analysis of the MERCK standard (excluding two that did not measure77Se, see Table 4 in ref. 13) using the exponential fractionation law to normalise to 82Se/78Se yielding a repro-ducibility of0.20&(2s,n¼13) for MIFd82/77Se compared to our MIF reproducibility of0.03–0.04&as detailed below.
Given the low relative intensities of interferences on77Se, 78Se and 82Se, the 82Se/78Se ratio was used to internally
normalise the reported82Se/77Se ratio, using the exponential mass bias law.42We have also examined the82Se/78Se
normal-ised 76Se/77Se ratio. We present our internally normalised results in epsilon form (deviation in parts per 10 000, to bring units in-line with other isotopic MIF results (e.g., ref. 43):
3x=77Se 82 78 ¼ 0 B B B B B B B B B @ xSe 77Se 82 78 0 @ 1 A spl xSe 77Se 82 78 0 @ 1 A std 1 1 C C C C C C C C C A
104 (1)
where the normalising ratio is included as a subscript (i.e., 82Se/78Se),43andxrefers to76Se or82Se, spl is the sample, and std the standard. The interferences on76Se (from Ge, As and ArAr) result in variable376=77Se82
78Thus for 500 ng g 1
NIST-3149,
376=77Se82
78varies by
1.2‱, and for SGR-1b (n¼2, chemistry¼ 2) it varies by1.7‱. This suggests that these interferences are also a large factor in the uncertainty on the double spike inversions described above. However the 382=77Se82
78 ratio
reproduces much better; the analytical uncertainty for NIST-3149 is0.31‱, and for SGR-1b is0.40‱(Table 3). This uncertainty is therefore likely to be the external reproducibility of our analyses, assuming that the Eocene SGR-1b does not exhibit any Se MIF.
The Archean shales exhibit a mean 382=77Se82
78 of 0.39
0.27‱(n ¼ 5). All shales (including SGR-1b) exhibit slightly negative 382=77Se
82
78 values relative to NIST-3149, which may suggest that NIST-3149 itself is not typical of common terrestrial Se. This has been observed for several other highly puried standards analysed to high precision for MIF.43–45This effect is
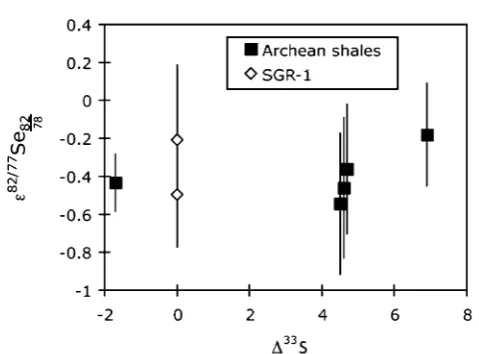
potentially as a function of the purication by non-exponential processes, and/or that during purication, a species other than the element is being fractionated (e.g.in this case selenate- or selenite-oxide rather than pure Se). In any case, the critical observation is that the Archean shales are within the range of SGR-1b, and therefore do not exhibit any resolvable mass independent fractionation, or correlation between 382=77Se82 78 andD33S (Fig. 9). This may be because Se gas-phase reactions are not photocatalysed in a mass independent manner under anoxic atmospheric conditions, but could also be due to homogenisation of an atmospheric Se MIF signal prior to preservation in the sediment.46
In addition, oxidised Se gases tend to be less volatile than similar sulphur-based compounds.
6.
Conclusions
This study presents data using two different double spikes and variably-spiked samples to accurately constrain selenium isotope ratios in two different USGS shale standards. Our measurements suggest that the d82/76Se (82Se/76Se deviation from NIST-3149) values of SCo-1¼ 0.220.15&(n¼18), and of SGR-1b¼+0.250.17&(n¼16). Measurements obtained by other studies using a mix of double spike or sample-standard bracketing, generally agree well with our robustly dened values.
We also present a new method for measuring Se isotopes (for isotope dilution or isotope ratios) using desolvation or“moist”
plasma. Doping Se solutions with Mg leads to an increase in Se sensitivity by a factor of 100–200, almost 2 times greater than the uptake-rate normalised sensitivity of a hydride generator.
Finally, we have assessed Archean shales that demonstrate sulphur mass independent isotope fractionation (MIF) for Se MIF. The 82Se/77Se ratios, normalised to 82Se/78Se, show no signicant deviations from analyses of the Eocene standard SGR-1b ( 0.390.27‱, parts per 10 000), and no correlation with existingD33S measurements in Archean samples. Thus, Se does not show resolvable MIF behaviour in samples that are likely candidates to record a strong variability in MIF signature.
Appendix
Interference corrections for 78–82 double spiked samples. Aer on-peak blank subtraction the ion beam intensities
76Tot, 77Tot, 78Tot and 82Tot at masses 76, 77, 78 and 82
Fig. 9 Mass independent Se isotopes (in parts per 10 000) plotted against mass independent S isotopes. The error bars on the individual data points represent 2 s.e. internal reproducibility. The 2 s.d. external reproducibility can be observed from the repeated measurements of SGR-1b.
[image:11.595.47.287.493.670.2]respectively are taken to be the sums of the contributions from: (i) Se and Ge atomic ions and (ii) SeH and AsH molecular ions,i.e.,
76Se¼76Tot 76Ge AsH
(2)
77
Se¼77Tot 76SeH (3)
78
Se¼78Tot –77SeH (4) 82Se su
ffers no contributions from these species. With the assumption of a single instrumental mass bias parameter, b
(see Rudgeet al., 2009), which applies to all species, the ion beam intensities76Ge, SeH and AsH in the above equations may be written in terms of the measured intensities of73Ge,82SeH and As thus,
76Se¼76Tot 73Ge½76Ge=73GeebpGe As
$hebðpAsH p
SeH 83 Þ (5)
77Se¼76Tot 76Se
$hebðp
SeH 77 p
SeH
83 Þ (6)
78Se¼78Tot 77Se
$hebðp
SeH 78 p
SeH
83 Þ (7)
where
h¼82SeH/82Se (8)
pGe¼ln{mass(76Ge)/mass(73Ge)} (9) pAsH¼ln{mass(AsH)/mass(As)} (10) p83SeH¼ln{mass(82SeH)/mass(82Se)} (11)
p77SeH¼ln{mass(76SeH)/mass(76Se)} (12)
p78SeH¼ln{mass(77SeH)/mass(77Se)} (13)
[76Ge/73Ge] is the true Ge isotopic abundance ratio, assumed known.
Let,
m1(b)¼77Se/76Se (14)
m2(b)¼ 78
Se/76Se (15)
m3(b)¼82Se/76Se (16)
Using eqn (5)–(7) we may write down expressions for these three isotopes ratios in terms of measured intensities, known constants and the instrumental mass bias, b. For the measurement of a mixture of sample and double-spike tracer we may write down three mixing relations,
mi(b)e bPi¼lTi+ (1 l)nie aPi, (i¼1, 2, 3) (17)
where Pi¼ln{mass(xxSe)/mass(76Se)} andxx¼77, 78 and 82 for
i¼1, 2, and 3 respectively, Ti is the isotopic ratio of the double spike tracer,ais the fractionation (parameter) of the sample relative to the reference ratio,ni, andlis the mixing parameter. These are the well-known sample-tracer mixing equations (see
the Double Spike Toolbox (Rudge et al., 2009) for these well-established denitions and equations) with the mixture ratio,
mi, now a function ofbas a result of the interference correction. we can solve these three equations for the three unknownsa,b
andlby means of standard numerical methods. The reported d82/76Se is then given by,
d82/76Se¼(e aP3 1)103 (18)
Acknowledgements
The authors would like to thank Thomas Johnson and Kristin Mitchell for discussions on Se isotopes. Analyses were sup-ported by NERC grant NE/F016832/1. PPvS is supsup-ported by NERC fellowship NE/I020571/1.
References
1 S. K. Clark and T. M. Johnson,J. Environ. Qual., 2010,39, 2200–2210, DOI: 10.2134/jeq2009.0380.
2 T. M. Johnson, Chem. Geol., 2004, 204, 201–214, DOI: 10.1016/j.chemgeo.2003.11.015.
3 T. M. Johnson, M. J. Herbel, T. D. Bullen and P. T. Zawislanski, Geochim. Cosmochim. Acta, 1999, 63, 2775–2783, DOI: 10.1016/s0016-7037(99)00279-3.
4 O. Rouxel, Y. Fouquet and J. N. Ludden, Geochim. Cosmochim. Acta, 2004, 68, 2295–2311, DOI: 10.1016/ j.gca.2003.11.029.
5 H. J. Wen and J. Carignan,Geochim. Cosmochim. Acta, 2011, 75, 1411–1427, DOI: 10.1016/j.gca.2010.12.021.
6 T. M. Johnson and T. D. Bullen, in Geochimistry of Non-Traditional Stable Isotopes, ed. C. M. Johnson, B. L. Beard and F. Albarede, Geochemical Society, 2004, pp. 289–317. 7 K. Mitchell, P. R. D. Mason, P. Van Cappellen, T. M. Johnson,
B. C. Gill, J. D. Owens, J. Diaz, E. D. Ingall, G. J. Reichart and T. W. Lyons,Geochim. Cosmochim. Acta, 2012, 89, 302–317, DOI: 10.1016/j.gca.2012.03.038.
8 A. Fernandez-Martinez and L. Charlet, Rev. Environ. Sci. Biotechnol., 2009,8, 81–110.
9 A. S. Ellis, T. M. Johnson, M. J. Herbel and T. D. Bullen,
Chem. Geol., 2003, 195, 119–129, DOI: 10.1016/s0009-2541(02)00391-1.
10 M. J. Herbel, J. S. Blum, R. S. Oremland and S. E. Borglin,
Geomicrobiol. J., 2003,20, 587–602, DOI: 10.1080/713851163. 11 M. J. Herbel, T. M. Johnson, R. S. Oremland and T. D. Bullen,
Geochim. Cosmochim. Acta, 2000, 64, 3701–3709, DOI: 10.1016/s0016-7037(00)00456-7.
12 T. M. Johnson and T. D. Bullen,Geochim. Cosmochim. Acta, 2003,67, 413–419.
13 O. Rouxel, J. Ludden, J. Carignan, L. Marin and Y. Fouquet,
Geochim. Cosmochim. Acta, 2002,66, 3191–3199.
14 N. Elwaer and H. Hintelmann,Anal. Bioanal. Chem., 2007, 389, 1889–1899, DOI: 10.1007/s00216-007-1537-z.
15 D. Savard, L. P. Bedard and S.-J. Barnes,Talanta, 2006,70, 466–571.
16 N. Elwaer and H. Hintelmann,J. Anal. At. Spectrom., 2008,23, 733–743, DOI: 10.1039/b801673a.
17 E. E. St¨ueken, J. Foriel, B. K. Nelson, R. Buick and D. C. Catling, J. Anal. At. Spectrom., 2013, 28, 1734–1749, DOI: 10.1039/c3ja50186h.
18 N. Elwaer and H. Hintelmann,J. Anal. At. Spectrom., 2008,23, 1392–1396, DOI: 10.1039/b808645c.
19 K. Schilling, T. M. Johnson and W. Wilcke,Soil Sci. Soc. Am. J., 2011,75, 1354–1364, DOI: 10.2136/sssaj2010.0377. 20 J. M. Zhu, T. M. Johnson, S. K. Clark and X. K. Zhu,Chin. J.
Inorg. Anal. Chem., 2008,36, 1385–1390.
21 J. M. Zhu, T. M. Johnson, S. K. Clark, X. K. Zhu and X. L. Wang,Geochim. Cosmochim. Acta, 2014,126, 228–249. 22 H. Fan, H. Wen, R. Hu and H. Zhao,Geochim. Cosmochim.
Acta, 2011,75, 7725–7740, DOI: 10.1016/j.gca.2011.09.027. 23 T. R. Kulp and L. M. Pratt,Geochim. Cosmochim. Acta, 2004,
68, 3687–3701, DOI: 10.1016/j.gca.2004.03.008.
24 D. Layton-Matthews, M. I. Leybourne, J. M. Peter and S. D. Scott, J. Anal. At. Spectrom., 2006, 21, 41–49, DOI: 10.1039/b501704a.
25 D. Layton-Matthews, M. I. Leybourne, J. M. Peter, S. D. Scott, B. Cousens and B. M. Eglington,Geochim. Cosmochim. Acta, 2013,117, 313–331.
26 J. F. Rudge, B. C. Reynolds and B. Bourdon,Chem. Geol., 2009,265, 420–431, DOI: 10.1016/j.chemgeo.2009.05.010. 27 J. Wang, T. X. Ren, H. Lu, T. Zhou and M. T. Zhao,Int. J.
Mass Spectrom., 2011, 308, 65–70, DOI: 10.1016/ j.ijms.2011.07.023.
28 J. Carignan and H. J. Wen,Chem. Geol., 2007,242, 347–350, DOI: 10.1016/j.chemgeo.2007.03.020.
29 Y. K. Chau and J. P. Riley,Anal. Chim. Acta, 1964,33, 36–49. 30 N. Elwaer and H. Hintelmann,Talanta, 2008,75, 205–214,
DOI: 10.1016/j.talanta.2007.10.046.
31 E. H. Larsen and S. Sturup,J. Anal. At. Spectrom., 1994,9, 1099–1105, DOI: 10.1039/ja9940901099.
32 K.-S. Park, S.-T. Kim, Y.-M. Kim, Y. Kim and W. Lee, Bull. Korean Chem. Soc., 2002,23, 1389–1393.
33 G. Paris, A. L. Sessions, A. V. Subhas and J. F. Adkins,Chem. Geol., 2013,45, 50–61.
34 J. Farquhar, H. M. Bao and M. Thiemens,Science, 2000,289, 756–758, DOI: 10.1126/science.289.5480.756.
35 J. Farquhar, J. Savarino, S. Airieau and M. H. Thiemens,J. Geophys. Res.: Planets, 2001, 106, 32829–32839, DOI: 10.1029/2000je001437.
36 J. Farquhar, N. P. Wu, D. E. Caneld and H. Oduro,Econ. Geol., 2010,105, 509–533.
37 A. A. Pavlov and J. F. Kasting,Astrobiology, 2002,2, 27–41, DOI: 10.1089/153110702753621321.
38 M. H. Thiemens, in Annual Review of Earth and Planetary Sciences, 2006, vol. 34, pp. 217–262.
39 K. Zahnle, M. Claire and D. Catling,Geobiology, 2006,4, 271–
283, DOI: 10.1111/j.1472-4669.2006.00085.x.
40 S. Schroder, J. P. Lacassie and N. J. Beukes,S. Afr. J. Geol., 2006,109, 23–54.
41 A. L. Zerkle, M. Claire, S. D. Domagal-Goldman, J. Farquhar and S. W. Poulton, Nat. Geosci., 2012, 5, 359–363, DOI: 10.1038/ngeo1425.
42 W. Russell, D. A. Papanastassiou and T. Tombrello,Geochim. Cosmochim. Acta, 1978,42, 1075–1090.
43 R. C. J. Steele, T. Elliott, C. D. Coath and M. Regelous,
Geochim. Cosmochim. Acta, 2011, 75, 7906–7925, DOI: 10.1016/j.gca.2011.08.030.
44 R. W. Carlson, M. Boyet and M. Horan,Science, 2007,316, 1175–1178.
45 F. Moynier, A. Agranier, D. C. Hezel and A. Bouvier,Earth Planet. Sci. Lett., 2010,300, 359–366.
46 J. Farquhar and B. A. Wing,Earth Planet. Sci. Lett., 2003,213, 1–13, DOI: 10.1016/s0012-821x(03)00296-6.