Ol .... '
CX)
0
~
'
X
RAW MATERIALS
RESEARCH AND DEVELOPMENT
STUDIES ON SECONDARY RAVV MATERIALS
11. RECYCLING
OF NON-FERROUS METALS
February 1979
For official use only
(by ITE in cooperation with SGM and CERIMET)
By viewing the various products and product groups with regard
to technological problems of recovery1it may be stipulated that certain common features exist in spite of many differences in
size, metal input and availability of products. The major
tech-nical constraints on recycling of non-ferrous metals are concerned
with their separation from materials in the waste stream, from
other materials added during the manufacture of the product or
from other elements in alloys.
On the other hand, regarding the efficiency of scrap collection,
two different sources should be distinguished. Production waste
as well as old scrap arising within the industries are usually
recovered as far as feasible at given technology and prices of
secondary metals. In contrast, products becoming obsolete within
the household sector are normally disposed of in household refuse
and therefore, at present, hardly recovered. This second source
evidently offers the more important potential for additional
re-cycling.
1. Aluminium Recycling
Some of the most important problems are: the increasing complexity
of scrap to be converted into secondary alloys; the call for
re-duction of energy consumption and of labour requirements; the
con-trol of pollution related to some operative methods used in
secon-dary aluminium metallurgy.
For some methods in the field of sorting and dressing further
improvements are to be expected, as additional experience from
industrial practice can be used. Entirely new approaches might,
however, be tried for some of the processes: For instance the
armoured or oil-filled cables. A future development might
possibly consist in adapting some of the existing methods
for treating lead sheated cables by modifying the
desinte-gration process, and complementing it with the separation
of lead from the other metals. The possibility of a
cryo-genic grinding has to be pointed out in which lead is
sub-ject to embrittlement. Of course, the economical factors
are prevailing on all other ones.
The recycling of scrapped lead in its more sophisticated forms, like batteries and cables, gives rise to a number of pollution
problems, mainly air pollution, owing to the emission of sulphur
dioxide and of chloridized fumes, but also water pollution, in
view of the lowest lead levels in streams, tolerated by law
re-gulations. The last referred factor might cause law infringement,
when dumping materials, even slightly contaminated by lead
com-pounds.
Under such conditions, future development might come off as
follows:
Improvements in retreatment and recovery of
sulphurized-chloridized fumes, to be accomplished possibly in one
plant, jointly owned by many smelters, and operating e.g.
by hydrometallurgical methods.
Replacing pyrometallurgical methods for treating battery
active masses and other lead oxides and compounds, with
other partially or totally hydrometallurgical methods,
thus reducing air pollution and possibly hindering also
water pollution.
The trend to substitute hydrometallurgical methods for
pyro-metallurgical ones is already to be observed in the primary
Attempts might be made - within the hydrometallurgy research
work - to produce high value lead oxides or compounds directly
from recycled material, avoiding the reduction to metal, by
using special selective reagents or by purifying lead salt
solutions.
The economic advantages of such an approach are apparent.
3. Copper Recycling
To increase the copper recycling, main aspects are:
To make the scrap more homogeneous
1new techniques should
be developed, although some new processes, like cable
chopping or car shredding, are already applied on a large
scale. Important progress is still to be made to generalize
such methods to mixed scrap.
A type of scrap to which more research work should be
applied is low-grade "irony" scrap, such as electric
motor scrap or copper-steel residues from car shredders.
Cryogenic grinding is a new way of processing some types
of scrap, but its economics are still uncertain, being too
dependent on the price of the cooling agent. An estimation of the conditions under which such operations are
profi-table could help assessing the future of this method; scrap
and copper prices, choice and price of the cooling agent, size of the cryogenic plant, etc. should be taken into
account.
For secondary copper smelters and alloyers, a reduction of
the treatment costs depends primarily on furnace operations.
Methods like oxygen enrichment of the air, air preheating,
natural gas paling, are to be studied further to be applied
The improvement in the recovery of by-products from
copper scrap and of the proportion of copper recycled
from the converter to the blast-furnace as a slag,
should also be increased.
Electrolytic refining should also be the subject for
research on the way of treating anodes produced from
very impure blister copper or complex scrap. In some
cases, this might allow to avoid either a preliminary
refining, or the production of second-quality copper
that is more difficult to utilize.
4. Zinc Recycling
To increase the zinc recycling research work, one should
con-centrate on the recycling of galvanized products and zinc die
castings. In addition zinc recycling from products such as
batteries or tyres might be of interest.
In the case of zinc recovery from galvanized products1there is at present only one direct process of recovery, the
Prayon process. However, under present conditions the
pro-cess is not yet applicable. On the other hand different
processes for the treatment of iron dusts and sludges
dusts have been developed. These dusts and sludges are
of various origins:
blast furnaces
converters
open-hearth and electric furnaces.
The industrially most elaborate process to retreat iron
dusts consists in the direct reduction of these dusts in
a WAEL2-type rotary furnace. The economics of this process
would moreover require Zn-rich dusts. The processing of
econo-mical. However, up to now only small quantities of zinc are
recovered from galvanized products, mainly due to economic
reasons. 1
NeYt to galvanized products, still important and yet hardly
utilized sources of zinc recycling are zinc die castings
which are primarily used in the motor car industry. The
re-cycling difficulties of these products result from their
widespread applications especially as small parts. So far,
larger quantities have only been recovered from motor cars.
Recycling from other product areas is still very small
be-cause of disposal in household refuse and separation
diffi-culties.
So far, zinc recycling from primary batteries has not been
feasible, since obsolete cells are disposed of in household
refuse and are either dumped or incinerated. Other problems
are related to the mechanical separation of batteries.
As for the zinc oxides used in tyres, there are several
tech-niques of recycling. At present, only small quantities are
recovered in F.R. Germany. How far recycling in this field
will actually increase in future depends largely on the
choice of technology. This decision is subject to economical
factors whereby zinc recovery plays only a subordinate role.
5.
Tin RecyclingBy far the most important individual area of tin application - as
regards additional recycling- is packaging, i.e. tinplate from old
cans. For many years the new scrap resulting from the production of
tinplate and especially cans has been recycled. However, much larger
quantities of old tin-containing materials have remained almost unused.
1
It must be pointed to the fact, that besides research for a better product from flue dust processing, there exists the need for an
They get into industrial and domestic refuse and are only
rarely recycled. At present, recycling usually takes place
only in the form of steel recycling. The recovery of tin
from used tinplate packaging is up to now subject to
re-search efforts undertaken in nearly all industrialized
countries. The main obstacles to the salvaging of used
material are the collection and processing problems; the
detinning process itself seems to be less problematic,
as the technique is principally the same as in the case
of production wastes (new scrap).
The tin content of alloys such as white metal (bearings),
solder, bronze, etc. is already recycled to a
comparative-ly large extent. But most tin recycling processes in this
field result in "Mischzinn" or similar lead and tin
con-taining alloys which are reused as alloys. It seems to be
appropriate to emphasize the problem of high grade tin
separation from tin-lead-alloys in an economic way as one
of the most relevant and necessary developments in this
(Directorate General XII - Research, Science, Education)
IDENTIFICATION OF AREAS FOR R & D ACTIVITIES TO
INCREASE THE RECYCLING OF NON-FERROUS METALS
Report prepared on the basis of data provided by
DEUTSCHES INSTITUT FUR WIRTSCHAFTSFORSCHUNG (DIW), BERLIN AND INFRATEST-INDUSTRIA, MONCHEN
Authors
ITE Mathias Lefeldt, Herbert van Gerpen, Knut Base
DIW Detlef Filip, Renate Filip-Kohn
INFRATEST-INDUSTRIA : Arpad Geissler
Institut zur Erforschung technologischer Entwicklungslinien Neuer Jungf~rnstieg, 21
2000 Hamburg 36
(Federal Republic of Germany)
1. Selection of non-ferrous metal containing products on the basis of input/output-tables
1.1. Preliminary remarks on the input/output-matrix 1.1.1. The relationship of an input/output-matrix 1.l.2. The role of input/output-tables within the study 1.2. Examples of raw material flow
1.2.1. Aluminium 1.2.2. Lead 1. 2 . 3 • Copper 1.2.4. Zinc 1.2.5. Tin
1.3. Selection of non-ferrous-metal containing products 1.3.1. Aluminium
1.3.2. Lead 1. 3. 3. Copper 1. 3. 4. Zinc 1. 3. 5. Tin
2. Main areas for increasing recycling of non-ferrous metals 2.1. Assessment of domestic availability
2.1.1. Preliminary remarks 2.1.2. Statistical survey 2.1.3. Summary of results 2.2. Identification of problem areas
2.2.1. Classification by recycling possibilities 2.2.2. Recycling problems of individual products 2.3. The recycling potential of major problem areas
2.3.1. Alumini~m
2.3.2. Lead 2.3.3. Copper 2.3.4. Zinc 2.3.5. Tin
3. Su~~ary and conclusions
3 .1. Prod:.1ct l~fe-time and scrap recovery ra·tes 3.2. Further considerations
Table 1: The intermediate part of input-output-tables 5 Table 2: Basic outline of an input-output-table 7 Table 3: Calculation of primary inputs of the input-output-tables 1972 9 Table 4: Structure of inputs and outputs of aluminium for the mE>tor car
industry, 1972, in 1000 t 13
Table 5: Structure of inputs and outputs of aluminium for the production
of semimanufactured goods, 1972, in 1000 t 15 Table 6: Structure of inputs and outputs of lead for building and civil
engineering, 1972, in 1000 t 17
Table 7: Structure of inputs and outputs of lead for paints and lacquers,
1972, in 1000 t 18
Table 8: Structure of inputs and outputs of copper for machine-tool
industry, 1972, in 1000 t 20
Table 9: Structure of inputs and outputs of copper for products for
electrical use, 1972, in 1000 t 21 Table 10: Structure of inputs and outputs of zinc for building and civil
engineering, 1972, in 1000 t 24 Table 11: Structure of inputs and outputs of zinc for galvanized steel
sheet, 1972, in 1000 t 26
Table 12: Structure of inputs and outputs of tin for production of
solder , 1972, in 1000 t 27
Table 13: Hain items of final use of aluminium, 1972 31 Table 14: Hain items of final use of lead, 1972 34 Table 15: Main items of final use of copper, 1972 35 Table 16: Main items of final use of zinc, 1972 38 Table 17: Main items of final use of tin, 1972 41 Table 18: Calculation of the domestic availability of aluminium in products
for final use, 1972 44
Table 19: Calculation of domestic availability of lead in products for
final use, 1972 46
Table 20: Calculation of domestic availability of copper in products for
final use, 1972 47
Table 21: Calculation of domestic availability of zinc in products for
final use, 1972 49
Table 22: Calculation of domestic availability of tin in products for
final use, 1972 51
Table 23: Characterization of problems for recovery of relevant non-ferrous
metals in selected industries and sectors 54
Table 24: Problem areas for recycling of aluminium 64 Table 25: Problem areas for recycling of lead 68 Table 26: Problem areas for recycling of copper 71 Table 27: Problem areas for recycling of zinc 75 Table 28: Problem areas for recycling of tin 78 Table 29: Average lifetime of selected products 81
FIGURES
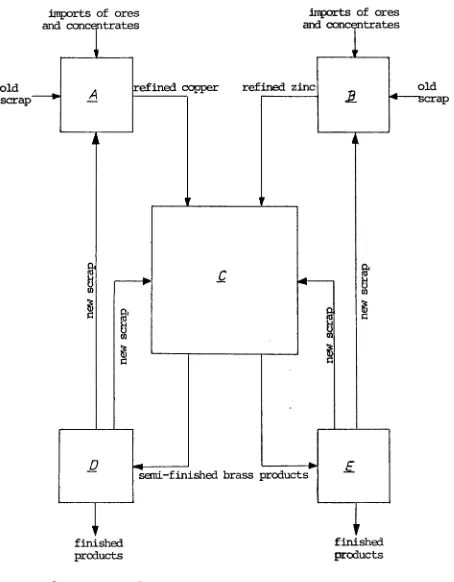
Figure 1: Interlocks of deliveries and supplies between five production sectors
Figure 2: Total recovery potential of main problem areas, in value ~
4
ties and means of a common policy of research and develop-ment", the Commission proposed among other things that recycling of scarce materials be retained as Community
priority for the coming five years. In this context the "Sub-committee CREST R&D raw materials" has examined the situa-tion in the Member States and concluded that an outline of Community R&D activities should take into account the findings of techno-econornic studies in this field. Among such studies one should cover the recycling of non-ferrous metals.
As outlined in the annex of the research contract underlying this study, the analysis should determine the recovery potential
of used materials, on the basis of the metal content of finis~cd
products, taking into account the present technology for recovery of old scrap.
ITE, Societe Generale des Minerais (SGM), Belgium, and Cerimet Italy, in joint efforts prepared a survey of recycling
technologies, consisting of three volumes in total. In addition
ITE developed a quantitative framework with respect to recy~ling
potentials of aluminium, lead, copper, tin and zinc. As for the material-flow-data for the German economy ITE based this analysis upon input/output-data provided bv Deutsches Institut
fUr Wirtschaftsforschung (DI~~), Berlin, and INFRATEST-INDUSTRIA,
The material flow, the assessment of the potential of old scrap and, finally, the identification of areas for R&D activities to increase the recycling of non-ferrous metals are subject of this fourth volume of the complete study. It should be noted, however, that this work employing input/output-tables for following the detailed material flowthrough the economy had the character of a pilot-study from the very beginning. In order to keep the efforts
1. Selection of non-ferrous metal containing products on the basis of input/output-tables
1.1. Preliminary remarks on the input/output-matrix
1.1.1. The relationship of an input/output-matrix
Each individual branch of an economy an economic sector
-is related to the other. The production of sector A - e.g. smelter production of copper - is needed for the production of sector C - e.g. the production of semi-finished goods made of brass. Besides, sector C may also have to procure products of sector B - e.g. smelter production of zinc. Such necessary procurements from sectors A and B for pro-duction in sector C are called intermediate inputs. Apart from procurement issues (as viewed by C) there are also supply aspects concerning A and B: this flow of goods will be called deliveries. However, neither is sector C only a receiver of intermediate products nor are sectors A and B exclusively delivering sectors: sector C delivers its
production (semi-finished brass ware) to the sectors D and E
{e.g. production of taps, cocks and valves). Yet, production
scrap arises in these sectors through manufacturing and is delivered back to A and B {copper smelter, zinc smelter), if
possible to C (industry of semi-finished goods). Again to the receiver this is intermediate input and to the sup-plying sectors deliveries (see Figure 1).
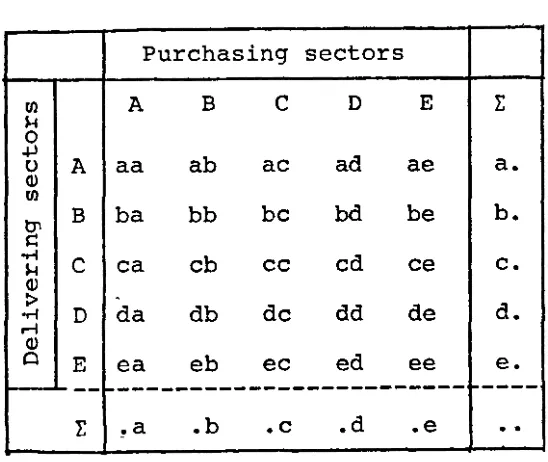
These mutual relationships between individual sectors of an economy - called intersectoral production relationship - are drawn up in a two-dimensional matrix in which all sectors are listed on the one hand as suppliers(by line) and on the
Figure 1 : INTERLOCKS OF DELIVERIES AND SUPPLIES BETNEEN FIVE PRODUCTION SECTORS
old scrap
imports of ores
and concentrates
~ -A refined copper
~~
,
fa
c
~
.
..
(J)
~
0.1ti
(J)~
-imports of ores
and cone tr a s te
,.,
refined zinc
It
r-...
lr-~
~
..
~ ~(J)
g
~
~
[image:15.569.74.528.175.757.2]~
...
0 ld
crap
s
D
Semi-finished brass products E
finished prooucts
A
=
a::>pper smelter B=
zinc smelter C=
brass-semis plantr
finished products
4
-Table 1 gives an example of such intersectoral production
relationships for five sectors.
Table 1: THE INTERMEDIATE PART OF
INPUT-OUTPUT-TABLES
Purchasing sectors
1:/l A B
c
D E I:~ 0 +l
ab ad
0 A a a ac ae a.
<Ll 1:/l
t1' B ba bb be bd be b.
s::
..-i
c
ea cb cc cd ce c.~ <Ll
>
"-~ D da db de dd de d.
...-I
<Ll
Q E ea eb ec ed ee e.
--
r---
----r
.a .b .c .d .e..
Apart from these intersectoral production relationships there are also so-called intrasectoral relationships. These are shown by the flow aa, bb, etc. (see Table 1). They refer to deliveries within a sector which may be
caused by spec~alization of individual companies (e.g.
a producer of semi-finished goods may deliver its manu-factured copper rods to another which processes them to wire) •
[image:16.578.103.377.271.502.2]intermediate demand, respectively; summed up ·column-wise (.a, .b, ••• ), the aggregates are called intersectoral or intermediate input.
This intermediate section of an input/output-matrix is most important. However, it must be supplemented because
- on the one hand, not all deliveries of a sector must necessarily be transferred to another manufacturing sector; moreover, they can also be demanded by domestic
and foreign consumers or investors1 and, thus, be turned
over to final use;
- on the other hand, not all intermediate products are pro-cured from other domestic manufacturing sectors, but can also be imported.
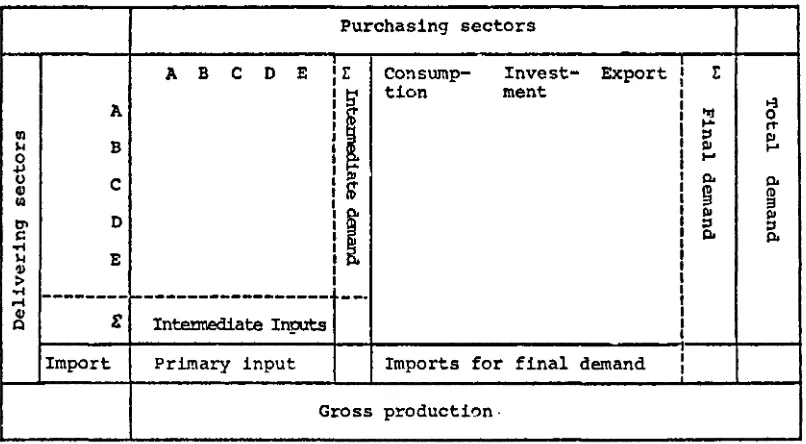
The matrix of input/output-relationships between individual sectors of an economy, as shown in Table 1, must therefore be supplemented by sectors which account for these aspects: consumption, investment and exports are added as receiving sectors. The lines of intermediate output must be supple-mented so as to include procurements from abroad (imports); in the view of the receiving sectors this is primary input.
The complete input/output-matrix is shown in Table 2. The entire raw material flow may be outlined as follows: the copper smelter A procures its raw materials partly from the foreign country M, and partly from domestic sources (e.g. new scrap from copper manufacturing industries) • The intermediate products leave the smelter as blister or refined copper and are delivered partly to further manufacturers(e.g. the pro-ducers of semi-finished goods), partly for export. Only the
former remains in the process of domestic manufacturing. The producers of semi-finished goods themselves process the
copper and deliver it to further domestic sectors, or export it. Now, the supplied sectors may produce locks and fittings, etc. Again, these are forwarded in part to intermediate de-mand of other sectors (e.g. mechanical engineering), but
also in part to final use (consumption, investment or exports). The flow is not completed as long as deliveries are made to further manufacturing sectors: it ends when deliveries are totally turned over to final demand.
TABLE 2: BASIC OUTLINE OF AN INPUT-OUTPUT-TABLE
Purchasing sectors
A B c D E r Con sump- Invest- Export ! r
I
tion ment ~A .... 'IJ 0 ,.,.
Ill ::I Ill
""
B Ill 1-'0 1-'
+l
0 c
~
0. 0.4l
m Cl)
Ill !3
D
[
Ill IllC'> ::s ::I
s:: 0. 0.
..-1
""
'11 E>
..-1
---... ~---
--·
41
s:
Intel'.lnediate In-plts
Q
Import Primary input Imports for final demand
Gross production .
. 1.1.2. The role of input-output tables within the study
In a raw ma ter·ial flow analysis completed for the Bundes-ministerium fur Wirtschaft (Federal Ministry of Economics) ,
the Deutsches Institut fur Wirtschaftsforschung (DIW) to-gether with INFRA'I'EST-INDUSTRIA drew up a comprehensive input/output-matrix for internal use. Employing the latest available input/output-table for F. R. Germany,a
[image:18.577.78.481.357.579.2]holds 278 production sectors, including those relevant for aluminium, copper, lead, zinc, and tin. Referring to the data given in this comprehensive matrix, the path of an initial output such as the production of a lead smelter may
be traced through the whole economy {e.g. from the lead-acid accumulator industry to the automobile industry and hence, to exports,investment or consumption).
For the original analysis of raw material flows mentioned above the availability of imported raw materials only was calculated in value terms. Thus, for the purpose of the CREST-study, it was necessary
- to transfo1n the value data of raw materials at disposal into quantities, and
to include both domectic primary and secondary material, apart from raw material imports.
The flow of raw materials, ·in quantities, was derived from the structural output data of each production sector using these materials. Although this procedure may result in some shortcomings in special cases, i. e. whenever sectoral output is inhomogeneous yet in spite of the underlying, highly
disaggregated input/output-table, the approach seems
acceptable in total. As for primary input from domestic sources it is aswell reflected in the sectoral output data as that. of imported metals: As soon as the material has entered the domestic supply system it is of no importance whether the metal originates from inland or from foreign sources.
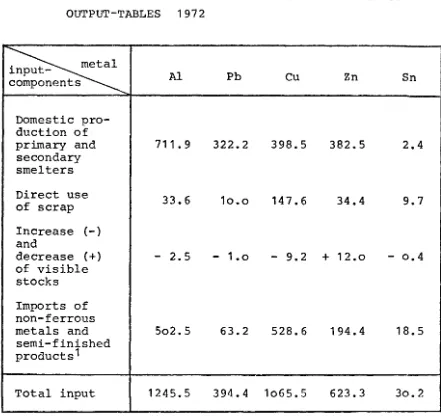
Table 3: CALCULATION OF THE PRIMARY INPUTS OF THE
INPUT-OUTPUT-TABLES 1972
~
s Al Pb Cu Zn SnDomestic pro-duction of
primary and 711.9 322.2 398.5 382.5 2.4
secondary smelters
Direct use
33.6 1o.o 147.6 34.4 9.7
of scrap
Increase (-)
and
decrease (+)
-
2.5-
1.o-
9.2 + 12 .o - o.4of visible stocks
Imports of non-ferrous
metals and 5o2.5 63.2 528.6 194.4 18.5
semi-finished products1
Total input 1245.5 394.4 1o65.5 623.3 3o.2
1 Excluding imports of new and old scrap, ores and concentrates,
which are included in the production figure
[image:20.579.84.525.111.528.2]imported finished goods, for instance the lead-content of imported lead-acid-accumulators. Apart from the flow of raw materials into final demand components (consumption, investment, exports), the metals may also be used as
auxiliary materials at various production stages or disappear from the economic cycle due to production losses. Lead, for example, is incorporated in lead-acid accumulators, and through deliveries of the accumulator-industry to the automobile
industry part of it shows up a metal-content of final demand for automobiles. However, lead is also used by the chemical industry as catalyzers, i. e. it is not processed directly into chemical products. This portion should therefore not be declared as the lead component of final demand for
chemical products, but rather as auxiliary materials
remaining within the chemical industry. DIW and INFRATEST-INDUSTRIA took account of this aspect when presenting their input/output-results.
Furthermore, the results given below were subject to
plausibility controls through joint efforts of the partici-pating institutes (ITE, INFRATEST-INDUSTRIA, DIW). In
some cases of greater discrepancies between the input/output-results the basic data were revised upon indication by cross-checks with partially available data of official statistics or information provided by associations. Because of pure
practical reasons, li~its of computation were set, as not
each and every little quantity of metal could be included in print-out of the flow pattern. By weighing the pros and
cons between clarity and accuracy a raw material was regarded as having been traced -through the whole of the
economy when at least 90 % of the original input had been
-
aluminium 95%,-
copper 96%,-
lead 93%,-
zinc 96%,-
tin 96%.Finally, further issues that could affect the "truth" of the raw material flow to final demand categories should be pointed out here.
One distortion of the raw material flow - yet negligible in view of the problem at stake - is already caused by the fact that minor metal quantities actually required
as auxiliary materials have been ascribed to the final demand components, sectors 57 to 61 of the matrix. Due to the difficulties in determining each relationship in which a certain input is employed partly or totally as an
aux-iliary material, a percentage of 0.3 was taken as minimum amount for following the flow. Sectoral deliveries or supplies, respectively, amounting to less than 0.3% of total raw material input have not been listed individually in the step by step scheme, but under the collective number 99999. Therefore, these deliveries or supplies could not be identified any closer and were continued to be treated as raw material quantities still within the economic cycle.
1.2. Examples of raw material flow
In this chapter, examples of input/output-relationships will be shown for several products elucidating at the
same time the possibilities of analytical assessment. While finished products and such which are mostly
de-livered to final demand are only suitable for showing the intermediate input relationship, intermediate products have also been chosen. They primarily allow to demonstrate the intersectoral output relationships. Apart from the intention to analyze both input and output patterns the examples have been chosen at random.
1.2.1. Aluminium
The use of aluminium is generally wide spread, dominated by few major fields. As regards finished products the automobile sector deserves special attention. Major alu-minium supplies to the sector are the foundries accounting
for about 50%. These include both primary and secondary aluminium which are processed into engine blocks, cylinder heads and many other small parts. Drop forgings such as pistons, connecting-rods and wheel rims, too, originate from this input sector. Furthermore, the producers of semi-finished goods play an important role as suppliers
for the motor car industry. In this case, major intermediate products are rolled products for body parts such as hoods or complete lorry bodies, and moulded and drawn articles such as profiles, rods, tubes, etc.
On the output side there is a definite concentration on
final demand of which roughly 50% are exports (see Table 4) .
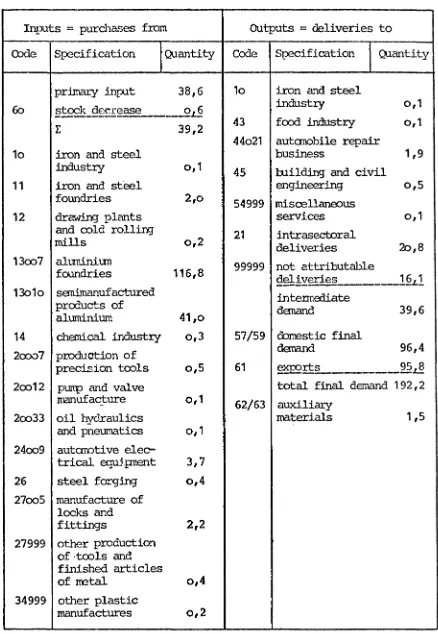
CAR INDUSTRY, 1972, in 1 <XX> t
Int:>Uts = purchases from OUtputs
=
cJeliveries too:xle Specification Quantity Code Specification (Uantity
primal:y input 38,6 1o iron and steel
6o §L~!:!-desf~~---2!.§ indust:ry o, 1
E 39,2 43 food industry o, 1
44o21 automobile repair
1o iron and steel business 1,9
industry o, 1
45 hlilding and civil
11 iron and steel engineering o,5
foundries 2,o
54999 miscellaneous
12 drawing plants services o, 1
and cold rolling
21 intrasectoral
mills o,2
deliveries 2o,8 13oo7 aluminium 99999 not attributable
foundries 116,8 deliveries 16 1
---L-13o1o semimanufactured intennediateproducts of demand 39,6
aluminium 41 ,o
14 chemical indust:cy o,3 57/59 cbmestic final
2oov7 production of deroand 96,4
precision tools o,5 61 ~rtL _______ 95_& 2oo12 ptmp and valve total final demand 1 92, 2
m:mufacture o, 1 62/63 auxiliary
2oo33 oil hycJraulics materials 1,5
and pneumatics o, 1 24oo9 autamti ve
elec-trical e.quipnent 3,7 26 steel forging o,4 27oo5 manufacture of
locks and
fittings 2,2
27999 other production of ·tools and finished articles
of rretal o,4 34999 other plastic
[image:24.575.75.513.129.763.2]Tahlc 4 continued
I
-·Inputs =' purr.h~c~s fro:n Outputs= deliveries to
f - - . - - -
---I
QuootityCode StJEd.fication Ccx:le Specification Quantity
f - - · - - -
·----
.45 :t.u i ldir~g and
ci-vil C.:.1Jh:ccrh:.g o,3
21 intrasectoral
pcrchCISes 2o,8
99999 rot
C'!ttrjbu-table purchases S,o
-~-...
---·----int(;DTle(liate
jnput 194,1
-total input 233,3 total output 233,3
Source: Calculations b?.sed. on the inrut-output-table of aJ.urninimn.
This sector produces its supplies almost exclusively from primary smelters; the output side, however, reveals the assumed multiform structure.
Building and civil engineering is the chief consumer accounting for 24% of intermediate demand. The products include sheets for front , roof , and wall-platings; but also profiles and
rods which are_processed into door and window-frames and
PIDDOCTION OF SEMJM\NUFAC'IURID GOCDS I 1972 I in 1 000 t
Inputs
=
purchases f.rom OUtputs=
deliveries toCode Specification !Quantity Code Specification
J
Quantityprimnry input 28ol2 13o13 zinc smelters o 18
---
---
19oo1 wagon making 31613oo9 aluminium 2o rrcchanical en-srrelters 384,2 gineerinj
512
21 motorcar industry 41 1o 24oo7
tele-camruni-cation equip-rent 321o
24oo8 autanatic data-processing
EqUip-m=nt 18 1o
24oo9 autarotive electri-cal equiprent 519
24o1o radio 1television and grarrophone
:manufacture 614 24o19 pro:luction of
transfonrers 119 24o2o aluminium products
for· .electrical use 44,6 2Soo3 rranufacture of
optical
instru-ments 1218
25999 other precesion engineering and
optical industry o 15 27oo5 manufacture of
locks and fittings 6,9 27oo9 production of
alu-minium foils 1
strips and cans 6112 27o1o production of
tu-bular fumiture
and equipnent 1116 27o23 production of
tinplate packa:;ing 3113 44o21 autarobile repair
Table 5 continued
Inputs =' purchases from Outputs ~ deliveries to
Code Specification
I
Quantity Code Specification JQua.."Jtity-44o27 ro2.nufacture of tools and finished
articles of metal 4,4
45 building and
ci-vil E-ngineering 116,9
99999 not attributable
f!cl!Y!.'.:Eies _______ §.QL~-intenrE>diate
danand 487,o
61 exports 177,4
---·-total j11put 664,4 total output 664,4
Source: Se2 table 4 •
Since semi-finished aluminium goods are just intermediate products the only final demand component is exports.
How-ever, accounting for 26.7% of total output, their
signifi-cance should not be underesti~ated.
1.2.2. Lead
The use of lead is not so widely spread as in the case of aluminium. In broad terms, this implies that the
Table 6: STP.UC'IURE OF ll-lPUTS AND OUTPUTS OF LEAD FOR DUIIDINC /J.ND
CIVIL ENGJNECRING. 1972, in 1 000 t
Inputs
=
purchases from Outputs=
deliveries toCode Specification
j
Quantity Cbde Specification !Quantitypr.imary input o,8 45 intrasectoral
---
deliveries o,813o18 s~~ufactured 99999 not attributable
products of lead 17,9 de1!~ri~~---_bl
13o19 lead foundries 6,2 intennediate
14.oo2 paints and danand 3,1
lacquers industry 1,5
57/59 domestic final
15 mineral oil danand 25,6
processing o, 1
61 ~~~---2L~
2oo15 machines for civil total final danand 25,8
engineering o,4
2oo23 lifting, handling 62/63 auxiliary materials 2,7
and haulage
equipnent· o,2
2oo3o production of taps, oocks, and
valves o, 1
21 notorcar
in-dustry o,2
24o17 oopper cables and other products
for electrical use o,4
24o23 acctnnUlator
industry o,6
29 glass industry o,5
45 intrasectoral
purchases o,8
99999 not attributable
Pl!fha:z~--. _ _ _
1L2
intennediate input 3o,8
total inp.lt 31,6 total outr:ut 31,6
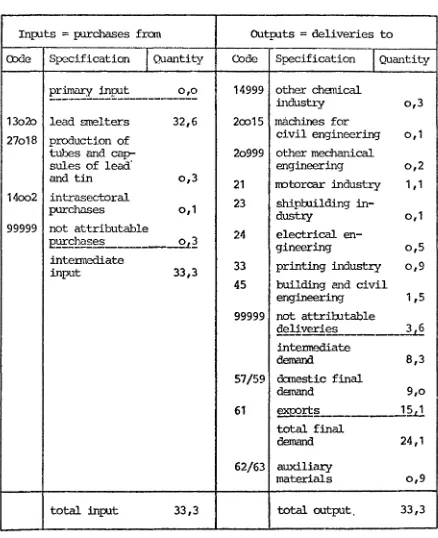
Table 7: S'ffiU:'IURE OF TI!PUTS At ID aiTPUTS OF ID\0 FOR PATin'S AND Il\CCUERS ; 1972, in 1 ooo t
Inp..1ts = purchases fran Outputs
=
deliveries toCbde Specification
j
Quantity Code SpecificationI
Quantityprimary input o,o 14999 other chEmical
---
i.ndusb:y o,313o2o lead smelters 32,6 2oo15 machines for
27o18 production of civil engineering o,1
tubes and cap- 2o999 other mechanical
sules of lead· engineering o,2
and tin o,3
21 notorcar industry 1 11
14oo2 intrasectoral 23 shipbuilding
in-purchases o, 1
dustry o, 1
99999 not attributable
24 electrical
en-E~fb~2~---2L2 gineering o,5
intennediate
33 printing industry o,9
input 33,3
45 building and civil
engineering 1,5
99999 not attribltable
9-el!veri~----~
intennediate
demand 8,3
57/59 danestic final
demand 9,o
61 ~rt2 ______
_12.t.!
total finaldemand 24,1
62/63 auxiliru:y
materials o,9
total input 33,3 total output. 33,3
[image:29.574.92.530.120.658.2]heterogeneous, i.e. that uses lead in most diverse forms, shall be chosen: building and civil engineering.
One outstanding feature is the dominance of semi-finished
lead consumption accounting for 56.7% of total input. These include mainly sheets, belts, strips and foils which are
used for architectural purposes, partly for roofs, partly
for chimney and bay-window-frames. Less important is the
input of lead castings (19.6% of input). The remaining 23.7% of intermediate input are shared by nine other suppliers
(see Table 6) •
Paints and lacquers as a second example belong to a commodity group with a relatively wide-spread delivery pattern. The main intermediate consumers of paints and lacquers are the
motor car and the building and civil engineering sectors. The remaining deliveries are distributed quite evenly (see Table 7).
1.2.3. Copper
The use of copper is still more widely scattered than that of aluminium. Therefore, the input pattern - e.g. of the
machine-tool industry - includes not only supplies of
primary products from the first production stage, but also a number of intermediate products or even finished goods which are used as components (see Table 8). Each inter-mediate product plays a subordinate role - apart from products for electrical use.
'l'able 8: S'l'RUC'Iffi~ OF ThTI?Urf~ 1'1::0 OUTPUTS OF COPPER FOR .r-1?\.CHINE-'l'COL
INDUS'ffi.Y, 197~, in 1 ooo t
Inputs = purchases from Outputs
=
deli verics toCOde SJ:.---.ecification !Quantity Code Sp:~cificati.on j Quantity
~---r---+---~---12
primaty input 5,3
dra\'ring plants and oold rolling
mills o, 1
13oo5 senimanufactured
products of copper 3,1
13oo6 CXJppo...r foundries 2, 5
2oo3o pro:1uction of taps,
rocks,and valves o,2
2oo31 tranf~ssion
engineering o,1
2oo33 oil hydraulics and
pneunatics o,1
2o999 other mechanical
engineering o, 1
24o18 electric motors
and generators 011
24o19 production of
transformers o 11
24o3o copper pro-Jucts for
electrical use 019
24999 other electrical
engi.necring o 12
26cx:>1 manufacture of
wn-ferrous scre\-JS o1 1 26999 other steel forging o,1
27oo8 manufacture of
cu-priferous sundries o 1 1
99999 not at:tributable
P.~b~;~~---1-L~
intenncdiate input 8 ,8
total ·input 1411
99999
59
61
not CJ.ttributable
9~!.:iY~t~~---l.l.~ intcrm0diat.e
danand 1,4
gross fixed capital
formation 6,2
a'fX)rts 6 5
_ _ _ _ _ _ _ _ _ _ _ _ _ _ _ .£_
total final
demand 1217
total output 1411
'!able 9: S'.IRUC'lURE OF lllPUTS AND OOTPUTS CF COPPER FOR PRODU:::TS
FOR EI..B:TRICAL USE, 1972, in 1 ooo t
Inputs
=
purchases from Outputs=
deliveries toCode Specification jQuantity Code Specification
j
Quantitypri.mal:y input 29511 2 electricity 1,6
.
6o stock decrease o 1
---L--
1o iron and steel1: 29512 industcy 1 13
13oo6 copper foundries o, 1 12 drawing plants and
14 chanical industry 1 ,6 cold rolling mills 011
13oo5 sem:i.manufactured 2ooo1 machine-tool
products of ropper 22,8 industcy 0 19 13oo6 copper foundries o,2 2oo15 machines for civil engineering
1 11 13oo8 ooppcr srrelters 1819 2oo23 lifting 1 ha11dling
24oo7 tele-oammunication and haulage
equiprent o12 equiprent o,7
24o11 electrical heating 2co31 transmission
equiprrent o, 1 engineering 117
24o13 electrical refrige- 21 notorcar industry 1112 rator and washing
23 shipbuilding in-madline
manufac-dustry 215
ture 011
24o15 production of lCM- 24oo7 tele-a:mnunication equiprent 617 volta:je
switch-gears 011 24oo9 autanotive
electri-24o18 electric rrotors cal equipnent 3,o and generators o19 24o1o radio,television,
24o19 production of and grarophone
transfonrers o 17 manufacture 316 24999 other electrical 24o11 electrical heating
engineering o12 equipnent 219
26oo1 manufacture of 24o12 household electrical applianre manu-non-ferrous screws o, 1
facture 1 11
24o17/ intrasectoral 24o13 electrical refrige-24o3o purchases 21,o rator and washing
99999 not attributable machine manufacture 2,8
2:!ffh~~---2-L2
24o14 production ofTable 9 continued
Inputs = purchases from Outputs
=
deli~~ries toCode Specification
f
Quantity Cbde SpecificationI
Quantity24o15 prcxluction of low-voltage
switchgears 1,5
24o16 producticn of
in-stallation
equip-ment 1,9
24o18 electric notors
and gererators 7,4
24o19 production of
transfomers 5,8
24999 other electrical
engineering 7,7
25 precision
enginee-ring and optical
industry 1,2
26oo1 manufacbl:re of
non-ferroos screws o, 1
26999 t'other steel forging o,9
45 building and civil
engmeering 6,2
24o17/ intrasect.oral
24o3o deliveries 21,o
99999 oot attributable
-9~livcries _ _ _ .]~~
intenrediate
outp.It 13o,5
57/59 d::mestic final
demand 183,6
61 ~rt~ _ _ _ _ _!5t 7 total final
demand 229,3.
62/63 auxiliary materials 1,7
total input 361,5 total outp.lt 361,5
The manufacturing of products for electrical use, such as cables, etc. belongs to a sector which bears interesting features both on the input side and especially on the
output side (see Table 9). On principle, two different kinds of material input may be distinguished: On the one hand
products of the first production stage, and on the other
direct use of scrap (new scrap) for i~stance from cable
processors. On the output side the deliveries of this sector are widely scattered to other producing sectors. Among others they comprise redeliveries to preceding production stages such as foundries.
1.2.4. Zinc
Similar to lead, the production relationships of zinc are quite limited. Deliveries from the smelter to final demand are comparatively direct. Exceptions are the building and
civil engineering sector as well as the galvanized steel sheet industry.
The main suppliers of'the building and civil engineering sec-tor are the custom galvanizers accounting for 31.2% of inter-mediate input (see Table 10). They galvanize windows, doors,
and door frames as well as bridge construction elements or drainage systems. Custom galvanizers are called upon
especially for components which are not standardized but made to order.
Regarding the delivery flows the galvanized steel sheet sec-tor is particularly interesting (see Table 11) • Whereas the
input pattern is ruled by the supplies from smelters, the structure of the successive production stages reveals the manifold use of this intermediate product: The major
'!able 1o : STROC"'URE <F INPUTS AND OUTPUTS OF ZD\C FOR IDIIDTh!G
AND CIVIL ENGINEERIN3, 1972, in 1 ooo t
Inputs
=
purchases from OUtputs=
deliveries toCOde Specification
I
Quantity Cbc1e SpecificationI
Quantityl?!~_!n-E:!L __ _&~ 21999 other notorcar
indust:ry o,3 1ooo1 galvanizing steel 1o,4
53 flat:--letting
1ooo2 galvanizing seam- rosiness 4,o
less steel tubes o,9
54999 miscellaneous
1o999 other iron and services o,3
steel industry o,9
45 intrasectoral
12oo1 manufacture of deliveries 4,1
welding electrcx:les 1,6
99999 not attributable
12002 production of hot 2~liveri~ _ _ _ _
£d
galvanized steel intermediatewire 2,3
deirand 15,1
13oo5 sem:im:mufactured
products of oopper 1,1 57/59 darestic final
13co6 oopper foundries 1,1 demand 112,3 13o14 zinc foundries o,5 61 ~s ---~-0 7
13o15 sem:im:mufactured total final derrand 113 ,o prcxlucts of zinc 24,2
62/63 au.xiliazy materials 13,8 14oo2 paints and laa:ruers
irrlustry o,5 14999 other chenical
industry o,2
19oo3 architectural
oonstruction 6,1 19999 other steel
oonstruction o,3 2oo3o production of taps,
oocks,and valves o,2 24o16 production of
in-stallation
equip-ment o,4
24o25 prcxluction of
primary batteries o,2 26001 manufacture of
Inputs
=
purchases fr:an Outputs= deliveries toCode Specification
I
Quantity Code SpecificationI
Quantity27oo4 manufacture of non-ferrous tools and articles for households,agri-culture,and small
trade o,2
27oo8 manufacture of rupriferous
sun-dries o, 1
27o16 production of construction
ele-]'fents of steel
sheet 3,9
27o17 manufacture of steel tube and
sheet products 6,6 27o22 custan galvanizing 34,5 27999 other production
of tools and fi-nished articles
of metal o, 1 44o13 non-ferrous rretal
production and non-ferrous rnetal
foundries o, 1 44o19 steel and light
metal construction o,9 45 intrasectoral.
p..rrchases 4,1 99999 not attributable
E~ch~~--- 9.J.
inte.J:Irediate .inplt 11o, 7
total inplt 141,9 total ot.tp.1t 141,9
Table 11 : STROC'IURE OF INPUTS NID OOTPUTS OF
zrnc
FOR G\LVANIZEDS'lEEL SHEEr, 1972 I in 1 000 t
Inputs
=
purchases fran Outputs=
deliveries toCode Specification
j
Quantity Code SpecificationI
QuantityE!fl.!}~_inEu!;; _ _
_11.d
1o iron and steelindust:ry o16
13o13 zinc smelters 14 1o
12oo2 production of hot galvanized steel
wire o13
14 cha:nical industry o 18 19oo2 production of
containers o15
19oo3 architectural
con-struction 1 11 19999 other steel
con-structicn o,2 2o mechanical
enginee-ring 011
21 motorcar industry o16
24 electrical
enginee-ring o, 1
27o11 ash cans and dust
bins o13
27o15 production of steel cx:ntainers 117 27o16 production of
o:>n-struction ele:nents
of steel sheet 212
27o17 mining machineJ:y 115 27999 other pn:xluction
of tools and finished articles of metal o13
45 building and cl vil
engineering 1o14
99999 not attrib.ltable
d~iv~ries ________ 516_
intennediate demand 26 13
61 exports 34 1o
material losses 1 '1
total input 61,4 total outplt 6114
SOIDERS, 1972, in 1 <XX> l:
-Inputs ~ purchases fl."''OU Outputs = cJeli veries to
---Code Specificz.tt:ion
j
Quantity CCYJe Specificationj
QuantityEE~~!L:i~~t_ ___ _1L2 2oo19 rnad1ines for fcxx1
indust:ry o, 1 13:>23 seniitunufactured 2oo2o manufacture of
products of tin 1,8
tedmical apparatus o,5 2o999 other Jnedhanical
engineering o,2 21 mJtorcar li1dustry 1,4
·23 shipbuilding industry o, 3
24oo7 tele-cOMmunication
equiprrent o,5 24oo8 automatic
data-pro-cessing equipnents o,7 24o12 household electrical
appliance
manufac-ture o, 1
24ol3, electrical refrige-rator and \-lashing
mashine I!'.anufacture o,l '24o16 p1.-oduction of
in-stallation
equip-ment o, 1
249991
oth~r
eJ.<;ctricalC::.ngme.ermg o,3 27999 other ptuduction
of tools and fj,nished articles of J:t"etal o,2 99999 not.attributable
deliveries o,3
total in:p.tt 4,7 total output 4,7
additional indirect supplies of galvanized steel sheets. Though it is, in general, very difficult to d~termine the
indirect delivery relationship i t is in this case plain to see that construction elements of galvanized steel sheet are passed further on to the building and civil engineering sector. The same applies to the deliveries of galvanized steel sheet to the producers of steel architec-tural constructions which furnish the building and civil
'
engineering sector with 97%.
1.2.5. Tin
As for tin it can be stated that the distance from the smel-ter to final demand is usually very short. Accordingly the interrelationships shown by the input/output-table are rela-tively simple. One example for more detailed output-relation-ship is solder (see Table 12).
1.3. Selection of non-ferrous-metal containing products
This section of the study deals with the application of the input/output-table concerning the quantities of metal in the products to be delivered to final demand. These products need not necessarily be finished products, as exports form one component of final demand. Thus, intermediate products such as semi-finished goods of copper or lead become final demand as far as they are exported. As these products are of less interest to the question in point, they are mentioned only briefly in the following and are shown as aggregates in the tables.
demand categories but will occasionally go back to inter-mediate products.
In some cases, in which reliable information regarding the metal content of products are available from other sources, this information has been employed in addition to the results of the input/output-tables.
It cannot be the objective of the study to deal with each and every non-ferrous-metal-containing product. The limit for including a product or product group into the analysis refers to the deliveries of individual sectors to final demand. In addition auxiliary materials,which are necessary for production but do not become part of the product, are indicated.
1.3.1. Aluminium
The limit for including aluminium containing products was set at a minimum output of 5,000 t. Thus, 24 product groups were covered. In order to show the main areas of
application not only product groups but also industries were included into the analysis, i.e. the chemical industry as over-all industry comprising producers for example of paints and lacquers. In this way 86,5% of the total aluminium flow will be covered. For the further investigation, however, 23% may
~e neglected as it concerns exports of intermediate products. Thus almost 51% of the metal flow is finally covered on the product or sector level.
sector of aluminium application is the building industry
where almost 11% of the total aluminium consumption is
re-quired. In architectural construction aluminium is employed
for roofs, wainscots as well as for inner fittings such as
banisters, shelves, sliding and folding doors. Technical
installations for heating or air conditioning should also
be mentioned.
The use of aluminium fqr cables and other conducting
material accounts for 3.6% of the total metal input.
Be-cause of its light weight aluminium is substituted for cop?er
in the case of overhead lines. In mechanical engineering,
communications, automatic data processing and in the
manu-facture of photographical and optical instruments, aluminium
is used mainly for casing.
The importance of aluminium as packaging material can only
indirectly be seen from Table 13 because i t refers to final
demand categories. Packaging material is not only included
in the quantities given for foils, strips and cans, but also
in the figures for food industry, manufacture of tools ar.d.
articles for household, agriculture and small trade as well
as for chemical industry, i.e. for instance for packaging of
cosmetics and soap.
A total of over 30,000 t of aluminium is used as auxiliary
material. However, this must not necessarily be seen as being
lost for recycling. For example, 3,500 t of aluminium js used
for defoaming reagents in the production of detergents. During
the process metallic aluminium is converted to aluminium
hydro-xide from which alumina can be obtained for reuse in the
alu-minium smelter.
In steel construction, on the contrary, aluminium is used for
welding. The quantities in this and similar ways are to be
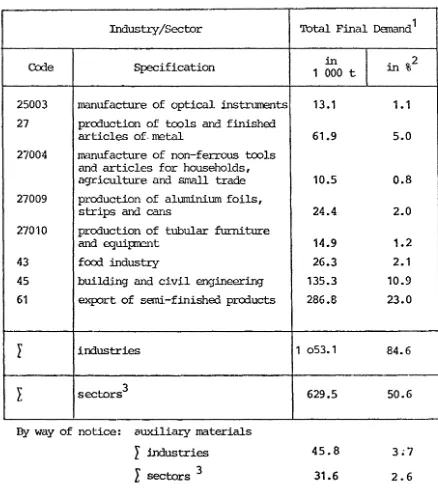
Table 13: Ml\IN ITEMS OF FINAL USE OF ALUHINIUM, 1972
Industry/Sector Total Final Demand 1
Ccxl.e SJ?eCification 1 000 t in m . 2,2 o
14 chemical industry 24.5 2.0
14008 cosmetics and soap industry 4.4 0.4
19 steel construction 13.7 1.1
19001 wagon nBking 5.8 0.5
20 mechanical engineering 118.6 9.5 20001 machine-tool industry 9.6 0.8 20013 air conditioning and drying
equipnent 7.8 0.6
20014 industrial freezing equipment 5.1 0.4 20015 machines for civil engineering 7.0 0.6 20018 agricultural machiilery and tractors 9.5 0.8 20019 machines for fcx:x:l industry 9.2 0.7 20023 lifting, handling and haulage
equi.pne..'1t 5.0 0.4
20025 textile m~chines 6.4 0.5
20034 office machinery 6.4 0.5
21/44021 :rrotorcar industry and repair
business 202.4 15.7
23 shipbuilding industry 10.7 0.9
24 electrical engineering 155.4 12.5 24007 tele-c..'CY.llTIUnication equiprent 36.6 2.9 24008 automatic data-processing
equipnc-..nt 23.0 1.8
24010 radio, television and granophonc
mmufacture 9.2 0.7
24019 production of transfonners 8.7 0.7 24020 aluminium products for electrical
use 45.1 3.6
25 pre-cision engineering cm1 optical
Table 13 continued:
Industry/Sector Total Final DEmand 1
COde Specification
25003 manufacture of optical instruments
27 proouction of tools and finished
articles of. metal
27004 manufacture of non-ferrous tools
and articles for households, agriculture and small trade
27009 proouction of aluminium foils,
strips and cans
27010 proouction of tubular furniture
and equiprent
43 focrl. industry
45 building and civil engineering
61 export of semi -finished prooucts
l
industriest
sectors3By way of notice: auxiliary materials
l
industriesr
sectors 3in 1 000
13.1
61.9
10.5
24.4
14.9
26.3
135.3
286.8
1 o53.1
629.5
45.8
31.6
1 - Excluded auxiliary materials an~ :na.terial losses. 2 - Part of total input.
3 - Excluded export of semi-finished products.
t in %2
1.1
5.0
0.8
2.0
1.2
2.1
10.9
23.0
84.6
50.6
3;7
2.6
[image:43.579.94.532.163.659.2]1.3.2. Lead
In contrast to aluminium the limit for including lead
containing products was not only absolutely but also relatively
reduced to 1,000 t or 0.25% of total input. This is because of
lead uses concentrating on fewer products. 80% of the lead
flow was covered. The export of intermediate products, which
are irrelevant to the further analysis, reduces this figure by almost 15%.
The most important users of lead are electrical engineering (25.9%) and the motor car industry (13.9%) (see Table 14). For both the same product group is relevant: accumulators. The 9.6% of total final demand shown for this subsector of
electrical engineering reflects only the replacement quantities while the 13.9% of the motor car industry include all batteries
for first equipment of new cars. Seen from the input side of the motor car industry over_80% of the lead consumption of this sector is in the form of accumulators.
Other applications of lead that should be mentioned are the lead-containing bearings in mechanical engineering, lead casings in nuclear power stations for protection against
radioactivity, as well as cable sheathings and solder. Further-more, the printing and copying industry needs lead, however, here it is used mainly as auxiliary material (typemetal) .
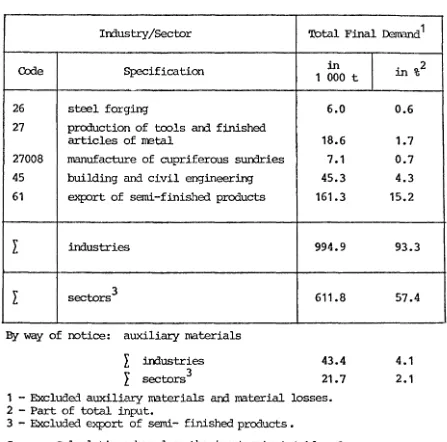
1.3.3. Copper
Table 14: MAIN ITEMS OF FINAL USE OF LEAD, 1972
Industry/Sector Total Final Demarrl1
Code Specification
14 chemical industry
14002 paints and lacquers industry
15 mineral oil processing
20 mechanical engineering
20015 machines for civil engineering
20020 nanufacture of apparatus
20023 lifting, handling and haulage
equiprrent
20031 transmission engineering
20035 nuclear reactor equiprrent
21 rrotorcar industry
23 shipbuilding industry
24 electrical engineering
24007 tele-communication equipment
24008 autornatic data-processing equiprrent
24017 oopper cables and other products for electrical use
24019 production of transform::rrs
24020 aluminium products for electrical use
24023 accumulator industry
24024 production of X-ray equiprnents
33 printing industry
45 building and civil engineering
61 exp:>rt of semi-finished products
I
irrlustriesI
sectors3By way of notice: auxiliary materials
I
industriesL
sectors3in
1 000 t
3o.2 24.1 5.2 35.9 4.4 11.9 4~6 1.0 6.7 54.9 2.8 102.1 0.5 0.2 45.5 0.9 8.7 37.7 4.5 0.4 25.8 57.6 315.1 239.8 28.6 23.2
1 - Excluded auxiliary materials arrl material losses. 2 - Part of total input.
3 - Excluded ex{X>rt of semi-finished products.
Source: Calculations based on the input-output-table of lead. in %2
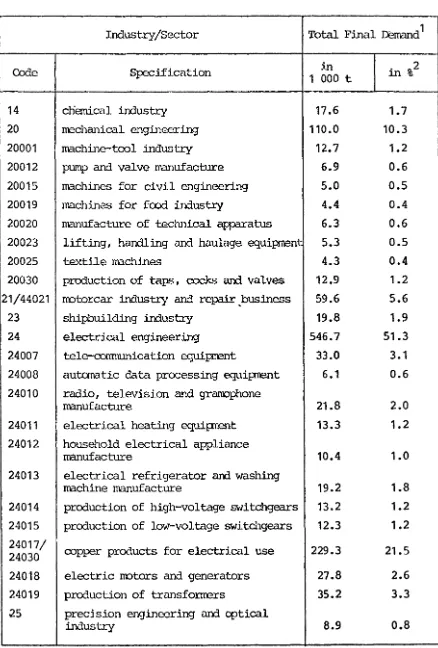
Table 15: MAIN ITEMS OF FINAL USE OF COPPER, 1972
Industry/Sector Total F.inal Deit\r:md 1
Ccxle Specification 1 000 in t m . 9,2 o
14 chEmical industry 17.6 1.7
20 mechanical engineering 110.0 10.3
20001 mach.ine-tool industry 12.7 1.2
20012 pump and valve manufacture 6.9 0.6
20015 machines for civil eng.ineering 5.0 0.5
20019 mach.ines for food industry 4.4 0.4
20020 manufacture of technical apparatus 6.3 0.6
20023 lifting, handl.ing and haulage equipm;mt 5.3 0.5
20025 textile machines 4.3 0.4
20030 production of taps, cocks and valves 12.9 1.2
21/44021 ITOtorcar industry and repair _bus.iness 59.6 5.6
23 shipbuild.ing industry 19.8 1.9
24 electrical engineering 546.7 51.3
24007 tele-communication equipment 33.0 3.1
24008 automatic data processing equi:prent 6.1 0.6
24010 radio, television and granophone
manufacture 21.8 2.0
24011 electrical heat.ing equiprent 13.3 1.2
24012 household electrical appliance
manufacture 10.4 1.0
24013 electrical refrigerator arrl washing
machine manufacture 19.2 1.8
24014 production of high-voltage switchgears 13.2 1.2
24015 production of lov7-vol tage swi tchgears 12.3 1.2
24017/
oopper products for electrical use 229.3 21.5
24030
24018 electric motors and generators 27.8 2.6
24019 production of trnnsfonrers 35.2 3.3
25 precjsion engineering and optical
[image:46.577.77.515.130.778.2]Table 15 continued:
Irrlustry/Sector Total Final Dem:md 1
Code Specification
26 steel forging
27 production of tools and finished
articles of rretal
27008 m:mufacture of cupriferous sundries
45 building and civil engineering
61 extOrt of semi -finished products
>: industries
>: sectors 3
By way of notice: auxiliary materials
}: irrlustries
l
sectors3in 1 000 t
6.0
18.6 7.1 45.3 161.3
994.9
611.8
43.4 21.7
1 - Excluded auxiliary materials and material losses.
2 - Part of total input.
3 - Excluded export of semi- finished products •
Source: Calculations based on the input-output-table of coppei:.
in %2
0.6
1.7 0.7 4.3 15.2
93.3
57.4
4.1 2.1
Copper is primarily used in electrical engineering for the production of conducting material. However, this is not yet
reflected by the 230,000 t which are mentioned in Table 15
[image:47.576.92.539.143.585.2]Conducting material, however, is not the only copper application in electrical engineering. Other items are cans, brackets, switchgear parts, switch covers, contact
springs, etc. of copper, brass or other copper alloys. Along with gear wheels, bearings, pump and valve bodies main copper and copper alloy applications in mechanical engineering are tubings for lubricants, radiators and oil coolers, etc.
In the production of motor cars about 60,000 t of copper were used. Main components here are radiators, heating installations, bearings, ignition system, starter,
distrib-utors and wire assemblies. A rather small portion of total copper input in finished products is attributable to building
and civil engineering (4.3%) and presumably has been under-estimated in the system. Copper is required in this sector mainly unalloyed for heating and aeration installations, sanitary equipment and water pipes, as well as for roofing or for gutters, waste pipes, locks, fittings and, last but not least for conducting material.
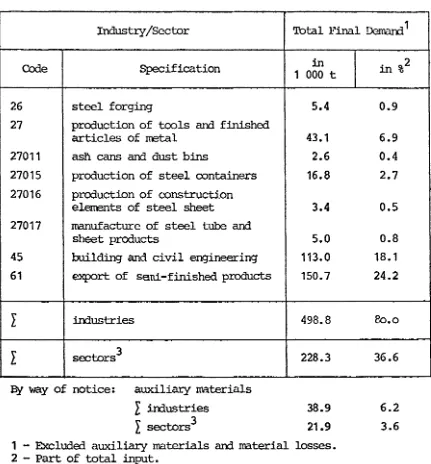
1.3.4. Zinc
The limit for including zinc-containing products into the
analysis was set at 2,000 tor 0.32% of the total zinc input. This covers roughly 30 sectors accounting for only 36.6%
of the total input (see Table 16). Relating the limit to the overall industrylevel a coverage quota of 80,0% can be achieved. However, of this 24.2% is employed for the export of intermediate products which are of no further interest
here.
The most important user of zinc-containing products is
Table 16: MAIN ITEMS OF FINAL USES OF ZINC, 1972
-·
Indust:cy/Sector Total Final D21"'!la.l1d 1
Cede Specification in in %2
1 000 t
-14 chemical industry 27.4 4.4
14002 paints and lacquers industry 2.1 0.3
16002 rubber industry 0.4 0.1
19/44019 steel and light metal construction 35.9 5.8 19002 pro:luction of containers 3.1 0.5 19003 architectural construction 2.0 0.3 20 mechanical engineerjng 36.4 5.8 20001 machine-tool industry 5.0 0.8 20012 purrp and valve manufacture 2.1 0.3 20013 air conditioning arrl d:cyirig
equipnent 2.4 0.4
20018 agricultural rra.chinery and tractors 2.3 0.4 20023 lifting, handling and haulage
equi:;:ment 2.0 0.3
20025 textile machines 2.5 0.4
21 notorcar industry 38.5 6.2
23 shipbuilding industry 6.6 1.1
24 electrical en-Jineering 38.6 6.2 24007 tele-ccmnunication equi:pnent 3.2 0.5 24010 radio, television and gramophone
manufacture 4.1 0.7
24013 electrical refrigerator und
w<t.Shing mc..•cldne manufacture 2.7 0.4 24017 .:::opp2r cables and other prcx::lucts
for electrical use 5.1 0.8
24025 production of prliQ~ batteries 7.5 1.2
25 precision engineering arrl optical