White Rose Research Online
eprints@whiterose.ac.uk
Universities of Leeds, Sheffield and York
http://eprints.whiterose.ac.uk/
This is the published version of an article in the
Journal of Climate, 26 (10)
White Rose Research Online URL for this paper:
http://eprints.whiterose.ac.uk/id/eprint/76585
Published article:
Knippertz, P, Wernli, H and Gläser, G (2013)
A global climatology of tropical
moisture exports.
Journal of Climate, 26 (10). 3031 - 3045. ISSN 0894-8755
A Global Climatology of Tropical Moisture Exports
PETERKNIPPERTZ
School of Earth and Environment, University of Leeds, Leeds, United Kingdom
HEINIWERNLI
Institute for Atmosphere and Climate Science, ETH Zurich, Zurich, Switzerland€ GREGORGLA¨ SER
Institute for Atmospheric Physics, Johannes Gutenberg University Mainz, Mainz, Germany
(Manuscript received 2 July 2012, in final form 8 October 2012)
ABSTRACT
In a recent paper, a climatology of tropical moisture exports (TMEs) to the Northern Hemisphere (NH) was constructed on the basis of 7-day forward trajectories, started daily from the tropical lower troposphere, which were required to reach a water vapor flux of at least 100 g kg21m s21somewhere north of 358N. It was
shown that TMEs contribute significantly to regional precipitation. Here, the authors complement and extend this work by (i) using 6-hourly European Centre for Medium-Range Weather Forecasts (ECMWF) Interim Re-Analysis Interim) data from 1979 to 2010 instead of the earlier 40-yr ECMWF Re-Analysis (ERA-40), (ii) extending the climatology to the Southern Hemisphere (SH), and (iii) relating TME events to at-mospheric rivers (ARs) previously discussed in the literature. The main conclusions are as follows: First, the TME climatology is not sensitive to the reanalysis dataset. Second, SH TME shows four activity centers: the central and eastern Pacific Ocean (1708–908W, near the South Pacific convergence zone), eastern South America and the adjacent Atlantic Ocean (608W–08, near the South Atlantic convergence zone), the western Indian Ocean (308–808E), and western Australia (1108–1408E). Third, TME activity in the SH peaks in austral summer because of higher moisture contents and possibly because of increased Rossby wave activity from the NH. Fourth, El Nin˜o warm events are associated with reduced activity over the South Pacific and increased activity over the South Atlantic and around Australia, while correlations with the southern annular mode are generally weak. Finally, around 90% of all ARs affecting the U.S. West Coast during December–May are connected to TME events, revealing their importance for heavy rain and flooding.
1. Introduction
The poleward transport of warm and moist air masses from low latitudes is an important part of the general circulation of the atmosphere and the global energy and water budgets. Recently, Newman et al. (2012) showed that low-frequency eddies (synoptic-scale disturbances) dominate meridional moisture flux at lower latitudes (midlatitudes), while transports with the mean circu-lation tend to be more zonal. Often the meridional transport occurs in the form of localized filaments of high
water vapor flux within the warm sector of extratropical cyclones or ahead of upper-level troughs. A number of different approaches and definitions have been proposed to categorize such events and compile climatologies, including satellite-derived column water vapor (Bao et al. 2006; Neiman et al. 2008), trajectories (Knippertz and Martin 2007; Roberge et al. 2009; Knippertz and Wernli 2010, hereafter KW10), or a Lagrangian particle dispersion model (Stohl et al. 2008). Recent years have seen an increasing number of publications using the term ‘‘atmospheric river’’ (AR; e.g., Ralph et al. 2004, 2005; Neiman et al. 2008; Jankov et al. 2009; Leung and Qian 2009; Smith et al. 2010; Lavers et al. 2011; Neiman et al. 2011; Ralph et al. 2011; Moore et al. 2012), which goes back to the work by Newell in the 1990s (e.g., Newell et al. 1992; Zhu and Newell 1998). A widely used Corresponding author address:Peter Knippertz, School of Earth
and Environment, University of Leeds, Leeds LS2 9JT, United Kingdom.
E-mail: p.knippertz@leeds.ac.uk
DOI: 10.1175/JCLI-D-12-00401.1
definition for ARs is that of narrow plumes in Special Sensor Microwave Imager (SSM/I) integrated water vapor (IWV) with values of at least 2 cm that are at least 2000 km long and not more than 1000 km wide (Ralph et al. 2004; Neiman et al. 2008). This definition does not necessarily imply a tropical source of the moisture, but many studies have shown that this is frequently the case (Neiman et al. 2008; Jankov et al. 2009).
The moisture source aspect was stressed in a recent climatology of tropical moisture exports (TMEs) into the Northern Hemisphere (NH) by KW10. Their study was based on extensive trajectory calculations for the 23-yr period 1979–2001 using 40-yr European Centre for Medium-Range Weather Forecasts (ECMWF) Re-Analysis (ERA-40) data (Uppala et al. 2005). KW10 found four active regions with different sea-sonal cycles (see also Fig. 4, described in greater detail below):
(i) The ‘‘pineapple express’’ (PE) connects tropical moisture sources near Hawaii with precipitation near the North American west coast. It is largely confined to boreal winter.
(ii) The west Pacific maximum (WP) during the warm half of the year contributes significantly to the global annual TME and is linked to the East Asian monsoon and the Meiyu-Baiu front.
(iii) The narrow TME maximum over the Great Plains (GP) of North America is rooted over the Gulf of Mexico and the Caribbean Sea and has therefore been referred to as the ‘‘Maya express’’ (Dirmeyer and Kinter 2009). Its activity peaks during boreal summer and spring.
(iv) TME over the western North Atlantic [the Gulf Stream maximum (GS)] shows the smallest annual cycle with a maximum in winter and autumn.
KW10 also showed the climatological significance of TMEs to rainfall. All four activity maxima have been linked to heavy rainfall and flooding, both through sta-tistical and case studies, particularly the PE (Higgins et al. 2000; Ralph et al. 2006; Junker et al. 2008; Leung and Qian 2009; Roberge et al. 2009; Underwood et al. 2009; Ralph et al. 2010, 2011; Smith et al. 2010; Dettinger 2011; Neiman et al. 2011), but also the GP (Dirmeyer and Kinter 2009; Moore et al. 2012), GS (Milrad et al. 2010), and WP regions (Ninomiya 2000; Ninomiya and Shibagaki 2007). Occasionally, the GS activity can affect Europe (Stohl et al. 2008; Lavers et al. 2011). The GS maximum has also been hypothesized to play a role in linking large-scale climate fluctuations between the North Pacific/North America and the North Atlantic (Pinto et al. 2011).
The literature on similar phenomena in the Southern Hemisphere (SH) is more limited, partly because of the much smaller landmasses at midlatitudes. Climatologi-cally, vertically integrated fields of meridional moisture flux show distinct areas of equatorward transport to the west of South America, southern Africa, and Australia and weaker poleward transport almost everywhere else (Fig. 6 in Howarth 1983; Fig. 6 in Arraut and Satyamurty 2009), particularly over the South Atlantic Ocean. Equatorward moisture fluxes more than double from austral winter to summer, while poleward fluxes vary significantly less (Fig. 7 in Howarth 1983). The maxi-mum in the poleward transport near South America appears to be related to the South Atlantic convergence zone (SACZ) that extends from the Amazon south-eastward into the subtropics (Carvalho et al. 2004) and to a continental low-level jet along the eastern flank of the Andes (Salio et al. 2002; Marengo et al. 2004). The two features together control a lot of the precipitation variability in this region, from subseasonal to interannual time scales, including extreme events (Seluchi and Marengo 2000; Todd et al. 2003; Liebmann et al. 2004; Arraut and Satyamurty 2009). The analogous phenom-enon over the Pacific is the South Pacific convergence zone (SPCZ; Kiladis et al. 1989; Vincent 1994; Widlansky et al. 2011), whose activity varies on interannual time scales because of the El Nin˜o–Southern Oscillation (ENSO; Vera et al. 2004) and on synoptic time scales because of the equatorward penetration of upper-level troughs from the midlatitudes (Kiladis and Weickmann 1992). Poleward moisture transports and heavy rainfall around South Africa have been documented in con-nection with upper-level disturbances penetrating to low latitudes (D’Abreton and Tyson 1995; Todd et al. 2004; Hart et al. 2010). Cook (2000) used the term South Indian convergence zone to stress analogies with the SACZ and SPCZ.
2. Data and method
The results of this study are mainly based upon 6-hourly ERA-Interim reanalysis data (Dee et al. 2011) covering the period 1979–2010. The data are available on 60 hybrid model levels and have been interpolated from the native TL255 to a regular grid with 18 3 18 horizontal grid spacing. The older ERA-40 data (Uppala et al. 2005) for the 23-yr period 1979–2001, with a spec-tral resolution of TL159, are only used for comparison. The TME identification procedure is detailed in KW10 and shall only be summarized here. All trajectories are calculated with the offline software package Lagrangian Analysis Tool (LAGRANTO; Wernli and Davies 1997), using the three-dimensional winds on model levels. This tool allows tracing different meteorological parameters by interpolating the respective fields to the position of the trajectory at a given time. One-day forward trajec-tories are calculated for every 0000 UTC analysis time of the study period from every 100 km3100 km330 hPa box within the tropical belt (208S–208N) and between 1000 and 490 hPa (see Fig. 2 of KW10). Out of the
;300 000 trajectories per day, only those that cross 208N or 208S are continued for another 6 days. Trajectories that reach a water vapor flux of at least 100 g kg21m s21 somewhere poleward of 358latitude are defined as TME trajectories. As every trajectory represents the same atmospheric mass of;331012kg, specific humidity can be readily converted into water mass. Note that this ap-proach is different and complementary to some recently developed moisture source diagnostics (e.g., Dirmeyer and Brubaker 1999; Stohl and James 2004; Sodemann et al. 2008), which use backward trajectories to infer about the origin of moisture for precipitation in a pre-specified region. In contrast, our method is using a forward approach, which allows identifying the future pathway of tropical air masses extruded into the extratropics.
For the correlations between TME activity and large-scale climate variations in section 4c, the two widely used indices Nin˜o 3.4–Hadley Centre Sea Ice and Sea Surface Temperature, version 1 (nino3_4_HadISST1; to represent ENSO variability), and southern annular mode (SAM) are used. Both were taken from the Royal Netherlands Meteorological Office (Koninklijk Neder-lands Meteorologisch Instituut; KNMI) Climate Ex-plorer webpage at http://climexp.knmi.nl.
3. ERA-40 versus ERA-Interim
This short section summarizes some of the results for the NH from KW10 and discusses differences between TME calculations using ERA-Interim (as in this paper) and ERA-40 (as in KW10). Here, the ERA-Interim
results are calculated for the ERA-40 period 1979–2001 only, that is, for the same period as in KW10. Figure 1a shows the vertically integrated TME in the NH in mega-tons per day per 108-longitude strip for ERA-Interim and the four seasons December–February (DJF), March–May (MAM), June–August (JJA), and September–November (SON), similar to Fig. 8 in KW10; 1 Mt day21
corre-sponds to 0.000 03 Eg month21, a unit sometimes used in continental water budget studies (e.g., Trenberth et al. 2007). As discussed in KW10, there are marked longi-tudinal variations with the four main activity regions PE, GP, GS, and WP (see section 1). The PE activity is only well defined in winter, while WP is clearly dominated by the very large transports during summer, with inter-mediate values during the transition seasons. The very
FIG. 1. Mean TMEs across 358N (Mt day21per 108-longitude
narrow GP region shows a similar annual cycle, while seasonal differences over the mostly oceanic GS region are relatively small.
Generally speaking, differences between the two reanalysis datasets can be caused by the different models used, different data assimilation systems, and different horizontal resolutions. TME statistics are affected by both differences in moisture content and circulation. It is well known that ERA-40 has a considerable moist bias in the tropics, which has been substantially improved in ERA-Interim (Fig. 12 in Dee and Uppala 2008), owing to a completely revised humidity analysis methodology (Andersson et al. 2005). Looking at a time-averaged and vertically integrated parameter such as TME, however, differences between the two datasets are generally small (within 66% annually on a regional level), and both negative and positive deviations occur (Fig. 1b). The most striking differences are (i) a more pronounced PE maximum in ERA-40 (229 Mt day21 or 5% on a re-gional level); (ii) a slightly stronger summertime GP maximum in ERA-Interim (266 Mt day21or 8.3%); and (iii) more TME over WP in all seasons in ERA-Interim, with differences of almost 900 Mt day21in JJA (4.2%) and SON (14.2%). More detailed analyses suggest that the PE extends a little farther to the west at midtropo-spheric levels in ERA-40, with TME moisture anomalies reaching a little deeper into the troposphere (not shown). The latter holds also for other regions and seasons and therefore appears to be systematic. As the differences in summer and autumn occur over regions with tropical cyclone activity, it is conceivable that they are a reflection of a better representation of tropical cyclones in ERA-Interim because of the higher horizontal resolution and possibly improved data assimilation. A more detailed analysis of these differences, however, is beyond the scope of this paper.
4. SH climatology
This section contains a statistical analysis of the cli-matological background of mean meridional moisture fluxes (section 4a), as well as spatial and seasonal (sec-tion 4b) and interannual varia(sec-tions (sec(sec-tion 4c) of TMEs, all for the SH.
a. Mean meridional moisture fluxes across 358S
Using ERA-Interim data for the full period 1979– 2010, mean meridional moisture fluxes across 358S show three distinct couplets of equatorward and poleward transport over the main ocean basins (Fig. 2). The equatorward branches are typically narrow and located immediately to the west of South America, southern Africa, and Australia, while the poleward branches are
wider, deeper, and somewhat weaker. This pattern suggests a close relation to the subtropical anticyclones in the SH. The equatorward moisture fluxes are intense during austral summer (Fig. 2a) and almost absent in winter (Fig. 2c), with intermediate values in the transi-tion seasons (Figs. 2b,d). Poleward fluxes vary signifi-cantly less, most likely because of the smaller seasonality in tropical temperatures and moisture contents. The variability over Australia shows a more complex sea-sonal and vertical pattern, with the equatorward branch shifting from the west to the east side of the continent from austral summer to winter and continuous poleward transports aloft (Figs. 2a,c). These patterns are broadly consistent with the vertically integrated values shown in Howarth (1983) and Arraut and Satyamurty (2009). The next section will quantify how much of the transports shown in Fig. 2 are related to TME events.
b. Longitudinal, vertical, and seasonal distribution
Figure 3 shows zonal cross sections of TME trajectory counts for the four seasons, analogous to Fig. 5 in KW10 for the NH. The longitudinal and seasonal patterns show some similarities to the ERA-Interim climatology for meridional moisture flux shown in Fig. 2, but the ma-jority of the trajectories are already quite elevated once they reach 358S, with maxima typically between 850 and 700 hPa. The contribution of TME to the climatological transport will be discussed toward the end of this sub-section and is summarized in Table 1. There is a general tendency for trajectories to curve eastward and to rise further in the subtropics, as found in KW10 for the NH (not shown). The rising is typically related to the pole-ward flow of the tropical air on gently uppole-ward sloping isentropic surfaces in the subtropics and to frontal lifting farther into midlatitudes. As in the NH, four main ac-tivity regions can be distinguished: (i) the central and eastern South Pacific Ocean (1708–908W, abbreviated PAC hereafter), (ii) eastern South America and the adjacent South Atlantic Ocean (608W–08, ATL), (iii) the western South Indian Ocean south of Madagascar (308– 808E, MAD), and (iv) a rather weak maximum over western Australia and adjacent waters (1108–1408E, AUS). PAC, ATL, and MAD are located in the western parts of the three main subtropical oceanic anticyclones, where poleward flow dominates at low levels, similar to the GS region in the NH, while pressure patterns around the AUS region are less stationary and not so straight-forward to interpret.
stands out as the region with lowest trajectory numbers and highest elevation, possibly because of the midlevel anticyclone that forms above the continental heat low during summer (e.g., Spengler and Smith 2008). MAM is characterized by less sharp separations between the re-gions and a marked upward shift in all rere-gions but AUS (Fig. 3b). JJA has clear minima in TME trajectory counts for MAD and AUS, with the former showing a marked westward shift (Fig. 3c). Trajectory counts for PAC and ATL are not dramatically different from DJF. Finally, SON (Fig. 3d) is a clear transition between JJA and DJF, with many characteristics between those of the two neighboring seasons.
Figure 4 displays anomalies in specific humidity and meridional wind for all TME trajectories and pertinent
ERA-Interim background climatologies in a given box for the two solstice seasons. In terms of moisture, there is a distinct change from summer to winter (Figs. 4a,c). While typical specific humidities near the surface in DJF are 10 g kg21, they hardly reach 7 g kg21in JJA. TME trajectories are typically 1–3 g kg21 moister than the
ERA-Interim climatology, particularly in the midtropo-sphere in austral summer. In DJF, both the ERA-Interim climatology and TME-related anomalies show small longitudinal variations, with a tendency of moister conditions to the west near the continental boundaries (Fig. 4a). During JJA, TME-related humidity anomalies are small over MAD and AUS because of the reduced number of low-level TME trajectories (Fig. 4c). The most important reason for the summer maxima in all
regions is the general increase in temperature that al-lows for larger atmospheric moisture content, according to the Clausius–Clapeyron relationship. The maxima at low altitudes in Figs. 4a,c imply that low-level TME trajectories contribute more to the meridional moisture transport across 358S than those at midlevels, where the number maxima are found (Fig. 3). In fact, multiplying
the number fields from Fig. 3 with the respective mean specific humidity from Fig. 4 yields patterns that are structurally very similar to the ERA-Interim climatol-ogy in Fig. 2 (not shown).
With regard to the meridional flow during DJF, values from the ERA-Interim climatology across most of the SH are small, except for coherent southerly flow on the
FIG. 3. Seasonal-mean vertical-longitudinal TME variations in the SH. Zonal cross sections along 358S showing counts of TME tra-jectories in 30 hPa by 108-longitude boxes for (a) DJF, (b) MAM, (c) JJA, and (d) SON based on ERA-Interim reanalyses for the period 1979–2010. Blackened areas show ECMWF model orography in 18resolution with main mountain features labeled. The abbreviations represent the four main regions discussed in the text and marked with gray shading in Fig. 5. Note that parts of the lowest boxes are occasionally below ground, resulting in overall low counts.
TABLE1. TME across 358S (Mt day21) in the four main TME regions during the four seasons and percentage of the respective
ERA-Interim climatological values for the period 1979–2010 (see Fig. 2). Spatial definitions are given in parentheses in the first column.
Region DJF MAM JJA SON
PAC (1708–908W) 8566 (33%) 6235 (24%) 5412 (19%) 4246 (17%)
ATL (608W–08) 10 710 (44%) 6533 (29%) 6275 (29%) 6326 (30%)
MAD (308–808E) 3384 (18%) 1498 (11%) 980 (11%) 2363 (17%)
western sides of the three main landmasses (Fig. 4b). The TME-related meridional flow shows a decrease with height and toward the east of each region, with maxima of up to 5 m s21. In JJA, the ERA-Interim climatology shows a reversal of the flows on the western side of the continents, and northerlies appear at midlevels over the southern Indian Ocean (Fig. 4d). The TME-related values increase even more strongly toward the surface than during DJF, but with weaker east–west gradients across the regions. This is consistent with a larger baroclinicity during winter. Comparing the results shown in Fig. 4 with the NH (see Fig. 6 in KW10) reveals overall drier conditions in the SH and much less structure in the me-ridional wind, but overall comparable TME anomalies.
Figure 5 shows vertically integrated TMEs for the SH in analogy to the NH results shown in Fig. 1. The four
regions identified in Fig. 3 stand out clearly and are marked with gray bars. All four regions have clear maxima in austral summer, particularly PAC and ATL (see also the integrated values in Table 1). These two regions have very similar values during the other three seasons, with PAC also showing a slight eastward shift. MAD shows intermediate activity during austral spring associated with a weak westward shift, while values during austral autumn and, in particular, winter are low. AUS also has lowest values in winter, with intermediate activity during the transitions seasons.
For PAC, summertime shows the maximum in abso-lute terms but also in the relative contribution to the ERA-Interim climatological transports (33%; see Table 1). This is the result of a small increase in the number of TME trajectories (Figs. 3a,c) combined with much
FIG. 4. Characteristics of TMEs in the SH. (a) Mean specific humidity (g kg21; shading) and (b) meridional wind (m s21; shading) for
increased moisture contents (Figs. 4a,c), which over-compensate the slightly smaller meridional wind anoma-lies (Figs. 4b,d). While the moisture maximum in summer is expected, the higher number of trajectories is not. If the SH storm track had a strong control on TME ac-tivity, a maximum in austral winter should be expected. For instance, Wernli and Schwierz (2006, their Fig. 5) show an increased cyclone activity near 408S in JJA relative to DJF. The fact that this is not the case suggests that low-frequency or synoptic-scale wave disturbances from the NH might play a role (see Newman et al. 2012). It has been known for a long time that the direction of the upper-level flow in the equatorial belt has a strong control on the dispersion of Rossby wave energy from one hemisphere into the other (see section 4 in the re-view paper by Knippertz 2007). During austral summer and autumn, the eastern and central tropical Pacific is dominated by upper-level westerlies, allowing distur-bances from the active NH storm track to affect the SH low latitudes, leading to a maximum in transient low-latitude upper troughs there (Fro¨hlich and Knippertz 2008). During austral winter and spring, this so-called westerly duct (Webster and Holton 1982) closes, asso-ciated with reduced low-latitude troughs over the South Pacific. Austral summer is also the time of the most active SPCZ, which is closely connected to tropical convection over the western Pacific (Vincent 1994).
For ATL, there are large differences between boreal winter and summer in terms of absolute values (Fig. 5) and contribution to the ERA-Interim climatological
transport, which are higher than in any of the other re-gions (29%–44%; Table 1). These differences are mainly caused by higher moisture contents (Figs. 4a,c), while the number of TME trajectories and the meridional wind anomalies change only little (Figs. 3a,c, 4b,d). Several factors are suggested to contribute to this be-havior: while the SH storm track is more active in austral winter, the open westerly duct over the equatorial At-lantic during austral summer leads to a higher frequency of upper troughs similar to the PAC region (Fro¨hlich and Knippertz 2008). In addition, the heating of the landmasses of southern South America during local summer leads to a reduction in low-level pressure and, thus, a stronger west–east gradient and enhanced north-erly flow, which is also reflected by a stronger SACZ (Carvalho et al. 2004) and stronger jets along the eastern side of the Andes (Marengo et al. 2004). The latter as-pect bears some similarities to the behavior of the WP and GP regions in the NH during summer and can be regarded as a monsoon-type response.
The tropics of the eastern hemisphere are dominated by upper-level easterlies year round, so influences of NH Rossby wave activity can be expected to be small. Despite the much smaller extension of the African con-tinent into the SH relative to South America, higher temperatures and lower pressure during austral spring and summer support low-level northerly flows and TMEs during these seasons together with the increased mois-ture contents. Nevertheless contributions of TMEs to the ERA-Interim climatological meridional moisture flux are smallest in MAD (below 20% in all seasons; see Table 1). The small seasonal variations over AUS seen in Fig. 5 are not so easily explained with large-scale changes and are probably related to more localized transient disturbances. The contributions in a relative sense vary dramatically from 61% in DJF to only 9% in JJA (Table 1).
Comparing the two hemispheres (Figs. 1, 5) reveals smaller-amplitude longitudinal variations in the SH, with maximum values not exceeding 2000 Mt day21per 108longitude, except for ATL during DJF. This is most likely related to the much smaller fraction of landmasses in the SH and, more specifically, to the absence of major mountain complexes that block TME in large parts of the NH. Integrated over all longitudes, the mean values for the NH and SH are;21 000 and 19 300 Mt day21,
respectively. This fairly moderate difference is mainly caused by the much larger NH values in boreal summer related to the Asian and North American monsoons, which are not matched by the austral summer activity in the SH. Transition season values are rather similar. Relative contributions to the ERA-Interim climatology vary in a similar range in both hemispheres (12%–56%; compare Table 1 in KW10 with Table 1 here).
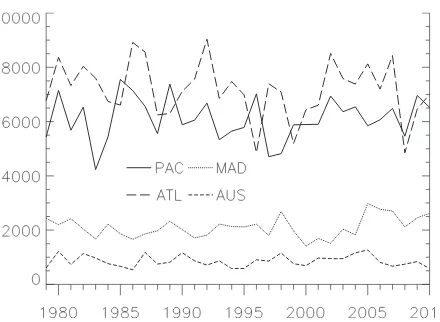
FIG. 5. Seasonal and longitudinal TME variations in the SH. Shown are mean TMEs across 358S (Mt day21per 108-longitude
c. Interannual variations
Figure 6 shows time series of annually averaged, ver-tically integrated TME for the four regions, similar to Fig. 9 in KW10 for the NH. None of the regions displays a significant trend over the period of investigation. Most variability is on time scales of a few years, with little decadal signals. Variations in ATL range from 5000 to 9000 Mt day21, with a striking sharp drop from 2007 to 2008. PAC covers a slightly smaller range from about 4000 to 7500 Mt day21. The standard deviation is much larger in ATL than in PAC (1049 versus 793 Mt day21).
The other two regions have much smaller values varying around 2000 Mt day21for MAD and 1000 Mt day21for AUS with standard deviations of 384 and 211 Mt day21, respectively.
Correlations between the TME activity in the differ-ent regions are all belowj0.4j, indicating little coherent behavior. However, correlations with the nino3_4_ HadISST1 index reveals enhanced TME over the ATL during El Nin˜o years (r 5 0.62), particularly during austral summer (r50.75). A similar but weaker rela-tionship is found for AUS (r50.41), while TMEs over PAC show the opposite behavior, with less activity during warm ENSO events (r 5 20.51, r 5 20.43 in DJF). This behavior is consistent with the discussion in section 4b on the seasonal cycle. It has long been known that El Nin˜o events ‘‘close’’ the westerly duct over the central and eastern tropical Pacific in DJF, leading to less upper-level disturbances at low latitudes of both hemispheres (Waugh and Polvani 2000; Fro¨hlich and Knippertz 2008), while the ATL experiences the oppo-site behavior. A compensating effect that could explain the weaker correlation for PAC relative to ATL is the higher moisture content over the eastern Pacific during
ENSO events, which favors TME. The relationship in the AUS region, in contrast, is most likely more directly associated with the change of the mean pressure centers in the southern Pacific associated with ENSO. The ATL is the only region that shows significant correlations to the SAM, withr5 20.39. This is consistent with results by Thompson and Lorenz (2004), who found a weaker relationship between high- and low-latitude, large-scale variability in the SH relative to the NH.
Correlations for the NH have already been discussed in section 5b in KW10. Overall, results are quite robust, using ERA-Interim and the longer time period instead of ERA-40. The highest annual correlations are be-tween PE and WP, which increase slightly from20.54 to
20.62, mainly because of an increase during DJF, while correlations between GP and GS remain weakly nega-tive during the whole year. Correlations with ENSO stay weakly negative for PE (around20.4) and weakly pos-itive for GS (around 0.4) with overall weak relationships to the North Atlantic Oscillation.
5. Exemplary cases
In this section, several significant TME examples are discussed for illustrative purposes and to clarify their relationship to features from the literature. These are two unusual events in the SH (section 5a); two examples of ARs associated with TME, including a discussion of the statistical relationship between the two (section 5b); and examples of high-impact TME situations in the NH (section 5c). In all cases, the Lagrangian perspective using the TMW trajectories is combined with Eulerian plots of IWV, mean sea level pressure (MSLP), and upper-level isentropic potential vorticity (IPV).
a. Southern Hemisphere
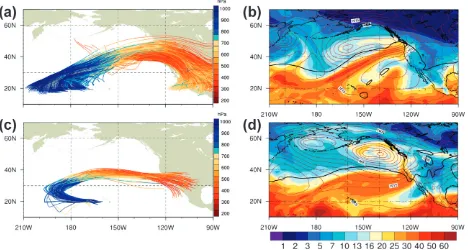
Figure 7 shows three extraordinary examples in the SH. The first is a TME event associated with the extra-tropical transition of Tropical Cyclone Bola, which caused torrential rainfalls in New Zealand between 6 and 8 March 1988 (Sinclair 1993). TME trajectories started at 0000 UTC 4 March 1988 nicely show the low-level inflow of moist air masses into the cyclone center near the northern tip of New Zealand as well as the anticyclonic outflow into the upper-tropospheric west-erlies farther south (Fig. 7a). IWV fields for 1800 UTC 7 March show a concentration of moisture around the cyclone center and a broad area of enhanced values to the east and in the deep tropics, which served as a res-ervoir for the storm (Fig. 7b). The upper-level PV struc-tures are rather complicated at this time, with several filaments near the cyclone and to the south and west of it (black lines in Fig. 7b).
[image:10.567.55.275.57.218.2]The example case from November 2010 is much more typical of a TME event induced by an upper-level trough (see PV lines in Fig. 7d). Starting in the deep tropics, TME trajectories converge, curve anticyclonically to-ward the subtropics, and then rise abruptly when they reach the Andes (Fig. 7c). The IWV field shows an elongated tongue of high values stretching from the tropical reservoir toward South America, which is strad-dled between a low in MSLP to the west and a high closer to the continent (Fig. 7d).
Finally Figs. 7e,f show an example of a low-level jet to the east of the Andes. The ‘‘root’’ region of this TME event is relatively narrow longitudinally and entirely
located over land (Fig. 7e). Over Argentina, the trajec-tories split into one ensemble that rises abruptly and circulates antiycyclonically, while the rest stays at a lower level and follows a westerly track across the South Atlantic. These trajectories are circulating around the western and southern side of a strong subtropical anti-cyclone and have a very clear reflection in the IWV fields (Fig. 7f). This elongated IWV maximum stays close to the mountains in the first 2 days of the trajectory period and then quickly shifts east (not shown). This region is also characterized by a conspicuous wave breaking evi-dent from the reversal of the meridional gradient in the 330-K PV (black lines in Fig. 7f). Upstream of the TME
trajectories, there is a weak trough in the 330-K PV, with a corresponding weak surface low over the easternmost South Pacific.
b. Atmospheric rivers
In section 1, potential connections between ARs and TME events were discussed. Dettinger (2011) provides a list of AR cases affecting the North American west coast for the 12 water years from 1997/98 to 2008/09, separated into two latitude bands: 32.58–418N (mainly California; his Table 1a) and 418–52.58N (mainly Oregon, Washington, and British Columbia; his Table 1b). This allows a case-by-case assessment of how many of these situations are connected with significant tropical mois-ture sources.
Figure 8 shows TME trajectories together with IWV, MSLP, and PV as in Fig. 7 for two selected AR cases, one for each region. The northern case occurred during 28 and 29 December 1998. Figure 8a shows 7-day TME trajectories started at 0000 UTC 24 December. This period was characterized by a massive TME outbreak rooted in the area of the date line. Trajectories converge in the southern midlatitudes and then track northeast-ward tonortheast-ward the North American coast, as often seen during PE events. After rising to the upper troposphere, most trajectories curve back toward the tropics. The associated IWV fields show an elongated narrow tongue
of high values to the east of an upper-level PV trough and to the south of a very extended surface low over the northeastern Pacific (Fig. 8b). In contrast, the second ex-ample affecting the southern coast during 7–9 November 2002 shows a much smaller number of trajectories pro-gressing slower toward North America (Fig. 8c) and a much broader area of high IWV values (Fig. 8d). There is no clear PV trough in the source region of the AR, but there is a pronounced surface low to the north of it (Fig. 8d).
To get more quantitative information on which frac-tion of ARs is connected to TME as in the examples discussed above, all ARs identified by Dettinger (2011) were subjectively matched to TME events based on the type of plot shown in Fig. 8. The southern coast has a total number of AR days of 164 over the 12 years in-vestigated by Dettinger (13.7 days yr21; Fig. 9a). There is no clear annual cycle apart from consistently low ac-tivity during the summer months July–September. Largest monthly values are found for the transition season months May and November; 131 out of the 164 AR days (80%) have a strong TME contribution with little vari-ations throughout the year. The northern part of the coast is much more active with 391 AR days over the 12 years (32.6 days yr21; Fig. 9b). The clear seasonal cycle shows minimum activity from late winter to spring, a steep increase toward the peak in July, and then a slow
[image:12.567.53.521.65.315.2]drop-off toward January. Here, only 208 matches with TME events are found with stark seasonal differences. For December–May, there is more than 90% overlap, while the more active boreal summer and autumn show little tropical moisture sources (46%). This result is fully consistent with the seasonal behavior of the PE maxi-mum discussed in sections 1 and 3.
c. Other examples
This section discusses two high-impact events from the literature to further illustrate the importance of TMEs. Between 5 and 9 January 1998, the northeastern United States and eastern Canadian provinces were hit by an unprecedented ice storm characterized by a pro-longed period of freezing rain accumulating to more than 100 mm in some areas (Gyakum and Roebber 2001), which caused substantial economic damage. TME trajectories started at 0000 UTC 5 January 1998 (Fig. 10a) show a very broad region of strong activity from the low-latitude western Atlantic and Caribbean along the east coast of North America into Canada. After an abrupt rise over the area of heaviest precipitation, many TME trajectories curve back toward the tropics at upper levels. This circulation is rather stationary, with TME trajectories started on 2–7 January showing similar
patterns. This suggests that a significant part of the freezing rain might have been fed by slowly moving moist tropical air masses that were lifted over the colder continental air masses over eastern Canada. The TME event is reflected in an area of very high IWV along the east coast, ahead of an upper PV trough stretching into the Gulf of Mexico and a surface low centered south of the Great Lakes (Fig. 10b). This is an impressive ex-ample of how TME in the GS region can be associated with high-impact weather at northern midlatitudes.
The last example shows that TME activity can occa-sionally affect even higher latitudes. During the night from 13 to 14 September 2005, Norway was hit by a record-breaking heavy precipitation event with observations of more than 150 mm in 24h, leading to flooding, landslides, one fatality, and considerable infrastructural damage (Stohl et al. 2008). Some of the TME trajecto-ries started at 0000 UTC 7 September initially curve anticyclonically away from the tropical western Atlantic and then reach southwestern Norway on 13 September in a broad southwesterly airstream (Fig. 10c). Even after a latitudinal distance of about 408, many TME trajecto-ries have still only risen to midlevels, suggesting that a significant fraction of the tropical moisture was avail-able to feed the precipitation over Norway. The Eulerian plot shown in Fig. 10d indicates that the extraordinarily long filament of high IWV is generated by two cyclones: one to the southeast of Newfoundland associated with a narrow PV filament and one to the north of Scotland, which most likely also generated the uplift for the pre-cipitation. The small number of TME trajectories found suggests a minor contribution to the total rainfall but illustrates the highly unusual circulation during this period.
6. Summary and discussion
TMEs to the extratropics are an important feature of the general circulation of the atmosphere in both hemispheres and link tropical moisture sources with extratropical precipitation and often flooding. This study expanded previous trajectory-based work by KW10 on this topic by computing a global TME climatology using ECMWF ERA-Interim reanalysis data for the 32-yr period 1979–2010. The main conclusions from this work are as follows:
(i) Climatological aspects such as integrated total TME-related water vapor transport into the NH are not sensitive to the choice of the reanalysis dataset and the time period (ERA-40 1979–2001 versus ERA-Interim 1979–2010). The most notable differences are slightly higher TMEs in regions
with summertime monsoons and tropical cyclone activity in ERA-Interim, as well as systematically moister TMEs at midlevels in ERA-40.
(ii) TME in both hemispheres shows four activity centers. In the NH, these have very distinct sea-sonal cycles ranging from warm-season maxima related to monsoon-type circulations over East Asia and central North America (WP and GP regions) over oceanic activity with a small annual cycle (GS) to winter maxima over the eastern North Pacific (PE). The SH maxima are located in the western parts of the main subtropical anticyclones over the central and eastern Pacific (1708–908W, near the SPCZ), over eastern South America and the adjacent Atlantic (608W–08, near the SACZ), and over the western Indian Ocean (308–808E). A fourth weaker maximum is found over western Australia (1108–1408E). Typically, contributions of TME to the ERA-Interim climatological merid-ional moisture flux at 358latitude are around one-third, with some variations between seasons and regions (range 9%–61%).
(iii) Generally, TME activity in the SH peaks in austral summer because of higher moisture contents and possibly because of increased Rossby wave activity from the NH, which can only propagate across the equator during this part of the year because of
upper-level westerlies in the tropics over the Pacific and Atlantic Oceans.
(iv) Interannual variability is, to some extent, con-trolled by El Nin˜o in both hemispheres. During warm events, activity is typically reduced over the South Pacific and eastern North Pacific, while activity increases further east over the South and North Atlantic, as well as around Australia. This also leads to a negative correlation between activity over the western and eastern North Pacific. Generally, these variations are most likely con-nected to more zonally elongated jets over the Pacific during ENSO warm events, which act as a stronger waveguide and reduce tropical– extratropical and interhemispheric interactions. Correlations with higher-latitude climate indices such as the southern annular mode and the North Atlantic Oscillation are generally rather weak. (v) Case studies and statistical analyses presented
here show the relevance of TMEs to high-impact weather events. Around 90% of all ARs affecting the west coast of North America during December– May are connected to TME events, while summer ARs have more extratropical sources, consistent with the seasonal cycle of the PE. Occasionally, TME can even contribute to heavy precipitation at far northern latitudes, as, for example, during the
Quebec ice storm in January 1998 and the floods in Norway in September 2005.
In future work, the link between TME and heavy rain/ flooding should be established in a more quantitative way. The TME climatology generated here can be ob-tained for such purposes from the authors. In addition, the link between TME events and the rapid deepening of extratropical cyclones discussed in KW10 should be in-vestigated in greater depth using an objective cyclone climatology. Such work could contribute to a better understanding of diabatic contributions to cyclone de-velopment in the storm tracks of both hemispheres.
Acknowledgments.G.G. acknowledges funding from
the Earth System Research Centre Geocycles at the University of Mainz and the Decadal Predictions (Mittelfristige Klimaprognosen; MiKlip) project. The authors would like to thank the Swiss Federal Office of Meteorology and Climatology (MeteoSwiss) for pro-viding access to ECMWF data and are grateful for the constructive criticism by John Fasullo and two anony-mous reviewers.
REFERENCES
Andersson, E., and Coauthors, 2005: Assimilation and modeling of the atmospheric hydrological cycle in the ECMWF forecasting system.Bull. Amer. Meteor. Soc.,86,387–402.
Arraut, J. M., and P. Satyamurty, 2009: Precipitation and water vapor transport in the Southern Hemisphere with emphasis on the South American region.J. Appl. Meteor. Climatol.,48, 1902–1912.
Bao, J.-W., S. A. Michelson, P. J. Nieman, F. M. Ralph, and J. M. Wilczak, 2006: Interpretation of enhanced integrated water vapor bands associated with extratropical cyclones: Their formation and connection to tropical moisture. Mon. Wea. Rev.,134,1063–1080.
Carvalho, L. M. V., C. Jones, and B. Liebmann, 2004: The South Atlantic convergence zone: Intensity, form, persistence, and relationships with intraseasonal to interannual activity and extreme rainfall.J. Climate,17,88–108.
Cook, K. H., 2000: The South Indian convergence zone and in-terannual rainfall variability over southern Africa.J. Climate,
13,3789–3804.
D’Abreton, P. C., and P. D. Tyson, 1995: Divergent and non-divergent water vapour transport over southern Africa during wet and dry conditions.Meteor. Atmos. Phys.,55,47–59. Dee, D. P., and S. Uppala, 2008: Variational bias correction in
ERA-Interim. ECMWF Tech. Memo. 575, 26 pp.
——, and Coauthors, 2011: The ERA-Interim reanalysis: Config-uration and performance of the data assimilation system.
Quart. J. Roy. Meteor. Soc.,137,553–597.
Dettinger, M., 2011: Climate change, atmospheric rivers, and floods in California—A multimodel analysis of storm frequency and magnitude changes.J. Amer. Water Resour. Assoc.,47,514–523. Dirmeyer, P. A., and K. L. Brubaker, 1999: Contrasting evapora-tive moisture sources during the drought of 1988 and the flood of 1993.J. Geophys. Res.,104(D16), 19 383–19 397.
——, and J. L. Kinter III, 2009: The ‘‘Maya Express’’: Floods in the U.S. Midwest.Eos, Trans. Amer. Geophys. Union,90,101–102. Fro¨hlich, L., and P. Knippertz, 2008: Identification and global cli-matology of upper-level troughs at low latitudes.Meteor. Z.,
17,565–573.
Gyakum, J. R., and P. J. Roebber, 2001: The 1998 ice storm— Analysis of a planetary-scale event. Mon. Wea. Rev.,129, 2983–2997.
Hart, N. C. G., C. J. C. Reason, and N. Fauchereau, 2010: Tropical– extratropical interactions over southern Africa: Three cases of heavy summer season rainfall.Mon. Wea. Rev.,138,2608–2623. Higgins, R. W., J.-K. E. Schemm, W. Shi, and A. Leetma, 2000: Extreme precipitation events in the western United States related to tropical forcing.J. Climate,13,793–820.
Howarth, D. A., 1983: Seasonal variations in the vertically in-tegrated water vapor transport fields over the Southern Hemisphere.Mon. Wea. Rev.,111,1259–1272.
Jankov, I., J.-W. Bao, P. J. Neiman, P. J. Schultz, H. Yuan, and A. B. White, 2009: Evaluation and comparison of microphysical algorithms in ARW-WRF Model simulations of atmospheric river events affecting the California coast.J. Hydrometeor.,10, 847–870.
Junker, N. W., R. H. Grumm, R. Hart, L. F. Bosart, K. M. Bell, and F. J. Pereira, 2008: Use of normalized anomaly fields to an-ticipate extreme rainfall in the mountains of northern Cal-ifornia.Wea. Forecasting,23,336–356.
Kiladis, G. N., and K. M. Weickmann, 1992: Extratropical forcing of tropical Pacific convection during northern winter.Mon. Wea. Rev.,120,1924–1938.
——, H. von Storch, and H. van Loon, 1989: Origin of the South Pacific Convergence Zone.J. Climate,2,1185–1195. Knippertz, P., 2007: Tropical–extratropical interactions related to
upper-level troughs at low latitudes.Dyn. Atmos. Oceans,43, 36–62.
——, and J. E. Martin, 2007: A Pacific moisture conveyor belt and its relationship to a significant precipitation event in the semiarid southwestern United States.Wea. Forecasting,22, 125–144.
——, and H. Wernli, 2010: A Lagrangian climatology of tropical moisture exports to the Northern Hemispheric extratropics.
J. Climate,23,987–1003.
Lavers, D. A., R. P. Allan, E. F. Wood, G. Villarini, D. J. Brayshaw, and A. J. Wade, 2011: Winter floods in Britain are connected to atmospheric rivers. Geophys. Res. Lett., 38, L23803, doi:10.1029/2011GL049783.
Leung, L. R., and Y. Qian, 2009: Atmospheric rivers induced heavy precipitation and flooding in the western US simulated by the WRF regional climate model.Geophys. Res. Lett.,36,L03820, doi:10.1029/2008GL036445.
Liebmann, B., G. N. Kiladis, C. S. Vera, A. C. Saulo, and L. M. V. Carvalho, 2004: Subseasonal variations of rainfall in South America in the vicinity of the low-level jet east of the Andes and comparison to those in the South Atlantic convergence zone.J. Climate,17,3829–3842.
Marengo, J. A., W. R. Soares, C. Saulo, and M. Nicolini, 2004: Climatology of the low-level jet east of the Andes as derived from the NCEP–NCAR reanalyses: Characteristics and tem-poral variability.J. Climate,17,2261–2280.
Milrad, S. M., E. H. Atallah, and J. R. Gyakum, 2010: Synoptic typing of extreme cool-season precipitation events at St. John’s, Newfoundland, 1979–2005.Wea. Forecasting,25,562–586. Moore, B. J., P. J. Neiman, F. M. Ralph, and F. E. Barthold, 2012:
Nashville, Tennessee, and vicinity during 1–2 May 2010: The role of an atmospheric river and mesoscale convective sys-tems.Mon. Wea. Rev.,140,358–378.
Neiman, P. J., F. M. Ralph, G. A. Wick, Y.-H. Kuo, T.-K. Wee, Z. Ma, G. H. Taylor, and M. D. Dettinger, 2008: Diagnosis of an intense atmospheric river impacting the Pacific Northwest: Storm summary and offshore vertical structure observed with COSMIC satellite retrievals.Mon. Wea. Rev.,136,4398–4420. ——, L. J. Schick, F. M. Ralph, M. Hughes, and G. A. Wick, 2011: Flooding in western Washington: The connection to atmo-spheric rivers.J. Hydrometeor.,12,1337–1358.
Newell, R. E., N. E. Newell, Y. Zhu, and C. Scott, 1992: Tropo-spheric rivers?—A pilot study.Geophys. Res. Lett.,19,2401– 2404.
Newman, M., G. N. Kiladis, K. M. Weickmann, F. M. Ralph, and P. D. Sardeshmukh, 2012: Relative contributions of synoptic and low-frequency eddies to time-mean atmospheric moisture transport, including the role of atmospheric rivers.J. Climate,
25,7341–7361.
Ninomiya, K., 2000: Large- and meso-alpha-scale characteristics of Meiyu/Baiu front associated with intense rainfalls in 1–10 July 1991.J. Meteor. Soc. Japan,78,141–157.
——, and Y. Shibagaki, 2007: Multi-scale features of the Meiyu-Baiu front and associated precipitation systems.J. Meteor. Soc. Japan,85B,103–122.
Pinto, J. G., M. Reyers, and U. Ulbrich, 2011: The variable link between PNA and NAO in observations and in multi-century CGCM simulations.Climate Dyn.,36,337–354.
Ralph, F. M., P. J. Nieman, and G. A. Wick, 2004: Satellite and CALJET aircraft observations of atmospheric rivers over the eastern North Pacific Ocean during the winter of 1997/98.
Mon. Wea. Rev.,132,1721–1745.
——, ——, and R. Rotunno, 2005: Dropsonde observations in low-level jets over the northeastern Pacific Ocean from CALJET-1998 and PACJET-2001: Mean vertical-profile and atmospheric-river characteristics.Mon. Wea. Rev.,133,889–910. ——, ——, G. A. Wick, S. I. Gutman, M. D. Dettinger, D. R. Cayan, and A. B. White, 2006: Flooding on California’s Rus-sian River: Role of atmospheric rivers.Geophys. Res. Lett.,33, L13801, doi:10.1029/2006GL026689.
——, E. Sukovich, D. Reynolds, M. Dettinger, S. Weagle, W. Clark, and P. J. Neiman, 2010: Assessment of extreme quantitative precipitation forecasts and development of regional extreme event thresholds using data from HMT-2006 and COOP ob-servers.J. Hydrometeor.,11,1288–1306.
——, P. J. Neiman, G. N. Kiladis, K. Weickman, and D. W. Reynolds, 2011: A multi-scale observational case study of a Pacific atmo-spheric river exhibiting tropical–extratropical connections and a mesoscale frontal wave.Mon. Wea. Rev.,139,1169–1189. Roberge, A., J. R. Gyakum, and E. H. Atallah, 2009: Analysis of
intense poleward water vapor transports into high latitudes of western North America.Wea. Forecasting,24,1732–1747. Salio, P., M. Nicolini, and A. C. Saulo, 2002: Chaco low-level jet
events characterization during the austral summer season.
J. Geophys. Res.,107,4816, doi:10.1029/2001JD001315. Seluchi, M. E., and J. A. Marengo, 2000: Tropical–midlatitude
exchange of air masses during summer and winter in South America: Climatic aspects and examples of intense events.Int. J. Climatol.,20,1167–1190.
Sinclair, M. R., 1993: A diagnostic study of the extratropical pre-cipitation resulting from Tropical Cyclone Bola.Mon. Wea. Rev.,121,2690–2707.
Smith, B. L., S. E. Yuter, P. J. Neiman, and D. E. Kingsmill, 2010: Water vapor fluxes and orographic precipitation over northern California associated with a landfalling atmospheric river.
Mon. Wea. Rev.,138,74–100.
Sodemann, H., C. Schwierz, and H. Wernli, 2008: Interannual variability of Greenland winter precipitation sources: La-grangian moisture diagnostic and North Atlantic Oscilla-tion influence.J. Geophys. Res.,113,D03107, doi:10.1029/ 2007JD008503.
Spengler, T., and R. K. Smith, 2008: The dynamics of heat lows over flat terrain.Quart. J. Roy. Meteor. Soc.,134,2157–2172. Stohl, A., and P. James, 2004: A Lagrangian analysis of the
atmo-spheric branch of the global water cycle. Part I: Method de-scription, validation, and demonstration for the August 2002 flooding in central Europe.J. Hydrometeor.,5,656–678. ——, C. Forster, and H. Sodemann, 2008: Remote sources of water
vapor forming precipitation on the Norwegian west coast at 608N—A tale of hurricanes and an atmospheric river.J. Geo-phys. Res.,113,D05102, doi:10.1029/2007JD009006.
Thompson, D. W. J., and D. J. Lorenz, 2004: The signature of the annular modes in the tropical troposphere. J. Climate,17, 4330–4342.
Todd, M. C., R. Washington, and T. James, 2003: Characteristics of summertime daily rainfall variability over South America and the South Atlantic convergence zone.Meteor. Atmos. Phys.,
83,89–108.
——, ——, and P. Palmer, 2004: Water vapour transport associated with tropical–temperate trough systems over southern Africa and the southwest Indian Ocean.Int. J. Climatol.,24,555–568. Trenberth, K. E., L. Smith, T. Qian, A. Dai, and J. Fasullo, 2007: Estimates of the global water budget and its annual cycle using observational and model data.J. Hydrometeor.,8,758–769. Underwood, S. J., M. L. Kaplan, and K. C. King, 2009: The role of
upstream midtropospheric circulations in the Sierra Nevada enabling leeside (spillover) precipitation. Part I: A synoptic-scale analysis of spillover precipitation and flooding in a lee-side basin.J. Hydrometeor.,10,1309–1326.
Uppala, S., and Coauthors, 2005: The ERA-40 Re-Analysis.Quart. J. Roy. Meteor. Soc.,131,2961–3012.
Vera, C., G. Silvestri, V. Barros, and A. Carril, 2004: Differences in El Nin˜o response over the Southern Hemisphere.J. Climate,
17,1741–1753.
Vincent, D. G., 1994: The South Pacific convergence zone (SPCZ): A review.Mon. Wea. Rev.,122,1949–1970.
Waugh, D. W., and L. M. Polvani, 2000: Climatology of intrusions into the tropical upper troposphere.Geophys. Res. Lett.,27, 3857–3860, doi:10.1029/2000GL012250.
Webster, P. J., and J. R. Holton, 1982: Cross-equatorial response to middle-latitude forcing in a zonally varying basic state.J. At-mos. Sci.,39,722–733.
Wernli, H., and H. C. Davies, 1997: A Lagrangian-based analysis of extratropical cyclones. I: The method and some applications.
Quart. J. Roy. Meteor. Soc.,123,467–489.
——, and C. B. Schwierz, 2006: Surface cyclones in the ERA-40 dataset (1958–2001). Part I: Novel identification method and global climatology.J. Atmos. Sci.,63,2486–2507.
Widlansky, M. J., P. J. Webster, and C. D. Hoyos, 2011: On the location and orientation of the South Pacific convergence zone.Climate Dyn.,36,561–578.