Ben Richard Hughes, S.A.A. Abdul Ghani, A numerical investigation into the feasibility of a passive-assisted natural ventilation stack device, International Journal of Sustainable Energy, Volume 30, Issue 4, 2011, Pages 193-211,DOI:10.1080/1478646X.2010.503275
A Numerical Investigation into the Feasibility of a Passive-Assisted
Natural Ventilation Stack Device
Ben Richard HughesandSaud Abdul Ghani
Sheffield Hallam University
Faculty of Arts, Computing, Engineering and Sciences Materials and Engineering Institute
Sheffield, South Yorkshire United Kingdom
S1 1WB
Abstract
Various commercially available natural ventilation devices supply fresh air without mechanical assistance. These devices offer a low energy alternative to mechanical air handling units. However, often cannot satisfy recommended ventilation rates due to their dependence on both macro and micro climate wind speeds. This work examines the feasibility of achieving the recommended fresh air delivery rates without impacting on the devices energy requirements. A numerical investigation is carried out using a standard passive stack device geometry combined with a simulated low powered axial fan. The investigation shows that a low induced pressure of 20 Pa is enough to satisfy the legislative requirements. Depending on the macro climate conditions, this induced press could be generated from a commercially available solar powered system. As the fan system is only used in periods of low external wind velocities (1 m/s), it is termed a passive-assisted stack.
Introduction
The ventilation of buildings is an essential design consideration for reasons of health and safety. The minimum recommended fresh air requirements for buildings are set out in British Standards (BS) and are applicable depending on the intended usage and occupancy levels. The BS5925 in 1991 sets out the minimum fresh air requirements for naturally ventilated buildings [1]. Recent political and ecological developments have led to legislative constraints being placed on buildings energy consumption. As mechanical ventilation systems being a large energy consumer, an alternative system is now desirable [2].
There are two main ventilation strategies, namely mechanical and natural. Mechanical ventilation is the most commonly used form, as it offers on demand and controllable delivery rates. Natural ventilation relies on the external wind conditions to deliver the required fresh air supply and these are unpredictable and unreliable, making this a less desirable option [3].
Many devices are used for natural building ventilation; one common device is a natural ventilation stack shown in figure 1. The stack device sits at the top of the building or room and acts as both as a fresh air inlet and extract. As warm air rises from the room and exiting through the stack, a negative pressure is created in the receiving room and draws in the external fresh air supply. The flow of air through the device is further assisted by the windward and leeward pressures exerted on it by the external wind speed. The rate and the direction at which the air flow is delivered to the receiving room is controlled by utilising mechanical dampers placed upstream a static ceiling diffuser. The mechanical dampers are a set of air vanes that could be controlled either manually or mechanically. The dampers position range from fully closed to fully open position.
Fresh air in Stale air out
PLAN VIEW
Fresh air in Stale air out
Figure 1Cross section of a standard passive stack device (Courtesy of BSRIA)
The stack system may further sub categorised into two types; namely passive and active. A passive stack applies no mechanical force to induce the flow through the device. An active stack utilises a mechanical force to create or direct the flow through the device. The active stack provides confidence to engineers that the required air supply rates will be achieved, but does offer the level of energy consumption savings of a passive stack.
A hybrid device which offers the mechanical assistance of the active stack without
compromising the energy consumption level of the passive stack is an attractive option [4] and may be termed a passive-assisted stack. In this study, the feasibility of a passive device utilising a low solar powered axial is investigated. The fan is only utilised at low external wind speeds and is passively idle when not required.
A numerical investigation using Computational Fluid Dynamics (CFD) software was carried out to ascertain the fan pressure required to achieve the British Standards fresh air supply rates. Furthermore, the CFD numerical results were validated using far field pressure experimental data obtained from a class room at Sheffield Hallam University. Different locations of the fan are examined, as during the investigation it was evident that even at low pressures the air supply rate was excessive. Consequently, the control dampers work over time to restrict the amount of air flow. The dampers would have to be
electrically driven to a near closed position.
The resulting hybrid design utilised commercially available parts. The solar system comprises a low powered fan driven by a low voltage battery, with the charge supplied from a solar panel to achieve the passive-assisted stack.
2. Previous related work
Work related to specific natural ventilation devices and in particular stack systems is scarce. However, the following is a brief review of previous work related to this study.
Jaboyedoff, et al. [2], carried out research to analyse the indoor air quality and energy consumption levels of heating and cooling in administrative buildings. The work
developed models to accurately compare mechanical and natural ventilation strategies in various climates and internal conditions. The associated simulations show that the average temperature during occupation is lower in the naturally ventilated building. In addition, a naturally ventilated building (at least at night) shows a lower temperature distribution than a low flow mechanically ventilated building. The heating energy consumption is not higher as the gains during occupancy are sufficient.
The work supported the development of naturally ventilated systems and recognised the potential of such systems. Never the less, the work did not consider stand-alone units or consider the location and design of such units.
The active stack consisted of a fan installed on top of stack to create a pressure drop and induce the airflow inside the rooms. The passive stack was an identical device without the fan. The investigation found that the passive stack showed minimal air movement in the smoke visualisation test. Therefore, the study concluded that it failed to improve
ventilation. However, the active stack showed that internal velocities increased with increased fan speed. The work determined that the active stack provides substantial increase in the internal air velocities, and that the velocities increase in proportion to the increase in stack size.
Elmualim [6], investigated the CFD modelling of a modern wind catcher device. The CFD results were compared to wind tunnel tests to ascertain its effectiveness. The work focused on a commercially available wind catcher device and tested the ventilation rate achieved by the device for varying wind incident angles in a wind tunnel. The analysis was
compared to that of a simulated device subject to CFD investigation. Elmualims research concluded that good correlation between CFD and experimental work was evident.
However, the CFD analysis did not include a full geometrical representation of the device, due to the computational complexity and assumed a flow rate through the device inlet based on orifice theory.
Hughes and Ghani [7], investigated the effects of varying external wind conditions on the Windvents ability to supply outside air at the recommended rates. The results showed that the device is capable of delivering the required fresh air supply. However, at low external wind speeds of 1 m/s, the device failed to achieve the minimum BS fresh air delivery rates. Elmualim [8], attempted to analyse a control strategy, which combined a wind catcher and hybrid air conditioning unit. The investigation was to assess the contribution of the device to indoor air environment and energy savings. However, the equipment deployed to record both the macro and micro climatic variations failed.
Shun and Ahmed [4], combined a turbine ventilator with a solar powered motor to create a hybrid device. The device was tested experimentally at various motor voltage supply and wind speed to ascertain the feasibility of such a device. The study showed that the hybrid ventilator was feasible and provided increased ventilation rates at low or zero external wind velocities. However, the work did not examine the size of the required fan or induced pressure that would be needed to meet current legislative guidelines. No attempt was made to ascertain the optimum location of either the device or its components.
Previous research has established the effectiveness of using CFD as a numerical tool for this type of device and as such has been used for the purpose of this paper. Although previous work has yielded useful results, it did not investigate the feasibility of utilising a solar powered low voltage fan to achieve recommended fresh air supply rates during low external wind conditions.
This study investigates the effective utilisation of induced fan pressure required to achieve minimum natural ventilation rates during low external wind conditions (1 m/s). In addition, it examines the location of the fan to ensure the additional flow generated would not
3. CFD set up
The CFD model was developed using FLUENT, a commercially available general-purpose code. This code uses the Finite Volume Method (FVM) approach and employs the Semi-Implicit Method for Pressure-Linked Equations Consistent (SIMPLEC) velocity-pressure coupling algorithm. The turbulent nature of the flow is modelled utilising the standardk-e
model. The standardk-emodel is considered to be the most appropriate for this application [9, 10, 11, 12]. The governing equations used are the Navier-Stokes and the energy
equation which are available in detail in [13].
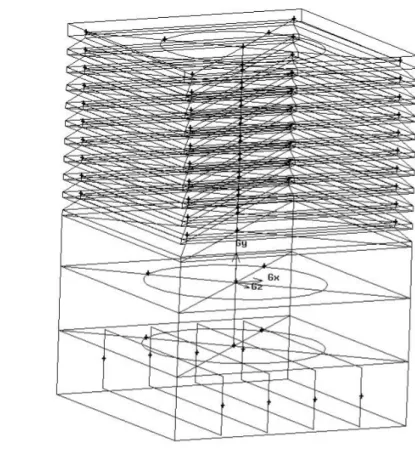
The Wind vent geometry was created using the Pro-engineer software and then imported into GAMBIT (FLUENT pre-processor) which was used to create the additional geometry, with a 6000 x 6000 x 3000mm (500mm false ceiling height) micro climate representing a small classroom of a standard occupancy of twenty persons. The Windvent geometry, as illustrated in figure 2, was a 1000 x 1000 mm Windvent including cross dividers and damper faces, centrally placed above the room shown in Figure 2.
Figure 2The Gambit geometry for the Windvent
Cross dividers
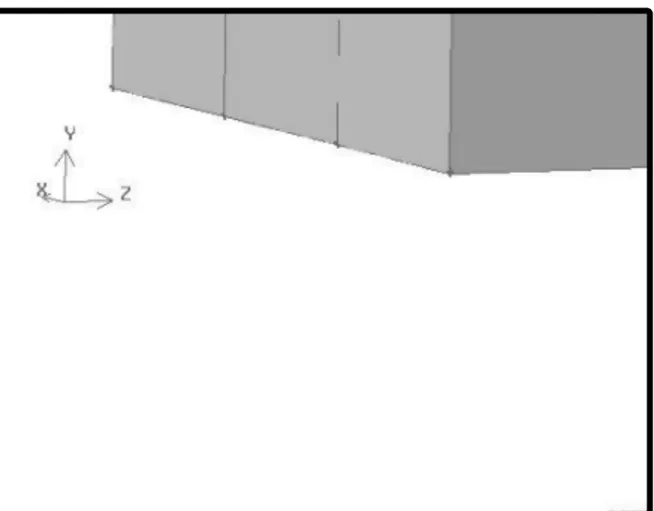
In order to obtain sufficient distance between boundary conditions, the macro climate was sized appropriately [14] and consists of a 6000 x 6000 x 4000 mm volume placed directly above the microclimate, thus creating a direct interface through the Windvent geometry, shown in figure 3.
Figure 3Gambit geometry for the windvent connected to Micro and macro climates
3.1 Boundary conditions
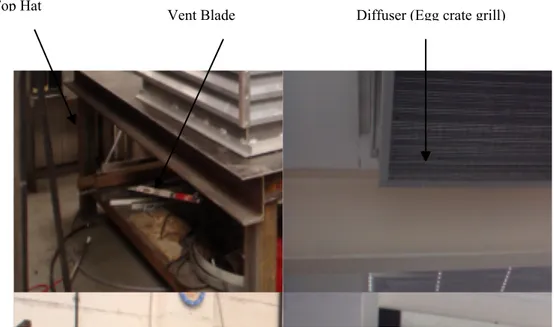
Figure 4 shows an external view of the stack device. It also shows the diffuser or egg crate grill which has been modelled using a porous jump boundary condition. The porous jump boundary condition model acts as thin membrane or filter with user defined inputs of permeability and medium thickness. A tertiary term of pressure jump coefficient is available to the user for this type of boundary condition, however as a reliable coefficient is currently unavailable, the software reduces to the Darcy's law in the absence of this input [9].
The diffuser is the final interface between the macro and micro climate. The recorded average velocity values through this face are used to determine the delivery velocity in the results section of this paper.
Velocity Inlet
Pressure Outlet Macro climate
Windvent
False ceiling
Figure 4Windvent and Diffuser
The macro climate created, to simulate the incident wind velocity may be seen in figure 3, consists of a velocity inlet (value of 1 m/s) at one complete side, and a pressure outlet (atmospheric pressure) on the opposing side. The remainder of the macro climate faces were named as symmetry faces, thus alleviating any return velocities which may distort the results.
The fan was created as a 500 mm face in three different locations, and assigned the boundary condition of a standard fan as defined in FLUENT, shown in figure 5. Once imported into FLUENT, the direction was assigned and remained constant with the direct pressure applied varied for a range of 20,40,60,80, and 120 Pa in line with the available pressure range of a low voltage fan [16].
3.2 Grid adaption
Due to the geometrical complexity, the computational mesh was generated using triangular elements. In order to accurately resolve the solution fields, the grid was refined and
enriched using thehp-method [15]. This process of adaption requires a decision as to the usage ofh-refinements (the mesh size) orp-enrichments (higher order approximations) by the use of a posteriori error estimate. The posteriori estimate used in the developed model is the average weighted velocity taken on the face between the Windvent and the micro climate. An initial coarse grid was evaluated, and subsequent refinements were carried out until the error deemed negligible between refinements. When refining the grid, a
compromise must be reached, between accuracy and computational time. The boundary conditions were fixed throughout this process to ensure accurate comparison of the error indicator. The initial coarse grid consisted of 860,166 elements and was refined over three stages. until an acceptable error of 0.01% was achieved with a total of 1,216,987 elements.
The model was split into three refined areas, Windvent (stage 1), macro climate (stage 2) and micro climate (stage 3), and each area refined as illustrated in figures 7, 9 and11. Stage
Fan middle position
Fan bottom position Fan top position
Figure 5 The position of fan faces in the Gambit geometry
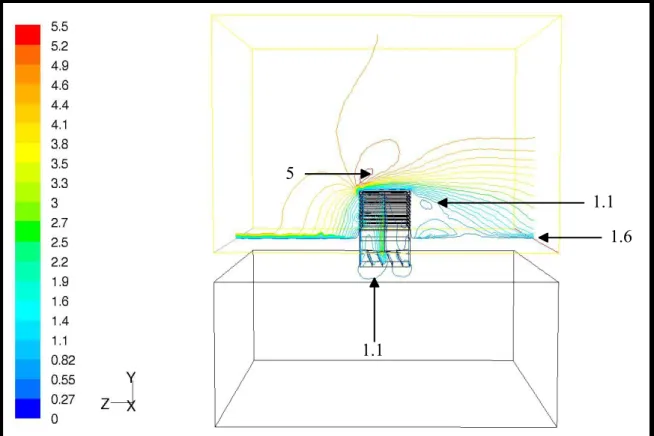
1 of the grid adaption concentrates on the Windvent and immediate surroundings as illustrated in figure 6.
Figure 7Illustration of velocity contours after stage 1 grid adaption
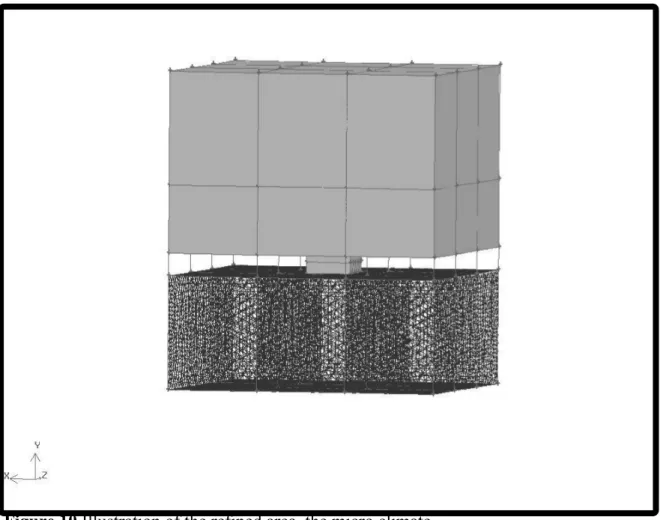
Stage 2 of the adaption concentrates on the macro climate leaving the remaining cell sizes constant (see figure 8).
5
1.1
4.3
Figure 8Illustration of the refined area, the macro climate.
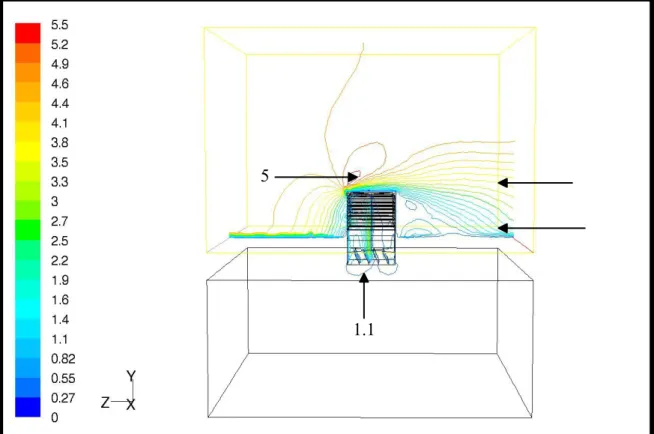
Figure 9Illustration of velocity contours after stage 2 grid adaption
Stage 3 of the adaption concentrates on the micro climate leaving the remaining cell sizes constant (figure 10).
5
1.1
Figure 10Illustration of the refined area, the micro climate.
Figure 11Illustration of velocity contours after stage 3 grid adaption
4. Results
4.1 Validation
The CFD results were validated against far field experimental testing carried out at Sheffield Hallam University (figure 12). The Windvent was constructed to specifically recreate the exact geometry used in the simulation, with care taken to install into a microclimate of the same geometrical construction as described in section 3.0.
Figure 12Experimental testing set up of the Windvent at Sheffield Hallam University 1.1
5
3.5
The acquired results of the experimental results have been compared with the CFD simulation to validate the work and are shown in figure 13. The figure shows the average air velocity at five points in a plane just downstream the device dampers.
Figure 13Comparison of CFD and Experimental testing of the Windvent at 5m/s. The results shown in figure 13 show a good agreement between the simulation and experimental work with an average error of 3.2% and a maximum error of 10%. Full details of the experimental work and validation are found in Hughes (2009) [16].
In addition, the CFD results were validated against recent research carried out by Elmualim [6] on a wind catcher by using both CFD and wind tunnel testing. The wind catcher used in the Elmualim’s study utilised similar device of the same geometrical construction and the simulation utilising the same CFD code and model set up. The results have been
Figure 14Comparison of normalised flow rates from the CFD results from the two studies
4.2 Flow visualisation
The FLUENT flow analysis illustrates the effective movement of the fluid (air) according to the boundary conditions assigned by the user. Figure 16 shows the pressure contours in the receiving room and the Windvent respectively.
Figure 16Resulting pressure contours of the passive-assisted stack system with 20Pa induced fan pressure.
The contours may also be expressed as velocity contours as shown in figure 17. The flow enters the Windvent, where the pressure is increased via the fan (boundary condition) and forced into the receiving room.
20
4
2.1
Figure 17The velocity contours of assisted-passive device with 20 Pa induced pressure
Figure 18 illustrates the fresh air supply in velocity vector form. The initial inlet velocity (1 m/s) travels from the left hand side, with the flow being split as it reaches the Windvent. Some of the air enters the Windvent before being forced into the receiving room via the fan in middle position, with the remaining air shearing above the device and exiting at the outlet on the right hand side.
1
0.3 2
Stagnant Zone
Figure 18The calculated fresh air flow path of assisted-passive device with 20Pa induced fan pressure
4.2.1 Fan located at top position
Figure 19 depicts the velocity vector plot of the flow with the fan in top position. The flow is drawn into the fan and tunnelled centrally through the Windvent into the room below, whilst allowing exhaust or spent air to exit via the bottom blades of the Windvent. The flow induced by the fan within the device allows the exhaust air to exit via two areas either side of the fan controlled air jet entering the room.
1
5 0.8
Figure 19Fresh air flow path with fan in top position with 20Pa induced fan pressure.
4.2.2 Fan located at middle position
As illustrated in figure 20, the middle position shows the flow is separated in the left hand quadrant, due to the effect of the fan creating eddies and restricting the natural flow path. In addition, there is no clear path for the exhaust air to exit back to atmosphere.
As there is no clear area for the exhaust air to exit through the vent, it is re-circulated around the room by the effective fan pressure. In the middle position the fan is no longer supplying the fresh air from the left hand quadrant, thus minimising the make-up air.
3.8
0.27
1.7
Figure 20Fresh air flow path with fan in middle position with 20Pa induced fan pressure.
4.2.3 Fan located at bottom position
Figure 21 illustrates the effect of the fan in the bottom position. The results show that in this position, both quadrants demonstrate significant flow separation due to eddies causing restriction to the natural flow path. Again in this position, the exhaust air from the
receiving room has no clear path to exit the Windvent.
As there is no clear area for the exhaust air to exit through the vent, it is re-circulated around the room by the effective fan pressure. In the bottom position, the fan is no longer supplying the fresh air from either quadrant. This set up has decreased the fresh air supply capabilities of the device from the middle fan positioning.
0.27
3.8
Figure 21Fresh air flow path with fan in bottom position with 20Pa induced fan pressure.
4.3 Calculated results from CFD simulations
Table 1 is the benchmark for the investigation and shows the numerically investigated performance of a passive stack in external wind speeds of between 1-5 m/s. At 1 m/s the stack fails to supply the minimum required L/s per occupant, 5 L/sec, [7].
Table 1 Standard Windvent performance
External Wind L/sDiffuser L/sPer occupant L/sPer m2
1 90 4.5 2.5
2 210 10.5 5.83
3 340 17 9.44
4 470 23.5 13.05
5 650 32.5 18.05
0.27 0.27
Table 2 shows the results of the six CFD models with the fan in top position run with varying fan pressures (range 20 - 120 Pa), with the delivery rates expressed in both occupancy and area denominations for comparison with the BS5925:1991
recommendations.
Table 2 Hybrid Windvent with fan in top position
Pressure (Pa) L/sDiffuser L/s Per occupant L/sPer m2
20 370 18.5 10.27
40 1450 72.5 40.27
60 1810 90.5 50.27
80 2100 105 58.33
100 2360 118 65.55
120 2590 129.5 71.94
Table 3 shows the results of the six CFD models with the fan in middle position run with varying fan pressures (range 20 - 120 Pa), with the delivery rates expressed in both occupancy and area denominations for comparison with the BS5925:1991
recommendations.
Table 3 Hybrid Windvent with fan in middle position
Pressure (Pa) L/sDiffuser L/sPer occupant L/sPer m2
20 2220 111 61.66
40 3010 150.5 83.61
60 3560 178 98.88
80 4150 207.5 115.27
100 4680 234 130
120 5160 258 143.33
Table 4 shows the results of the six CFD models with the fan in bottom position run with varying fan pressures (range 20 - 120 Pa), with the delivery rates expressed in both occupancy and area denominations for comparison with the BS5925:1991
Table 4 Hybrid Windvent with fan in bottom position
Pressure (Pa) L/sDiffuser L/sPer occupant L/sPer m2
20 2230 111.5 61.94
40 3180 159 88.33
60 3750 187.5 104.16
80 4310 215.5 119.72
100 4830 241.5 134.16
120 5320 266 147.77
Figure 22 illustrates the total fresh air delivery rates supplied by the Windvent to the receiving room. The graph shows the results of the three fan positions for comparison. The x -axis shows the boundary condition pressure of the fan (Pa), while the y -axis expresses the FLUENT calculated fresh air supply rate.
Figure 23 illustrates the fresh air delivery rates in terms of L/s per occupant supplied by the Windvent to the receiving room. The graph shows the results of the three fan positions for comparison. The x -axis shows the boundary condition pressure of the fan (Pa), while the y -axis expresses the FLUENT calculated fresh air supply rate.
Figure 23Analysis of fresh air supply rates per occupant at three different fan positions for 20 occupants.
Figure 24 illustrates the fresh air delivery rates in terms of L/s per m2supplied by the
Figure 24Analysis of fresh air supply rates per m2at three different fan positions for a
36m2receiving room.
5. Discussion
The BS minimum fresh air delivery rates are specified as 0.8 L/s per m2and 5 L/s per
occupant [1]. The occupancy level for this investigation was 20 occupants which is the recommended level for a small classroom [14]. From Table1, it is clear that when the external wind velocity is 1m/s, the Windvent does not meet the criteria for the amount of occupants and therefore this issue needed to be addressed [7].
In this study, a total of 18 CFD models were created covering a pressure range of 20 - 120 Pa, in three different locations. The results show that in each of the three locations a fan pressure of 20Pa assists the external wind velocity (1 m/s) to achieve the BS criterion. The fan in top position creates the smallest increase in fresh air supply from 4.5 to 18.5 L/s per occupant at a fan pressure of 20 Pa. The flow visualisation of these results (figure 19) shows that the fan draws in fresh air whilst allowing the receiving rooms exhaust air to exit via two channels either side of the fan. Using higher fan pressure would require an
fresh air (external) is restricted in one quadrant, and the exhaust air (room internal) has no natural path to exit the Windvent. Figure 21 shows that at the bottom fan position, the restriction in both quadrants and again there is no return path for the exhaust air.
The flow visualisation results for the middle and bottom fan position show that although the rate at which the air is delivered into the room has increased, little fresh make-up air is drawn into the room. The air is re-circulated by the fan in these two positions and therefore the Windvent does not meet the BS requirements.
6. Conclusion
From the results, it was clear that a low voltage fan would need to produce a minimum pressure of 20 Pa to achieve the BS required minimum ventilation rates. The fan should be located in the top position to ensure fresh air is drawn in at low external wind speeds (1 m/s) and delivered to the receiving room without restricting the exhaust air flow path. The CFD work has been validated using experimental testing and shows good agreement with the simulation results. The study showed that the CFD is a useful tool for
investigating the possibilities of a proposed hybrid device prior to prototype building and testing, shown in Figure 25.
Figure 25Custom built passive-assisted device courtesy of Midtherm Engineering Ltd.
Acknowledgements
The authors would like to acknowledge the support of the EPSRC, Midtherm Naturally Driven Ltd and The Whitworth Society in carrying out this investigation.
References
1 BRITISH STANDARDS INSTITUTION 1991. BS5925:1991:Ventilation principles and designing for natural ventilation. London, British Standards Institution.
2 JABOYEDOFF, P., C. -A. Roulet b, V. Dorer c, A. Weber c and A. Pfeiffer. (2004). Energy in air-handling units - results of the AIRLESS European project. In: Proceedings of the International Conference on Solar Energy in (CISBAT 2001),
Oct 3-4 2001. Lausanne, Switzerland, Elsevier Ltd, 391-399.
3 SANTAMOURIS, M. and ALLARD, F (2002).Natural ventilation in buildings A design handbook.London, James and James.
4 SHUN, S and AHMED A.N (2007). Utilizing wind and solar energy as power sources for a hybrid building ventilation device. Renewable Energy July 2007.
5 PRIYADARSINI, R., CHEONG, K. W. and WONG, N. H. (2004). Enhancement of natural ventilation in high-rise residential buildings using stack system. Energy and buildings, 36 61-71.
6 ELMUALIM, Abbas A. (2006). Dynamic modelling of a wind catcher/tower turret for natural ventilation. Building services engineering research and technology, 27 (3), 165-182.
7 HUGHES, B. R. and GHANI, S. A. A. A. (2008). Investigation of a wind vent passive ventilation device against current fresh air supply recommendations.
Energy and buildings,40(9), 1651-1659.
8 ELMUALIM, Abbas A. (2006). Failure of a control strategy for a hybrid air-conditioning and wind catchers/towers system at Bluewater shopping malls in Kent, UK. Emerald 24 399-411.
10 AYAD, Samir S. (1999). Computational study of natural ventilation. Journal of wind engineering and industrial aerodynamics, 82 (1-3), 49-68.
11 DRORI, U. and ZISKIND, G. (2004). Induced ventilation of a one-story real-size building. Energy and buildings, 36 881-890.
12 ELMUALIM, Abbas A. (2006). Verification of design calculations of a wind Catcher/Tower natural ventilation system with performance testing in a real building. International journal of ventilation, 4 (4), 393-404.
13 LI, Liu and MAK, C. M. (2007). The assessment of the performance of a windcatcher system using computational fluid dynamics. Building and environment, 42 (3), 1135- 1141.
14 Department for Education and Skills Briefing framework for secondary school projects (2006). Building Bulletin 98. United Kingdom.
15 CHUNG, T. J. (2002). Computational fluid dynamics. Cambridge, University press.
16 HUGHES, B.R (2009). Performance Investigation of a Naturally Driven Building Ventilation Terminal. PhD, Sheffield Hallam University.
17 Remco products ltd. (2007).[online]. Last accessed 15 October 2007 at:http:// www.remco.co.uk/products/axial/page39.htm