EC-CHINA:
A STATISTICAL ANALYSIS
OF FOREIGN TRADE
1970-1979
eurostat
DE EUROPÆISKE FÆLLESSKABERS STATISTISKE KONTOR STATISTISCHES AMT DER EUROPÄISCHEN GEMEINSCHAFTEN STATISTICAL OFFICE OF THE EUROPEAN COMMUNITIES OFFICE STATISTIQUE DES^COMMUNAUTÉS EUROPÉENNES ISTITUTO STATISTICO DELLE COMUNITÀ EUROPEE
BUREAU VOOR DE STATISTIEK DER EUROPESE GEMEENSCHAPPEN
Luxembourg-Kirchberg, Boîte postale 1907 - Tél. 4 30 11, Télex: Comeur Lu 3423 1049 Bruxelles, Bâtiment Berlaymont, Rue de la Loi 200 (Bureau de liaison)-Tél. 7 35 80 40
Denne publikation kan fås gennem de salgssteder, som er nævnt på omslagets tredje side.
Diese Veröffentlichung ist bei den auf der dritten Umschlagseite aufgeführten Vertriebsbüros erhältlich. This publication is obtainable from the sales agents mentioned on the inside back cover.
Pour obtenir cette publication, prière de s'adresser aux bureaux de vente dont les adresses sont indiquées à la troisième page de la couverture.
Per ottenere questa pubblicazione, si prega di rivolgersi agli uffici di vendita i cui indirizzi sono indicati nella 3a pagina della copertina.
EC-CHINA:
A STATISTICAL ANALYSIS
OF FOREIGN TRADE
1970-1979
CE-CHINE:
UNE ANALYSE STATISTIQUE
DU COMMERCE EXTÉRIEUR
The publication is also available in the following languages: Cette publication est éditée aussi dans les versions suivantes: DE/IT: ISBN 92-825-2308-X
Cataloguing data can be found at the end of this volume Une fiche bibliographique figure à la fin de l'ouvrage
Luxembourg: Office des publications officielles des Communautés européennes, 1981 ISBN 92-825-2307-1
Cat.: CA-32-81-027-2A-C
Reproduction of the contents of this publication is subject to acknowledgement of the source La reproduction des données est subordonnée à l'indication de la source
T A B L E O F C O N T E N T S
P r e f a c e 5
G r a p h of E C trade w i t h C h i n a (i
I n t r o d u c t i o n 7
1. S O C I O E C O N O M I C DATA O N C H I N A !)
2 . C H I N A ' S E X T E R N A L T R A D E 11
2 . 1 . G e n e r a l t r e n d s 1 I
2.2. Structure of trade by country 1 1
2.3. Structure of trade by type of goods 12
2.3.1. Structure of imports 12
2.3.2. Structure of exports 1 3
3. M A I N T R A D I N G P A R T N E R S ' T R A D E W I T H C H I N A 1 (j
3.1. Japan 1 K
3.2. Hong Kong 1Í!
3.3. USA ι o
3.4. Australia 2(1
3.5. Canada 20
3.6. Singapore 21
3.7. European COMECON countries 22
4. THE COMMUNITY'S TRADE WITH CHINA 23
4.1. Pattern of overall trade 23
4.1.1. General trends 2 3
't. 1.2. Imports 2 3
4.1.3. Exports 24
4.1.4. Balance of trade 24
't.2. Structure of Community trade with China by country 25
4.2.1. Volume of trade 25
4.2.2. Structure of imports 25
4.2.3 Structure of exports 26
4.2.4. Balance of trade 27
4.3. Structure of Community trade with China by type of goods 27
4.3.1. Structure of imports 27
4.3.2. Structure of exports 28
5. GREECE'S TRADE WITH CHINA 30
6. CHINA'S EXTERNAL TRADE IN I98O 31
List of tables 3 2
Selected SITC Rev. 2 definitions 33
Selected NIMEXE definitions 34
ANNEX
List of abbreviations of EC Member States " >
P R E F A C E
In this publication, EUROSTAT presents a brief analysis of the external
trade with China and its relations with the European Community.
The country's efforts to modernize and to open its economy to the outside
world can be seen from the most recent statistics available to EUROSTAT.
For the first time EUROSTAT has been able to use statistics published by
institutions of the People's Republic of China: This data has been
indispensible in understanding the recent structure and development of
the economy of this country as well as its trading relations with the
outside world.
To complement this information, which was nontheless limited, EUROSTAT
has used the trade statistics of partner countries, notably the EC. An
analysis of the most recent developments in EC trade with China (I980)
also forms part of this publication.
February I98I
Trade of the EC with the People's Republic of China
Commerce de la CE avec la République populaire de Chine
M i oECU 2200
2000
1S00
1600
1400
1200
1000
800
600
200
400 '
* » ^
1958 1959 1960 1961 1962 1963 1964 1965 1966 1967 1968 1969 1970 1971 1972 1973 1974 1975 1976 1977 1978 1979
i m p o r t
export
Mio ECU 0
I978
200 400 600 800 1000 1200 1400 1600 1800 2000
1979
2200 0, 1 : FOOD, BEVERAGES AND TOBACCO
3: FUEL PRODUCTS 2, 4: RAW MATERIALS 5: CHEMICALS 7: MACHINERY AND TRANSPORT EQUIPMENT 6, 8: OTHER MANUFACTURED GOODS 9: GOODS NOT CLASSIFIED
0, 1 : PRODUITS ALIMENTAIRES, BOISSONS ET TABACS 3: PRODUITS ENERGETIQUES
2, 4: MATIERES PREMIERES 5: PRODUITS CHIMIQUES
7: MACHINES ET MATERIEL DE TRANSPORT 6, 8: AUTRES PRODUITS MANUFACTURES
INTRODUCTION
χ)
Since the events of 1976 there have been significant and rapid changes in
China's economic policy. As one of the results of the shift from an ideological
to a more socio-economic oriented line, greater importance has again been attached
to planning, and therefore to statistics. At the same time a more open publicity
policy has been adopted, resulting in the current availability of a whole range of rinta which car, be used to assess V:oth the general economic situation and the economic structure and development of the country. However, the steady - albeit fragmentary - publication of statistics has not yet been matched by the laying down of clear economic objectives, guidelines and methods for achieving then;.
(2)
Although the principle of the four modernizations still applies, the methods of implementing them have changed in different ways. One of the original precepts was equal development of agriculture, light industry, the energy sector and heavy industry. Nowadays, however, greater priority is given to agriculture and light industry on account of their special contribution to the improvement of the standard of living. Apart from its importance for the rapidly growing domestic market another reason for the priority given to light industry is the expansion in export markets.
China is in a period of rethinking, reorganization and restructuring. A number of difficult problems still await a solution: a budget deficit ' , a trade balance in the red and the lack of infrastructure in the broadest sense are all hampering economic development.
On 7 September I98O Hua Guo feng announced the end of the old ten-year plan in his speech to the 5th National People's Congress. This plan was the basis of the modernization campaign and was scheduled to run from 1976 to 1985· Hua stated that the desire 'to make up for losses as quickly as possible' and 'revolutionary enthusiasm' had led to an underestimation of the difficulties involved in the reconstruction and development of the national economy: 'As a result many targets were set too high, the scale of investment was too great, and attention was not paid to a satisfactory balance between
(4)
the projects' . Since a revision of the old plan seemed pointless after four out of ten years, the National Council replaced it with a new ten-year outline plan for 1981-1990. The provisional core of the draft plan is the 6th five-year plan (I98I-I985), in which, according to the Deputy Prime Minister and Head of the State Planning Authority, Yao Yilin, special consideration is to be given to the following :
(1) Death of Zhou Enlai (8th January); fall of Deng Xiaoping (April), period of greatest influence of the "gang of four" (Summer), death ofMan Zedong(9 Sept.) and fall of "gang of four"(October). (2) The "four modernizations" embrace the general and intensive modernization of agriculture,
industry, national defense and science and technology which had been proposed by Zhou Enlai in 1975t re-iterated by Deng Xiaoping at the end of 1977 and confirmed by the 5th National People's Congress in March 1978.
(3) The deficit for 1979 was put at 8.5 thousand million ECU, a large proportion of which was due to the exceptional burden of the war with Vietnam. The estimated deficit of 3-7 thousand million ECU for I980 was corrected by Prime Minister Zhao Ziyang in December to over 4.6 thousand million ECU (Financial Times of 30.12.198o, p.3).
(4) Beijing Rundschau, No 38, I980 p. 13
- stable growth - realistic targets
- promotion of agriculture and light industry - expansion of energy and transport capacity - training of skilled persons
- limitation of foreign projects to those commensurate with domestic capacities - limitation of population growth
- construction (including urban housing)
As far as the budget deficit is concerned, according to Finance Minister Wang Bingqian the main cuts should be in expenditure on the development of heavy industry and on defence
The first chapter gives a review of the main economic and short-term indicators published. This is followed by an overall analysis of China's trade. The trade of China's main trading partners with the People's Republic is dealt with in Chapter Three, which is followed by a detailed examination of trade between the European Community and China. The final chapter presents a brief analysis of China's trade relations with Greece and the development of its overall trade in I980. The present
(7)
study can be regarded as a follow-up to earlier EUROSTAT analyses of China's external tradeAs in the case of these earlier publications, the limitations arising out of the use of trading partners' statistics and in the calculation of the volume of trade between state-trading countries also apply here.
: In the comparison between countries attention must also be paid to differences in methodology and definitions. For example, some countries use the concept of special trade, while others use that of general trade, etc. The following sources were used:
EUROSTAT statistics.
The GATT data bank, based on U.N. statistics, extraction carried out by EUROSTAT, national publications, the monthly bulletin "Statistics of Foreign Trade" of the OECD as well as the publications of Western countries.
So as to facilitate comparisons all values are given in European Units of Account(ECU).
A table of exchange rates can be found at the end of this publication.
(6) Beijing Rundschau, No 39, 1980
1. SOCIO-ECONOMIC DATA ON CHINA
The first extensive statistical information for 20 years was published by the 'Central Statistical Office' in its communiqué on the achievement of the 1978 national economic plan targets . Since
(2)
then various more recent and supplementary data have been published . A selection is given in Table 1 in the Annex.
As early as mid-1979 the ' readjustment policy ' , which was originally scheduled to run for three years and which has now been further prolonged, was
I ?. 1 ( hr )
introduced ' " . Its aims were to regulate proportionality in the national economy , to make a start on reforming the administrative structure of the economy, to reorganize existing companies and to raise the level of economic activity. For the external economy an expansion of exports and an increase in imports in keeping with the volume of exports were called for. Imports were to be confined to certain key areas, i.e. more technical know-how and less equipment ('We must buy hens which lay eggs') . Gu Ming, Deputy Chairman of the State Planning Commission, said:
'Owing to lack of experience we were too hasty in importing certain types of plant when we were not in a position to integrate them to the desired extent and to provide the neceesary ancillary equipment. We will now remedy this.' There were to be no fundamental changes to the policy of technology imports, which was merely to be improved, placed under uniform State planning and made more balanced, i.e.
imports were to be in line with exports and the ability to repay in foreign currency taken into account;
the number of imported plants had to be in keeping with construction capacity and there had to be guaranteed supplies of ancillary equipment, raw materials and energy;
there had to be sufficient capacity (e.g. in terms of operating and management) to handle (7)
the imported plants.'
Priority was to be given to projects 'which the State urgently needs, require little investment, are (7)
quickly paid off and are profitable' . They were to be financed increasingly by means of compensation trade, joint production and processing contracts.
The temporary success of the read justa! ent policy can be seen to some extent from the published official economic figures (see Table 1 in the Annex), which indicate a cyclical downturn in 1979. As a result, the rate of growth in the gross value of industrial production slowed down. Production of a number of important industrial goods fell (machine tools, manual tractors, goods wagons) or was virtually stagnant (coal, crude petroleum). The rates of growth for other products were considerably lower than in the previous year (steel, pig iron, ships, sugar). Only for artificial fertilizers, motor vehicles and consumer goods (bicycles, sewing machines, watches) was the rate of growth higher than in I978. Indeed, production of television sets went up more than two and a half times (see Table 1 in the Annex).
(1) Beijing Rundschau, No 27, 1979
(2) e.g. in the 1979 report on the achievement of national economic plan targets (Beijing Rundschau, Nos 16, 19 and 20, I980), in the report on the I980 and I98I national economic plans (Beijing Rundschau, No 38, I980) and in the report on the budget (Beijing Rundschau, No 39, I98O) (3) See Beijing Rundschau, No 26, 1979 and China Reconstructs, No 7, 1979
(4) This concerne imbalances in the relations between: - agriculture and industry; - light and heavy-industry; - accumulation and consumption; - within heavy industry itself.
The impact of the readjustment policy (see national economic plans for I980 and 198I Table 1 in the Annex) may also be seen in the production figures for the first six months of I980. Although the growth in the gross value of industrial production was higher in the first half of I98O than in 1978 and 1979, this was due entirely to the sharp leap in the output of light industry, as there was a further fall in the rate of growth for heavy industry.
In agriculture the adjustment process likewise resulted in a decline in growth, although the fluctuations were much slighter.
These figures match the objectives of the readjustment policy to a great extent, where agriculture represents the 'main link in the chain' and is to be given priority for development, together with light industry.
The picture for external trade is very similar. Calculated in Yuan, the value of exports went up by 26.39é between 1978 and 1979 (1978/77: + 2030 and by 27$ between 1979 and I980.
In the same period the growth rates for imports were as follows:
1978/77: 41.12Í 1979/78: 29.6% 1980/79: 15.2g
The proportion of exports accounted for by heavy industry, which include mining products and crude
petroleum, went up to Jil.9% in 1979 (1978: 25.5^)· At the same time light industry's share fell from
46.9% in 1978 to 45^ in 1979 and that of agriculture from 27.6g to 23.1g.
On the import side the main increases were in purchases of complete plants, consumer goods and raw materials for the textile and light industries. On the other hand, there was a fall in imports of rolled steel, non-ferrous metals, pig iron and iron ores.
Although the trend outlined above basically confirms the new economic policy in June 1979, the Chinese leadership takes the view that theeconomic adjustment process introduced has not yet been fully effective*and is therefore to be extended beyond I981. Yao Yilin and other leaders have indicated that it will last until at least I983 and will encompass five main objectives:
- reduction of the scale of important large projects; - elimination of the budget deficit;
- stabilization of prices;
- improvement of the balance between agriculture, light industry and heavy industry; - better utilization of energy resources.
CHINA'S EXTERNAL TRADE
2 . 1 . General trends
Since China still does not publish any detailed data on external trade, calculations based on trading partners' statistics must be used. According to these, the value of China's trade in ECU increased almost sixfold between 1970 and I980 (see Table 2 in the Annex).
In the early 1970s there was only a slight increase in trade. With the establishment of diplomatic relations with the USA in 1972 and the stepping-up of economic development by Zhou Enlai, coupled with a cautious opening-up to the outside world, greater importance was again attached to trade with other countries. The aim was to learn from foreign countries, i.e. to import technical know-how to be financed by exports. As a result, trade increased in 1972 and leapt ahead in 1973 and 1974. The increase in internal political conflicts, which also concerned the issue of the right degree of external relations, led in subsequent years to a decline in the growth of exports and a fall in imports. The death of Mao Zedong in September 1976 marked the beginning of a new upward trend, dominated by the growth in imports resulting from pent-up demand and the ambitious objectives laid down by the old ten-year plan and the 'four modernizations'. On the basis of Chinese cif imports, the biggest deficits were in 1974 and the last three years. Whereas foreign currency surpluses of l,8l3 million ECU were earned for external tra'de between 1970 and 1977, deficits totalling 2,852 million ECU were recorded between 1978 and I98O, giving a deficit of 1,039 million ECU for the whole period. This shortfall was covered by non-commercial foreign currency inflows (e.g. transfers from Chinese living in other countries, which totalled 327 million ECU in 1979), services and foreign loans.
2.2. Structure of trade by country
The breakdown by country (see Table 3 in the Annex) shows, first of all, differing trends for imports and exports. Following the opening-up of China in 1972, the western industrialized countries increased their share of Chinese imports to the detriment of the developing and state-trading
countries. After 1975 this ratio fell away sharply again, but following a recovery in the last two or three years it stood at a slightly higher level in 1979 (70g) than in 1970.
The western industrialized countries' share of Chinese exports rose steadily to 4lg in 1979 (1970: 32g), while that of the developing countries went up slightly in the same period. On the other hand, the proportion of sales to state-trading countries fell appreciably.
The main factors behind the positive trend among the western industrialized countries were the stepping-up of Sino-Japanese relations and the emergence of the USA as a competitor in China's external trade. Whereas prior to President Nixon's visit to China in 1972 the USA did not trade with the People's Republic, in 1979 it became China's fourth largest trading partner after Japan, the European Community and Hong Kong.
However, the developing countries, too, achieved a substantial increase in their trade with China, the major Asian trading partners (Hong Kong, Singapore and Malaysia) largely maintaining their position. There was also an above-average increase in trade with African (Nigeria, Egypt), Latin American (Brazil, Argentina) and Middle Eastern countries. In 1979 China's sales to the Middle East totalled approximately 56O million ECU and its purchases from the same region 150 million ECU (1970: 75 and 25 million ECU respectively).
The substantial fall in the state-trading countries' overall share was due primarily to the politically motivated decline in trade with Vietnam, whereas the European COMECON countries maintained their position to a considerable extent. Of these countries, Rumania in particular expanded its economic relations with China vigorously and was its fifth largest trading partner in I979. It occupied fifth place among purchasers after Hong Kong, Japan, the European Community and
the USA and among suppliers after Japan, the European Community, the USA and Australia.
(2) 2.3. Structure of trade by type of goods
If goods are divided into agricultural products, raw materials, chemical products and manufactured items, it may be said that the structure of China's external trade is relatively etable. Although there are some significant changes in individual cases, the movements are too erratic to permit the discernment or forecasting of a definite trend. Annual purchases and sales of cereals, for example, fluctuate considerably. Moreover, decreases for some products are offset by increased trade in others. A comparative decline in exports of raw materials, for example, has been more than made up for by increased sales of crude petroleum.
2.3.1· Structure of imports (4)
High population growth but only a relatively small, albeit steady, growth in agricultural production have so far prevented China from meeting unsatisfied demand for agricultural products. As a result cereals and sugar, which account for approximately 90& of agricultural imports, must continue to be bought on the world market. In 1979 over 10 Mn. t of cereals (1978: 9 Mn. t) were imported from the USA, Canada, Australia and Argentina. In the next few years demand will probably rise, if anything^, since in accordance with official policy the cultivation of cereals is to be given less assistance than that of other agricultural products. The population control measures will also take a long time to achieve any measure of success, especially in the rural and remote areas.
Although China is rich in mineral resources and has a diversified agricultural sector, raw materials account for more than 15$ of total imports. They comprise mainly fibres, raw rubber, metalliferous ores, animal and vegetable fats and oils, wood products and natural fertilizers. Apart from synthetic fibres from Japan, wood from the Soviet Union, ores from Australia and wool and animal fats and oils from New Zealand and Australia, the largest proportion of raw materials comes from developing countries (1978: 54g). The main suppliers of raw rubber are Sri Lanka and the ASEAN countries Malaysia, Singapore and Thailand. Cotton is imported primarily from Egypt, Syria and Sudan and ores of non-ferrous base metals from the Philippines and Papua New Guinea. As all these raw materials are mainly basic products for the favoured light industry, the prospects for growth in China's imports can be considered rather good. Little change is expected, however, in the regional structure of suppliers.
Of considerably greater significance, especially for European producers, is the industrial sector, which accounts for approximately 70g of China's total imports. Among chemicals (10g of imports) the leading imports are fertilizers , elements and compounds, and plastic materials. As consumption of chemical fertilizers per ha is still on the low side by international standards and the. planned modernization, i.e. including modernization of cultivation methods, requires increased use of
fertilizers, import demand can be expected to increase over the next few years despite an appreciable rise in China's own production. Domestic production trends and the requirements of agriculture indicate that the main increase will probably be in the demand for phosphatic fertilizers.
(1) The purchases of Rumania in 1979 were even higher than those of Germany, the biggest importer of Chinese products within the Community.
(2) See Table 4 in the Annex. (3) See Table 4 in the Annex.
(4) Despite a strict family planning policy the growth rate is put officially at 1.2g. According
to other estimates it is still between 1.7 and 2%.
(5) Accordingly, an agreement for the supply of several Mn. t of cereals was concluded with the USA in January I98I.
Half of China's imports of manufactured goods, which account for around 60$ of total imports, are iron and steel products. A long way behind come transport equipment, machinery, non-ferrous metals, textile yarn and fabrics etc.
(7)
The proportion of non-ferrous metals in total imports has fallen steadily since 1970 , demand eould how-ever go up as a result of continued industrialization,especially since it is questionable how far the hard-to-achieve expansion of domestic production can replace expensive imports. But readjustment policy will probably have the effect of curbirg demand in this sector. This also applies to iron and steel products and machinery, which are the main products in Japan's and the Community's trade with China . In the next few years Chinese imports of these products will probably fall, although they can be expected to pick up again in the long term.
Transport equipment, which in 1979 accounted for 11$ of total imports, can be regarded as a stabiliz-ing factor. Its share has increased steadily since 1970. Purchases of road motor vehicles, aircraft, ships and railway vehicles were an important factor in the development of the transport sector and of the infrastructure. Special importance was attached to the development of transport capacity in the reaiíustaent plan. As the development of the relevant domestic industry can hardly cover the rise in demand, increased import requirements can be expected.
On the import side too, the trends outlined above are largely confirmed by the official figures on the development of external trade in I98O. Accordingly, the proportion of rolled steel, non-ferrous metals, machinery and instruments in China's total imports is regarded to have fallen from 41.5$ in 1979 to 27.6$. On the other hand, the proportion of agricultural products, chemical fertilizers, chemicals, wood and technical supplies for agriculture amounted to 52.6$ in I980.
(9) 2.3.2. Structure of exports
On the basis of figures for 1978, China's main exports are textile yarn, fabrics etc., clothing, crude petroleum, fruit and vegetables, meat and fish, and craft articles etc. Calculations for 1979 give a similar picture, although there was a further substantial increase in exports of cereals and meat and fish and a relative decline in exports of textile yearn, fabrics etc., crude petroleum and fruit and vegetables.
As already mentioned, the proportion of agricultural products in total exports is subject to considerable fluctuations. Nevertheless, agricultural exports can be regarded as a stabilizing factor. In the first place, agricultural production in general is relatively stable with a slight upward trend, and secondly, there is a constant demand for agricultural products, influenced by at least two factors:
1. China is the main supplier of food and is thus regarded as the 'provider'
-for Hong Kong and Macao, which obtain about half of their food imports from China. In value terms they account for roughly 40$ of China's food exports and 7$ of its total exports. However, food also accounts for a substantial proportion of other countries' purchases from China, e.g. in 1979: European Community 17$, Japan 14$, Singapore 26$, Australia 9$ and USA 8$. 2. China is an exporter of important special agricultural products. The 25 most important products
which the Community imported from China in 1979 included meat of domestic pigeons and rabbits, prepared mushrooms, tea and natural honey (see Table 27 in the Annex).
(7) Imports of some non-ferrous metals are subject to considerable fluctuations in quantity. (8) In I979 the proportion of iron and steel products in total exports to China was 47$ in the case
As more assistance is to be given to agriculture in the future, increased exports can also be expected from this sector. The expansion will be limited, however, by:
the potential for increasing agricultural production, and rising domestic demand.
It would be practically impossible to reduce supplies to the indigenous population. China, however, could devote more attention to the production and export of high-grade agricultural products. For example, expensive high grade rice has been exported for years to finance imports of cheaper, calorie-rich wheat.
An increasingly large proportion of foreign currency revenue should be yielded by exports of raw materials, which in 1978 accounted for a quarter of export earnings. Crude petroleum will continue to be the most important product, although substantial growth rates can no longer be expected, at least in the immediate future. While until recently petroleum was regarded as the mainstay of the develop-ment of China's external trade, adjustedevelop-ments had also to be made in this sector during the period of regulation. On the one hand, the expansion in production has come to a standstill , and on the other it has become clear that China's growing economy urgently needs its own energy resources in the current energy shortage. For the same reasons it will almost certainly not be possible to achieve the planned increase in the exports of coal . In contrast, exports of non-ferrous metals could be stepped up; China is already an important supplier of tin, tungsten and antimony on the world market, while there are good prospects for molybdenum, cobalt, magnesium and silver. In addition, it still has large reserves of phosphate and sulphur. Extraction, however, and processing require high capital outlay, expensive imports of technical know-how and a far better infrastructure, since here too the chronic shortage of transport capacity and energy is apparent.
Once again, agricultural products will probably have a stabilizing influence on raw
material exports. China is also regarded as an important supplier of special agricultural by-products. Thus, in 1979 the 25 leading products imported by the Community included:
- raw silk (not thrown)
- guts, bladders and stomachs of animals (other than fish) - fine animal hair of camels, Tibetan goats, etc.
- pigs', hogs' and boars' bristles or hair - pre-treated raw hides and skins of goats and
- fine animal hair of Angora rabbit (see Table 27 in the Annex).
Among industrial products, chemicals play a relatively insignificant part with little room for expansion. They account for between 4 and 5$ of exports, the main products being spirits of turpentine and rosin acids, essential oils and perfume materials, and fireworks.
On the other hand, manufactured goods are the main export products, accounting for around 45$ of the total. Although China is stepping up its exports of heavy industrial goods, light industry will probably continue to be important for exports. It is based mainly on the textile and clothing industries, which supply about a quarter of total exports. Following the slower growth in 1979, light industry - and in particular the textile and clothing industries - is expected to increase its share of exports again in the next few years. Firstly, it is given special priority in the readjust-ment policy and secondly, China has successfully concluded important international textile agreereadjust-ments with its main trading partners, the European Community, Japan and the United States, in the last two years.
(10) Between 1978 and 1979 growth was only 2$. According to official figures, production fell by 0.3$ in 1980 to IO5.8 Million t and for I981 a growth of 0.9$ at the most is expected. (11) Between 1979 and I980 coal production actually fell by 5.5$, following a growth of only 2.8$
between 1978 and 1979.
However, heavy industry too, which increased its share of exports substantially in 1979, has good export prospects, as far as permitted by the domestic market, since China supplies Third World countries with machinery and capital goods which suit their level of technology and economic conditions (surplus of labour, shortage of capital).
On the basis of official Chinese figures and classifications, the pattern of exports over the last three years was as follows:
Share of total exports($)
1978 1979 1980
Products of heavy industry Products of light industry
Agricultural products and by-products
25-5 31.9 39.0 46.9 45.O 39.8 27.6 23.I 21.2
The striking increase in the share of heavy industrial products is due primarily to a substantial rise of over 30$ in the value of exports of machinery and power station equipment and to the exports of raw materials (crude petroleum). The poor performance, at first sight, of light industry and agriculture does not mean that their exports have declined. Their growth rates are merely less spectacular than that of heavy industry's exports.
1978 1979 1980
Exports (a)
2 012 3 700 2 178
(a)
3 201 4 516 2 318
(b)
59.1 22.1 6.4
(a)
4 887 4 987 2 656
(b)
52.7 10.4 14.6 Heavy industry
Light industry Agriculture
Total 7 890 10 035 27.2 12 530 24.9
(a) in Mn. ECU
(b) percentage growth compared with the previous year
3. MAIN TRADING PARTNERS' TRADE WITH CHINA
Taking the Community as an economic unit, China's main trading partners break down into (see Table 5 in the Annex):
five western industrial countries (Japan, European Community, USA, Australia and Canada); - three European COMECON countries (Rumania, USSR and German Democratic Republic);
two newly industrialized countries (Hong Kong and Singapore).
3.1. Japan
In terms of the volume of trade (imports + exports), the Community was in 2nd position in 1979 behind Japan. Japan's volume of trade with China was 40$ higher than the Community's. The positions were reversed as late as 1969 when the Community was China's biggest trading partner with a volume of trade 30$ higher than that of the country in 2nd place, Japan. By 1970, however, Japan had taken over as China's leading trading partner on account of its rapidly rising imports. Advantages of location and cost bought about a rapid increase in its lead. Furthermore, at an early stage Japan recognized China's principle of balancing imports and exports and made efforts to step up its
[image:20.595.85.550.521.642.2]purchases from China. As Japan is not self-sufficient in agricultural products and raw materials, it was able to make up the shortfalls with traditional Chinese export products. As a result, imports of fresh products (meat, fish, vegetables), oilseeds, silk, wool, mineral, animal and vegetable raw materials, coal, crude petroleum and petroleum products expanded at an above-average rate. In 1979 crude petroleum purchases alone amounted to 734 Mn. ECU or 34$ of Japanese imports from China Importe, however, of textile products (yarn, fabrics, sheets, linen, carpets, clothing) also rose sharply and in 1979 amounted to 355 Mn. ECU or 16.5$ of purchases from China. The proportion of these products in Japan's total imports of the relevant categories of goods is correspondingly high. The structure of imports is more or less the same as that of the Community, although there are slight proportional differences, the main one being in crude petroleum imports, which in 1979 for the Community amounted to only 43.6 Mn. ECU or 3-3$ of its purchases from China and were accounted for entirely by Italy. In return, imports of hides, skins, treated furs and ores (tungsten) play a greater part in the Community's trade. Japan's exports are determined by China's demand for industrial products, i.e. chemicals, machinery and transport equipment, manufactured goods. The structure thus corresponds more or less to that of the Community, although exports of manufactured goods are of much greater significance for Japan:
Table 3·1·1· : Japanese and Community exports to China in 1979
^SITC ; Heading
( 5 ! Chemicals
, 6 Manufactured goods
( 7 ! Machinery and transport equipment ; ¡ Total
(a) in million ECU (b) in $ of total exports
(a) 335 1445 767 2547
Japan 1
1 ( b ) ! 12.4
;
53.5
! 28.4 ¡ 94.3 JCommunity
(a) 254 811 829 I894
¡
(b)
! 12.1 ! 38.6 ! 39.5 j 90.2
1
1
For both the Community and Japan iron and steel products are the main exports, the leading products being universals etc. for Japan and tubes for the Community:
Table 3.1.2. : Exports of iron and steel products to China
,
! Product
(Universals, plates and sheets 'iron and steel bars
(Iron and steel tubes ^Others
' Total iron and steel
( Total exports
(a) in Mn. ECU
(b) proportion of total exports (c) percentage increase over 19'
Japan 1979 (a)
470 305 305 110 1190 2698
75
(b) 17.4 11.3 11.3 4.1 44.1 100.0
(c) 78 170 88 7 85 48
1975 (a)¡ 264; 113! 162; 103! 642¡ 1819!
! ι
( b ) ; 14.5!
6.2j 8.9!
5.7;
35.3;
100.0!! (a)
148 238
252 83
721
2101
Community 1979
(b) 7.1 11.3 12.0 4.0 34.4 100.0
! ¡(c) ! ' 1 ' ; ^ ; ¡1077 ! ; 1 6; ! 255 ! ! 119 ! ! 82 !
! !
1975 (a)
69 20 217 23 329 1153
(b) 6.0 1.7 18.8 2.2 28.6 100.0
For both partners the importance of this category of products has increased considerably since 1975, the growth for the Community being appreciably higher, as with total exports. In particular, it increased its sales of iron and steel bars to China almost twelvefold. On the other hand, exports of tubes stagnated in value terms. Japan achieved its main success with iron and steel bars. However, the increases for tubes and universals etc. were also way above the rate for total exports to the People's Republic.
Other important export products for Japan are electrical and nonelectrical machines, which also occupy a leading position for the Community with 34.1$ of total exports, and transport equipment, chemicals, textile products and paper:
Table 3·!·3· : Other main products exported by Japan to China
Product
(Nonelectrical machines (Ships and boats
(Electrical machines (Chemical fertilizers (Road motor vehicles
(Yarn, fabrics, finished textile goods (Organic chemicals
(Paper
( Total of above
Mn. ECU 313 157 149 136 134 81 67 56 1093
$ of total exports '
11.6 )
5.8 )
5.5 )
5.0 )
4.9 )
3.0 )
2.5 )
2.1 )
40.5 )
Overall, China plays a much greater part in Japan's external trade than in the Community's: in 1979, 2.7$ of Japan's imports came from China (Community: 0.6$). In the case of
manufactured goode (SITC Chapter 6) the proportion was as high as 4.1$ (Community: 0.9$); 3·6$ of Japan's exports went to China (Community: 1.1$). Of these, chemicals accounted
[image:21.595.47.516.446.604.2]3.2. Hong Kong
China's third largest trading partner is Hong Kong, which is also its most important source of foreign currency. In 1979 alone China had a trade surplus of 1.9 thousand Mn. ECU. For the period 1975--1979 its surplus amounted to 7.6 thousand Mn. ECU and for I980 it can be estimated at over 2 thousand Mn. ECU.
The substantial import surplus is due, as already mentioned above, to Hong Kong's demand for food-stuffs, raw materials for its flourishing light industry, clothing and other consumer goods. In 1979 Hong Kong bought food and semi-luxuries worth 650 Mn. ECU and textile products worth 630 Mn. ECU from the People's Republic, accountring for 29.4 and 28.6$ respectively of its total imports from China. Petroleum products are also becoming increasingly important; the import value was 212 Mn. ECU or 9.6$ in 1979· In addition, the construction industry gets its supplies of cement and other
building materials from China. Further major imports are, for example, footwear, furniture, jewellery and other manufactured goods.
In contrast to its purchases, Hong Kong'G sales to China were virtually negligible up to 1978, being confined to animal and vegetable raw materials, plastics, yarn and fabrics. In addition, small quantities of a wide range of products of light industry were exported. 1979 marked a turning-point, however, with sales to China increasing almost sixfold over the previous year. The biggest rise was in sales of products of light industry, in particular the textile industry. In some areas turnover was increased almost tenfold. Moreover, Hong Kong also emerged as a new or virtually new -supplier of electricity, natural fertilizers, leather, veneer wood etc., textile and other special
machines, communications equipment, clocks and cars. As the growth in exports to China was again (2)
exceptionally high in I980 , increasing competition is to be expected from Hong Kong in these sectors. It could be even greater if the plans to set up joint ventures in Hong Kong and neighbour-ing regions are put into effect.
3.3. USA
The pattern of Sino-American trade was very uneven in the period under review. While imports remained at a low level in the years immediately following President Nixon's visit to China, they climbed sharply in 1975, stayed at this level and then increased substantially in 1978 and 1979. Exports, on the other hand, were subject to considerable fluctuations, caused essentially by deliveries of cereals, oilseeds (soya beans)and cotton. Accordingly, sales to China increased ten-fold in 1973, went up by a further 15$ in 1974 but fell sharply in 1975 and the following years. In I978 they leapt by 330$ and doubled again in 1979. Despite thi6 impressive growth, in 1979 China had a share of only 0.31$ of American imports and 0.95$ of exports. Although in that year China was only in 38th position among the USA's main trading partners in respect of imports, on the export side it was already 16th. The three agricultural producst wheat, maize and cotton were still the mainstay of American exports, but their share fell appreciably compared with 1978, despite a 50$ rise in value:
Table 3·3·1· : American exports of important agricultural products to China
» Product ( Cotton
, Maize ( Wheat ( Total • Soya Beans ( Total of above (a) in Mn. ECU (b) $ of total (c) percentage
exports
increase over 1978
(a) !
261 !
196 ;
156 !
V
6I3 !
78 ;
691 !
1979
(b)
20.7
15.6
12.4
48.7
6.2
54.9
!
(c) !
112 !
123 ;
20 !
51 !
550 ;
65 !
(a)
123
88
196
407
12
419
1978 )
(b) )
19.1 )
S I3.6
\
30.4 )
63.Ο )
1.9
I
! 64.9 )
The relative decline in the proportion of agricultural products indicates that the USA had an above
average increase in its sales of industrial products, thus consolidating its position as a competitor in this sector. For the first time the USA exported significant quantities of iron and steel tubes
to China. Spectacular rates of increase were also recorded in sales of plastic materials, chemicals,
yarn, machinery and road motor vehicles:
Table 3.3.2. : Other important American export products to China
(a) in Mn. ECU
(b) $ of total exports
(c) percentage increase over 1978
(1~
r
2·
(3.[4.
(5.I
6
·
(7.f
8·
(9.
(10.
Product Machinery
- non electrical - electrical
Tubes and pipes of iron Synthetic fibres Road motor vehicles Chemical fertilizers Vegetable oils Synthetic materials Textile yarn Other chemicals Tools
Total of above
or steel
(a)
I56.9 114.3 42.6 109.8 45.4 33.1 32.5 26.2 22.7 20.3 16.0 13.5 476.4
1979 (b)
12.5 9.1
3.4
8.7
3.6
2.6
2.6
2.1
1.8
1.6
1.3
1.1
37.9
(c)
120
98
209
24
276
7
28
1320 1930 125
25
153
! 1978 )
! (a)
1
! 71.4
; 57.6
! 13.8
; 0.4
! 36.5
; 8.8
! 30.4
; 20.5
! 1.6
¡ 1.0
! 7.1
; 10.8
\ 188.5
! (b) )
| 1
! 10.6 )
! 8'9 )
! 2.1 )
;
0.1
I
! 5.7 )
; 1 . 4 ]
! 4.7 )
; 3.2 ;
! 0.2 )
; 0.2 I
! 1.1 )
Ì
1·7)
! 2 8·9 )
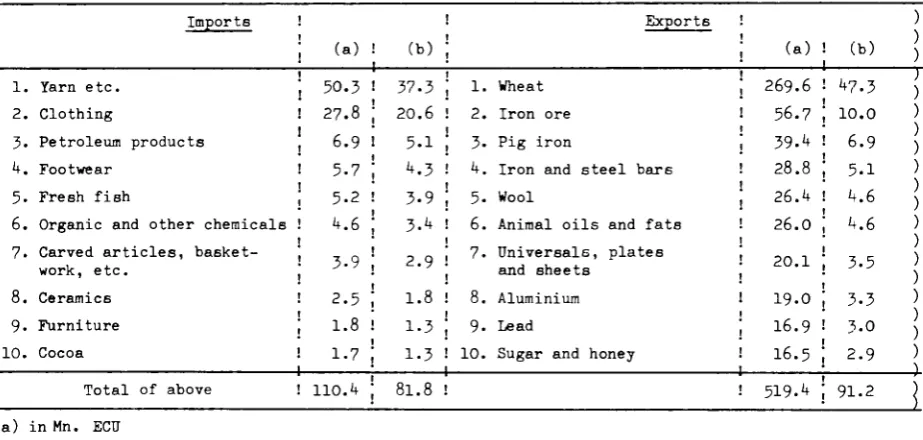
[image:23.595.52.517.355.596.2]3.4. Australia
Australia is one of China's largest suppliers of food and raw materials. In 1979 almost half of its exports were accounted for by wheat - an increase of 55$ over the previous year. Other important agricultural products are wool, animal oils and fats, sugar and honey. As regards mineral resources and products, China buys iron ore, pig iron, aluminium and lead from Australia. Exports of aluminium and lead increased more than three and fourfold respectively in 1979. On the other hand, sales of pig iron went up only slightly (+ 5-3$), while those of iron ore actually fell (- 14.4$), although they were still four times as high as in the period 1975-1977. In addition, over the past few years Australia has been emerging as a competitor in iron and steel bars and universals, plates and sheets.
Australia's imports are on the whole more diversified, although textile products accounted for over 58$ in I975. Apart from a number of special products such as cocoa, ceramics, footwear, carved articles, basket-work and furniture, the main increase in 1979 was in imports of petroleum products
[image:24.595.87.549.269.489.2](+ 5 H $ ) :
Table 3-4.1. : Main products in Australia's trade with China in 1979
Imports Exports
(a) (b) (a) (b)
1. Yarn etc. . 2. Clothing ! 3. Petroleum products ¡
4. Footwear ! 5. Fresh fish , 6. Organic and other chemicals !
1 7. Carved articles,
basket-work, etc. 8. Ceramics 9. Furniture 10. Cocoa
1-50.3 27.8 6.9 5.7 5-2 4.6
37.3 20.6 5.1 4.3 3.9 3-4 3.9
2.5 1.8 1.7
2.9 !
1. Wheat 2. Iron ore 3. Pig iron
4. Iron and steel bars 5. Wool
6. Animal oils and fats 7. Universals, plates
and sheets 1.8 ! 8. Aluminium 1.3 ¡ 9. Lead
1.3 ! 10. Sugar and honey
-4-269.6 56.7 39.4 28.8 26.4 26.O 20.1 I9.O I6.9 16.5
47.3 10.0 6.9 5.1 4.6 4.6
3.5 3.3 3.0 2.9
Total of above ! 110.4 81.8 ! 519.4 ; 91.2
a) in Mn. ECU
b) in $ of imports or exports
3.5. Canada
Of the main trading partners, Canada probably has the most concentrated trade with China: in 1979 the four major import and export products accounted for 85.2$ and 88.7$ respectively of the total. Wheat exports alone made up 69.5$ of sales to the People's Republic . Special attention should be paid to the development of exports of chemical fertilizers and cars, in which Canada achieved significant success in 1979, virtually as a new supplier. Canada's imports from China were confined to textile and agriculture products; the capacity of the market was probably limited as a result of the fierce competition and low growth.
Table 3.5.1. : Main products in Canada's trade with China in 1979
;i. (2. (3· (4.
(a) (b)
Imports
Clothing
Textile yarn, fabrics, etc. Fresh fruit
Preserved vegetables
Total of above in Mn. ECU
in $ of imports or exports
J (a)
¡ 35.4 ! 35.4 ! 12.8 ! 5.1 !'
! 88.7 (b) 34.1 34.1 12.3 5.0
85.2 1. 2. 3. 4. 5· 6. 7.
Exports
Wheat Aluminium Cellulose Paper
Chemical Fertilizers Sulphur
Road motor vehicles
(a) 256.4 30.6 23.8 16.5 14.4 7.5 5.4
I 354.5
(b) >
69.5 J
8.3 ) 6.4 > **.5 ) 3.9 ] 2.0 )1.5 j
96.1 ^
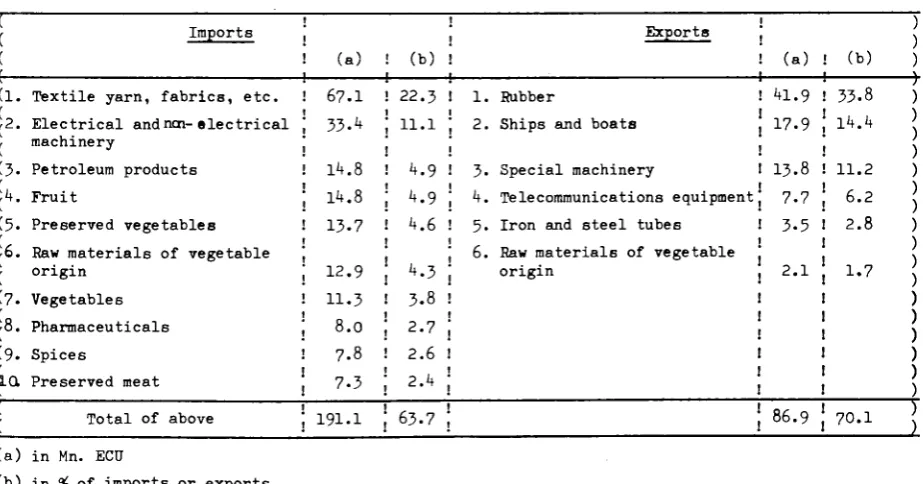
3.6. Singapore
Singapore, China's eighth largest trading partner, has an extremely diversified range of goods in both imports and exports, although the first ten products account for 63.7$ of imports and just under 75$ of exports. The main imports are textile yarn, fabrics, etc., and agricultural products,
although recently petroleum products have achieved a certain prominence.
Up to now Singapore was also regarded as a source of foreign currency for Peking. Its deficit vis-a-vis China has amounted to around 200 Mn. ECU a year since 1975· A turning-point might have been reached in 1979, however, though the deficit still amounted to 176 Mn. ECU: a normal growth in imports of 12$ contrasted with a growth of 175$ in exports. This result was due firstly to a sub-stantial increase in exports of the traditional export product rubber (+ 66$) and secondly to the fact that Singapore made a major breakthrough in sales of special machines and telecommunications equipment.
Table 3.6.1. : Main products in Singapore's trade with China, 1979
(1. (2.
(3-|4. (5. (6.
(7. (8· (9.
(a) (b)
Imports
Textile yarn, fabrics, etc. Electrical and ncn- electrical machinery
Petroleum products Fruit
Preserved vegetables Raw materials of vegetable origin
Vegetables Pharmaceuticals Spices
Preserved meat Total of above in Mn. ECU
in $ of imports or exports
(a) 67.I 33.4
14.8 14.8 13.7
12.9 11.3 8.0 7.8 7.3 191.1
! (b) . 22.3 • 11.1 !
4.9 4.9 4.6
4.3 3.8 2.7 2.6 2.4 63.7;
1. 2.
3. 4. 5. 6.
Exports
Rubber
Ships and boats
Special machinery
Telecommunications equipment Iron and steel tubes
Raw materials of vegetable origin
(a) 41.9 17.9
13.8 7-7 3.5
2.1
86.9
! (b) ) 33.8
14.4
11.2 6.2 2.8
1.7
70.1
)
[image:25.595.65.527.491.733.2]3.7. European COMECON countries
Following the rift between China and the Soviet Union at the beginning of the 1960s, trade with the
European state-trading countries stagnated at n low level. 1970 saw the start of a recovery, with
growth rates fully comparable with those of Western countries. Rumania in particular boosted its trade with China on account of the special relations between the two countries. The German Democratic
Republic was also very successful, especially on the export side. No further details are available on
the structure of Rumania and the GDR.
In 1978 according to calculations based on Western sources, the structure of trade with China of the
state-trading countries as a whole was as follows:
Imports(fob) Exports(fob)
Total in Mn. of which in ECU Food
Cereals
Fruits and vegetables Crude materials
Crude petroleum & petroleum products
Ccal Chemicals
Manufactured goods
Yarns, woven cotton fabrics, etc.
Clothing
Non-ferrous metals
1 138
16.5 6.2 4.5 27.6 11.4 5-5 4.1 51.4 I6.9 7.6 3.1
Total in Mn. ECU 1 150 of which in %
Food 3.5 Sugar 7.8 Crude materials 11.9
Metalliferous ores and metal scrap 3·4
Che-:-: jal ó 10.6
Manufactured fertilizers 7.5
Manufactured goods 68.9
Transport equipment 28.3
Non-electrical machinery 11.6
Iron and stee], 8.5 Electrical machinery 4.1
For the Soviet Union the 'Institute of Developing Economics', Tokyo detailed the following structure
for 1976:
Imports
(a) (b)
Exports
(a) (b)
1. Clothing
2. Yarns and textiles
3. Apples 4. Footwear
5. Mineral manufactures
6. Meat, fresh Total of above
Total imports
36.3 -9-5 15.3 8.7 7 . 0
3 . 7 90.5 159.7
22.7 12.2 9 . 6 5.4 4.4
2 . 3 56.6 100.0
1 .Aircraft
2.Machinery not electric
3-Transport equipment 4.Wood, crude
5.Iron and steel
6.Inorganic chemical products
Total cf above Total exports
53.8 53.5 26.5 21.2 11.4
2 . 3
168.7 273.3 |
25.2 25.0 12.4
9 . 9 5 . 4 1.1
79.0 100.0
a) in Mn. ECU
THE COMMUNITY'S TRADE WITH CHINA
4.1. Pattern of overall trade
4.1.1. General trends
[image:27.595.59.523.294.349.2] [image:27.595.57.532.438.565.2]The Community's trade with China has always been subject to considerable fluctuations. For example, the proportion of exports to China in total sales to non-member countries varied between 1.7$ in 1958, the year the Community was established, and 0.4$ in 1977, the year which saw the consequences of the political discussion on the right level of external economic relations and in which the first major post-1972 agreements on the delivery of complete industrial plants expired. The announcement of the modernization programme at the beginning of 1978 resulted in a further rapid growth in demand for capital goods, chemicals and technological equipment, so that in 1979 exports to China accounted for around 1.1$ of the Community's total exports. Although China's share of the Community's imports from non-member countries was always, with few exceptions, well below the figure for exports, it was not subject to such great fluctuations:
Table 4.1.1.1.:China's share of the Community's trade with non-member countries in $
( -Imports (Exports
1958 1963 j 1968 1970 \ 1972 1973 1975 1977 1978 1979
0.69 I.74
0.49 O.54
0.69 1.01
0.59 ;
0.83 ¡ 0.64 0.56
O.65 0.75
0.53 0.95
O.50 O.47
0.61 0.52 ¡ 0.86 ! 1.09
Imports from China showed the same general trend as imports from non-Community countries. The growth in exports, on the other hand, remained well below that in total exports, although it must be pointed out that the value of exports in the base year 1958 was fairly high.
Table 4.1.1.2.:Indices of growth in Community trade
f
f
( 1963/58 [ 1970/58 ( 1975/58 ! 1979/58 ( 1975/70
I 1979/75
Non-Community countries Imports
l4l 251 530 922 211 I74
Exports 129 252 548 878 218 160
China Imports
101 213 409 812 192 199
Exports 40 120 300 547 250 I82
)
4.1.2. Imports
Considering only the 1970s, exports to China increased at a faster rate than imports in the first half of the decade and at a slower rate in the second half. In particular, the conclusion of the trade agreement between the Community and China (2 May 1978), which accorded China most-favoured-nation status, and of the textile agreement (20 December 1979), gave a substantial boost to China's sales to the Community. This trend will probably continue in I98O, especially as the Community has included China in the system of generalized preferences since I980 and granted it the status of a developing country. The effects of these agreements can be seen to some extent from the figures for 1979 and the first six months of I980, which saw above-average growth rates for agricultural and textile products. In particular, in the first half of I98O imports of food went up by almost 100$ , fine
animal hair by 86$, raw materials of animal origin (such as bristles, guts and bladders, birds' (2) feathers by over 50$, textile yarn, fabrics, etc. by 48$ and clothing by an astonishing 115$
For the period 1975-1979, on the import side, the countries such as the USA and Canada which had a backlog of demand had high growth rates: imports from China accounted for 0.16$ of the total for both countries in 1975 and 0.31$ and 0.27$ respectively in 1979, compared with 0.53$ in 1975 and 0.6l$ in 1979 for the Community. The low growth rate for Japan's imports in this period was due to the rapid increase in its purchases from China during the first half of the 1970s, which in 1975 thus reached the relatively high level of 1,200 Mn. ECU and exceeded even those of Hong Kong in value.
4.1.3. Exports
On the export side the Community did not fare as well. Although it achieved higher growth rates than the EFTA countries, Canada and above all Japan, it had to contend with rapidly increasing competition from the European COMECON countries, Australia and above all the USA, Singapore and Hong Kong. These countries are not only competing with both the Community and Japan in the markets for traditional products such as chemical fertilizers, plastics, iron and steel, machinery goods, vehicles and ships, but are also proving extremely successful in opening up new markets, e.g. for products of light industry (see also Table 7 in the Annex).
A further problem for the Community is posed by the considerable fluctuations in its exports to China (see above). These are probably due primarily to China's structural problems caused by:
- The special nature of demand. In 1979 iron and steel products (SITC 67) and special machines (SITC 72) accounted for around 55$ of Community sales . Exports depend to a corresponding extent on the economic policy objectives and therefore on the
(4)
political conflicts in China. Figures for the first six months of I980 show how sensitive demand is to changes in priority. They already show a noticeable shift to the detriment of the heavy industry sector, with a drop of 83$ in sales of iron and steel and a rise of 44$ in those of machinery and transport equipment (29$ for special machines).
- Disadvantages of location and cost will probably make it more difficult for the Community to cope with the increasing competition from Japan, the USA, Australia and other rising Pacific countries for traditional and, above all, new markets.
4.1.4. Balance of trade
The Community's balance of trade with China has always been very much in surplus. Since 1970 there have been slight deficits in only two years . Altogether the Community's surplus amounted to 2,344 Mn. ECU, of which the period 1975-1979 alone accounted for 2,094 Mn. A record deficit is expected in I980, however. In the first half of the year imports, which went up by 53$, exceeded exports (which fell by 24$) by 59 Mn. ECU . This trend continued in the following months and a deficit of over 250 Mn. ECU can thus be expected (see Chapter 6 ) .
(2) See Table 27 in the Annex (3) See Table 26 in the Annex (4) See Table 31 in the Annex
(7)
Although the Community's import cover ratio was relatively high in 1979 at 1.6, it was still well below that of other western industrial countries such as Australia, Canada, the USA and the EFTA countries. Only Japan had a lower ratio (1.25) (see also Table 5 in the Annex).
4.2. Structure of_Community_ trade with China by country
4.2.1. Volume of trade
On the basis of volume of trade (imports + exports), the Federal Republic of Germany was China's biggest trading partner in the Community and its fourth most important overall after Japan, Hong Kong and the USA. In 1979 42.9$ of trade between the Community and China was accounted for by Germany, followed at a considerable distance by the United Kingdom (15.9$), Italy (14.4$) and France (13.7$). The remaining Member States together accounted for only 13.1$. In 1975 Germany's share was only 33.3$, but an above-average increase in imports and especially in exports led to a rapid growth in Sino-German trade. At the same time the volume of trade of the former second largest trading partner, France, stagnated as a result of small increases in imports and a decline in the value of exports, and in terms of volume of trade France was overtaken by the United Kingdom (sharp rise in exports in 1979) and Italy (substantial expansion of imports).
Table 4.2.1. : Volume (imports + exports) of trade between the Community and China
;i975 in Mn. ECU ( share ($) [1979 in Mn. ECU ( share ($)
EUR 9 1 820 100.0 3 412 100.0
4.2.2.
!
! ! 1 1
St D
606
33-3 1464 42.9
ructure
!
1
ί
of F
442
24.3
468
13.7
importi
I
223
12.3
491
14.4
3
1 ; NL
; 172
! 9.5
;
2 5 1 j 6.8B-L
75 4.1 157 4.6
UK
265 14.6
544
I5.9
IRL
2 0.1
9 0.3
DK I 36 ] 2.0 )
47 ] 1.4 )
With a growth of 106$ compared with 1975, Germany increased its share of Community imports from China to 28.6$ in 1979 (1975: 27.3$). This was due to demand for special agricultural products (mushrooms, honey, tea, down feathers, animal guts, hair of Angora rabbit, hides and skins), clothing, finished textile products (bed linen, carpets, etc.), basket and wickerwork, and ores (tungsten).
The second largest importer in 1979 was Italy, which accounted for 21.9$ of the Community total. ( Q \ Although the position of silk was affected by the high level of crude petroleum purchases in 1979 , it remained by far the leading import product although, despite trebling in value, its share fell from 45.2$ in I97O to 30.5$ in I979. At the same time, however, the proportion of fine animal hair and hides and skins went up, with the result that the three agricultural raw materials important for Italy's industry now account for over 40$ of its imports from China.
Despite an impressive growth in 1979 France, which accounted for 16.9$ of Community imports, had the lowest growth rate in the period 1975-1979· Its main imports are cotton fabrics, silk, furs, meat of domestic pigeons and rabbits, basket and wickerwork, clothing and tea.
The United Kingdom's imports grew steadily but at a rate below the Community average. As a result, its share was only 16.4$ in 1979 (1975: 18.1$, 1970: 21.1$). The United Kingdom, too, is stepping up its imports of agricultural products from China. For example, imports of fine animal hair and cotton fabrics showed above-average growth rates, while there was also an increase in the proportion of carpets and especially basket and wickerwork in total imports. On the other hand, the increase in purchases of other raw materials of animal origin (e.g. pigs' bristles) wae relatively small and their share of total imports fell markedly.
(7) The import cover ratio is defined as the ratio of the value of exports to the value of imports. It indicates how far imports are covered by exports.
In 1979 the Netherlands was the fifth largest Community importer with a share of 8.7$· While the increase in purchases was rather modest in 1978 and 1979, it shot up to 61.3$ in the first nine months of 1980. The Netherlands' main imports are cotton fabrics, tin, animal guts etc., pigs' bristles, clothing and again basket and wickerwork.
The Belgium-Luxembourg Economic Union's share of 4.7$ was due mainly to imports of starchy roots and tubers, which accounted for 22.6$ of purchases, molybdenum ores, tin, hair of Angora rabbit and basket and wickerwork. Up to and including 1978 imports from China had been virtually stagnant, but 1979 saw the onset of a sharp upward trend (+ 63$), which became even more marked in the first nine months of 1980. Compared with the same period in the previous year, purchases almost trebled, this increase being due almost entirely to the large-scale imports of starchy roots and tubers which began in the
(9) second half of 1979 .
Denmark had an overall share of 2.6$ and its main imports from China were cotton fabrics, synthetic fibres, kernels, clothing and basket and wickerwork. Ireland, whose share is more or less constant at 0.4$, imported primarily rosin acids, magnesium carbonate (magnesite) and cotton fabrics.
4.2.3. Structure of exports
Germany has by far the biggest share (over 50$) of Community exports to China, and in 1979 it was also China's third largest supplier in the world (1,100 Mn. ECU). Up to then it was the second largest exporter, but in 1979 it was overtaken by the USA in exports of cereals and cotton. Germany's share of Community sales was only 36.8$ in 1975, but then the contracts for the supply of complete industrial plants, concluded mainly in 1974, led to a sharp rise. In addition, German supplies of iron and steel products and machines fitted in perfectly with China's import requirements under the modernization campaign. Correspondingly high growth rates in sales from these sectors led to a greater concentration of German exports. In 1979 exports of iron and steel (mainly tubes) amounted to 395 Mn. ECU or 36$ of total exports, while those of machines and electrical goods (particularly special machines) were as high as 445 Mn. ECU (41$). These two categories together accounted for 77$ of Germany's exports and for over 40$ of the Community's total exports to China. At the same time the proportion of chemicals fell quite considerably.
With a share of 15-7$ the United Kingdom was the second largest Community exporter to China in 1979, ahead of France (11.8$) and Italy (9.7$). In 1975 France's share was more than twice that of the United Kingdom. Although the latter saw its sales of non-ferrous metals decline appreciably, it recorded resounding successes in exports of machinery and electrical products (special machines, conveyors, lifting machines, etc.) and iron and steel (iron and steel bars), which in 1979 accounted for 49$ and 21$ respectively of British exports to China. France's sales to China likewise comprise mainly machines (30$, primarily mining machinery and deep-well drilling equipment) and iron and steel
(38$, primarily iron and steel bars and universals,plates and sheets). Other significant exports are foodstuffs (sugar, wheat) and testing and control instruments etc. With 34.8$, Italy has the highest proportion of chemicals (nitrogenous fertilizers) in its exports to China. The remainder are again concentrated on iron and steel (37$, mainly iron and steel bars and tubes). Exports of machinery were not very significant (8$). On the other hand, Italy sold goods vehicles worth I3 Mn. ECU to China.
The Netherlands, with a 5·6$ share of Community exports to China, and the Belgium-Luxembourg Economic Union (4.5$) had a fairly similar export structure: the emphasis was on iron and steel, especially iron and steel bars and universa]s,plates and sheets, which accounted for over 30$ and almost 55$ respectively, and chemicals (22$ and 17$ respectively), comprising mainly nitrogenous fertilizers, sodium hydroxide (caustic soda) and carboxylic acids (terephthalic acid esters) in the case of the Netherlands and nitrogenous and potash fertilizers and vulcanization catalyzers in the case of Belgium-Luxembourg. Whereas sales of machinery and transport equipment were of secondary importance for the BLEU, this sector accounted for 21.5$ of Dutch exports, mainly special ships, the delivery
rate of which is one of the reasons for the annual fluctuations in the Netherlands' exports to China. The same problem exists for Denmark (share of Community exports in 1979: 0.8$), whose exports to China were likewise largely influenced by ship deliveries:
Table 4.2-3· : Exports of ships by the Netherlands and Denmark
T~
!
1975
I Netherlands (a) ¡ 56.7
( (b) ! 52.9
. Denmark (a) ¡ 6.2
( (b) j 34.7
1976 ; 1977
0 ; 1.9
0 ! 4.3 4.4 ; 9.8 51.8 j 68.3
1978
11.5 11.1
0 0
1979
I
18.4
1
15.7 )
1.7
Ì
9.8 )
(a) in Mn. ECU
(b) as $ of total exports
Other significant Danish exports are electronic insturments, machines and mineral acid esters. For Ireland, whose share of total Community exports was 0.1$, the leading products were soups, spiced sauces etc., milk, tobacco and synthetic yarn.
4.2.4. Balance of trade
(10)
[image:31.595.45.519.386.452.2]As a result of its strong export position Germany """"' was the only Community country which consistently showed a surplus on its trade with China. Between 1975 and 1979 these surpluses totalled 1,965 Mn. ECU (2,091 Mn. ECU for the Community as a whole). France, Belgium-Luxembourg and the United Kingdom also had mainly positive balances:
Table 4.2.4. : Overall trade balance with China for the period 1975-1979 in Mn. ECU (11)
(
1 Total 1975-1979
EUR 9
2 091
D
1 965 F
24o
I
-170
NL
-32
B-L
149
UK
10
IRL
-15
DK
-56
) ) ) )4.3. Structure of Community trade with China by type of goods
4.3.I. Structure of imports
In the period 1970-1975 there were a number of significant changes in the structure of Community imports from China, and the trend continued until 1979: in general terms, there was a shift from food and raw materials to industrial products, although in the case of raw materials there was an exception, namely fuels. In 1978 Italy began importing crude petroleum, and in 1979 these imports accounted for over 4$ of the Community's total imports from China. In view of production difficulties and China's increasing domestic demand, however, a further rise in petroleum imports seems doubtful.
Among industrial products, there was a decline in the share of chemicals. On the other hand, the proportion of other manufacuted goods rose appreciably, primarily as a result of increased imports of clothing and basket and wickerwork.
In I979 silk was the Community's leading import from China (8.3$ of total imports). Its position was further underlined by the fact that 85$ of Community silk importe from non-member countries came from
(10) In I979 China accounted for 1.7$ of Germany's exports to non-Community countries and thus occupied 13th place ahead of Finland.