8-7-2019
System Design Considerations for a Low-Intensity
Hyperspectral Imager of Sensitive Cultural
Heritage Manuscripts
Tyler R. Peery
Follow this and additional works at:
https://scholarworks.rit.edu/theses
This Dissertation is brought to you for free and open access by RIT Scholar Works. It has been accepted for inclusion in Theses by an authorized administrator of RIT Scholar Works. For more information, please [email protected].
Recommended Citation
System Design Considerations for a Low-Intensity Hyperspectral Imager
of Sensitive Cultural Heritage Manuscripts
by
Tyler R. Peery
A dissertation submitted in partial fulfillment of the
requirements for the degree of Doctor of Philosophy
in the Chester F. Carlson Center for Imaging Science
College of Science
Rochester Institute of Technology
August 7, 2019
Signature of the Author
Accepted by
ROCHESTER, NEW YORK
CERTIFICATE OF APPROVAL
Ph.D. DEGREE DISSERTATION
The Ph.D. Degree Dissertation of Tyler R. Peery has been examined and approved by the dissertation committee as satisfactory for the
dissertation required for the Ph.D. degree in Imaging Science
Dr. David Messinger, Dissertation Advisor
Dr. David Ross, External Chair
Dr. Roger Easton
Dr. Michael Gartley
Date
To my wife Anna and our daughters, River and Faye. I’m sure you’ll find this read riveting.
System Design Considerations for a Low-Intensity Hyperspectral Imager
of Sensitive Cultural Heritage Manuscripts
by
Tyler R. Peery
Submitted to the
Chester F. Carlson Center for Imaging Science in partial fulfillment of the requirements
for the Doctor of Philosophy Degree at the Rochester Institute of Technology
Abstract
Cultural heritage imaging is becoming more common with the increased availability of more
complex imaging systems, including multi- and hyperspectral imaging (MSI and HSI) systems. A
particular concern with HSI systems is the broadband source required, regularly including infrared
and ultraviolet spectra, which may cause fading or damage to a target. Guidelines for illumination
of such objects, even while on display at a museum, vary widely from one another. Standards must
be followed to assure the curator to allow imaging and ensure protection of the document. Building
trust in the cultural heritage community is key to gaining access to objects of significant import,
thus allowing scientists, historians, and the public to view digitally preserved representations of
the object, and to allow further discovery of the object through spectral processing and analysis.
Imaging was conducted with a light level of 270 lux at variable ground sample distances
(GSD’s). The light level was chosen to maintain a total dose similar to an hour’s display time
at a museum, based on the United Kingdom standard for cultural heritage display,PAS 198:2012. The varying GSD was used as a variable to increase signal-to-noise ratios (SNR) or decrease total
illumination time on a target. This adjustment was performed both digitally and physically, and
typically results in a decrease in image quality, as the spatial resolution of the image decreases.
tial resolution. This method fuses a panchromatic image with good spatial resolution with a
spec-tral image (either MSI or HSI) with poorer spatial resolution to construct a derivative specspec-tral
image with improved spatial resolution. Detector systems and additional methods of data
cap-ture to assist in processing of cultural heritage documents are investigated, with specific focus on
Acknowledgements
There are many people to thank during my work here. First and foremost is my wife, who has
been an amazing help in aiding me as well as raising our daughters. I would also like to thank
my daughters, for putting up with my sometimes late nights and odd deadlines. My parents and
in-laws also played a very helpful role with keeping our family sane during this busy process.
I also want to thank my advisor, Dr. Messinger, who provided me the tools to succeed as well
as guidance to continue moving forward when the path became unclear. Dr. Steven Galbraith
and the Cary Collection for acquiring and encouraging the use of their palimpsested manuscript.
Timothy Bauch for the original scanning system as well as troubleshooting procedures with it and
the HSI detector. And also Craig Arnold from the RIT machine shop, for tireless assistance in
fabrication and design of various CNC attachments to the HS4 throughout my time on the project.
Contents
Dedication iii
Dissertation Title/Abstract v
Acknowledgments vii
Table of Contents ix
List of Figures xv
List of Tables xxix
1 Introduction 1
1.1 Relevant Parameters . . . 2
1.2 Application . . . 4
1.3 Safe Light Levels . . . 4
2 Background 7
2.1 Imaging Techniques . . . 7
2.1.1 Multispectral Imaging (MSI) . . . 8
2.1.2 Hyperspectral Imaging (HSI) . . . 10
2.2 Cultural Heritage Recovery and Discovery . . . 12
2.3 Light Damage to Manuscripts . . . 14
3 Additional Imaging Techniques 19 3.1 Structure from Motion and Panchromatic Sharpening . . . 20
3.2 Methodology Tested . . . 23
3.3 Metrics for Analysis . . . 27
3.4 Results . . . 30
3.5 Discussion . . . 32
4 System Modeling 43 4.1 Detector Systems . . . 45
4.1.1 Current Detector Characteristics . . . 54
4.1.2 Sources . . . 55
4.1.3 HSI System Database . . . 57
4.1.4 The Human Visual System (HVS) and Contrast Sensitivity Function (CSF) 60 4.2 The Scene . . . 62
4.2.1 Radiometry . . . 62
4.2.2 Noise and Statistics . . . 64
4.3 Results . . . 66
4.4 Analysis . . . 66
CONTENTS xi
5.1 Introduction . . . 78
5.2 Spatial Resolution and Sampling . . . 79
5.2.1 Target Size . . . 79
5.2.2 Human Perception Limits . . . 82
5.2.3 Optical Resolution, Diffraction . . . 84
5.3 Resolution and Signal Level . . . 87
5.3.1 Integration Time and Total Power . . . 88
5.3.2 Well Depth . . . 89
5.3.3 Contrast Sensitivity Function . . . 89
5.4 Modulation Transfer Function (MTF) . . . 91
5.4.1 Sampling . . . 93
5.5 Analysis . . . 94
5.6 Conclusions . . . 99
6 Panchromatic sharpening enabling low-intensity imaging of cultural heritage docu-ments 103 6.1 Introduction . . . 105
6.2 Background . . . 106
6.2.1 Detectors . . . 107
6.2.2 Target . . . 109
6.3 Methodology . . . 109
6.3.1 Hyperspectral Imaging . . . 109
6.3.2 Metrics . . . 111
6.4 Results . . . 123
6.5 Analysis . . . 124
6.5.1 Image Quality Metrics . . . 124
6.5.2 Dose Measurements . . . 131
6.6 Conclusions . . . 141
7 Future Work 149 7.1 Flattening/Sharpening . . . 149
7.2 Modeling . . . 150
7.3 Direct System Comparisons . . . 151
7.4 NIIRS and GIQE for Cultural Heritage . . . 151
7.5 Low-Light Imaging . . . 152
A System Capabilities 161 B System Requirements 165 B.1 Chosen Requirements . . . 166
B.1.1 Resolution and Pixel Pitch . . . 166
B.1.2 Optics . . . 166
B.1.3 Spectral Bands . . . 167
B.1.4 Integration Time . . . 167
B.1.5 Scanning System . . . 168
B.1.6 Lighting System . . . 168
B.1.7 Modularity . . . 169
CONTENTS xiii
B.1.9 Requirement Overview . . . 170
B.2 Verification Process . . . 170
List of Figures
2.1 Schematic of a simplified radiometric model following photons from an LED
source to a diffusing panel, onto a target of given reflectance, and to a detector with
specific transmittance values for optics and dispersion patterns, converting the
en-ergy from the photons to electrons within the detector based on a
wavelength-based quantum efficiency. . . 9
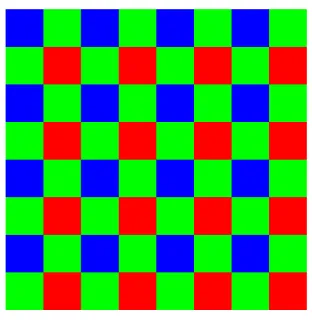
2.2 A Bayer pattern showing a typical ordering of filtered pixels of a digital camera.
This pattern is known as BGGR due to the ordering of the colors in a 2×2 square. 9
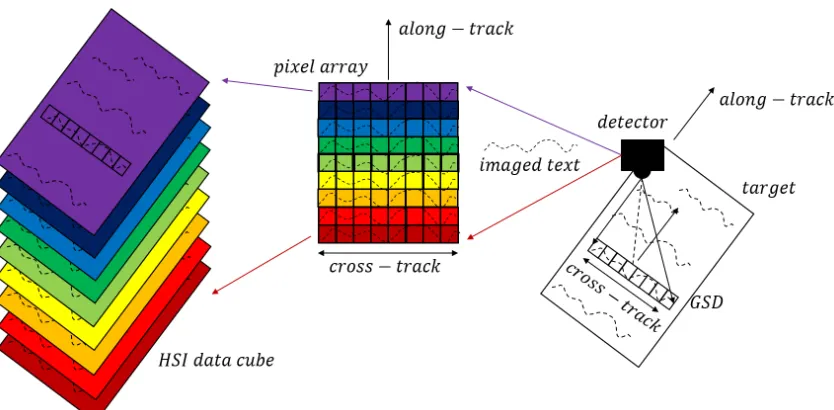
2.3 An example of a pushbroom HSI system taking data in the along-track direction
of a target text. The imaged text is dispersed down the along-track direction of the
detector’s pixel array, with the 1D spatial dimension captured in the across-track
direction. . . 11
2.4 The photopic spectral response of the human visual system, as reported by CIE in
1988 [1]. . . 16
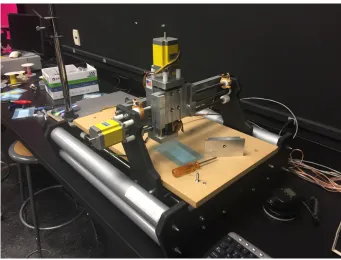
3.1 The RGB scanner used in this research to capture multiple images of a target for
SFM 3D reconstruction. The camera scans in the x- and y-direction while taking
multiple nadir-looking snapshots toward the scanner bed. . . 24
3.2 Traditionally scanned ground truth document. The target is a resolving power test
target adapted for MSI/HSI use with color bars added to the bottom with varying
intensities. . . 26
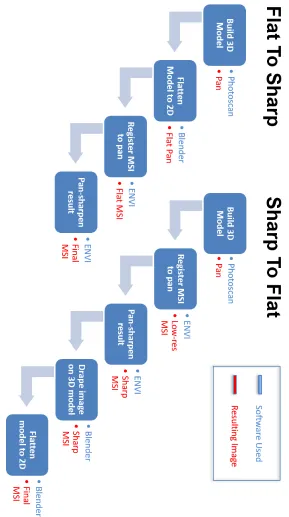
3.3 A blockchain outline of the SFM flattening, panchromatic sharpening processes. 35
3.4 The “Derivative of Gaussian” (DoG) filters are shown on the left, which was
ap-plied to the frequency domain of the target. The filter blurs the image and evaluates
the derivative of the digital counts in the x and y directions. The result in the spatial
domain is shown on the right. . . 36
3.5 A curved target with projective distortion and illumination warping due to its
ge-ometry. An area of interest highlighted from the target, a row selected for the LSF,
and the digital count values across that row in the area of interest across registered
pan, MSI, and sharpened bands. . . 37
3.6 An example of the flattening measure used in this report on a panchromatic image
(Left) and that image rotated30◦ counterclockwise (Right). The method takes a
histogram of the angle of gradient change of each pixel on the image, found using
the DoG filter in the y and x directions, and then calculates the angle using the
arctan of the ratio of their magnitudes. . . 38
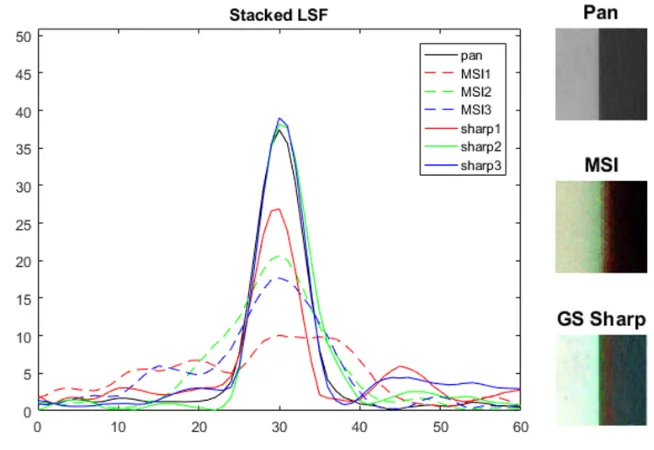
3.7 The line spread function for the Flat-to-Sharp method. The low resolution MSI is
shown as a dashed line, with the high resolution pan and pan-sharpened MSI as
solid lines. The bands correspond to R - 850nm, G - 690 nm, and B - 550 nm. The
respective images are shown on the right for the area of interest being investigated. 39
3.8 The LSF for the Flat-to-Sharp (solid lines) and Sharp-to-Flat (dotted lines)
meth-ods. Both images have been pan chromatically sharpened as well as digitally
LIST OF FIGURES xvii
3.9 A comparison of the flattening performance of the Flat-to-Sharp and Sharp-to-Flat
methods using a histogram of angles. . . 40
3.10 The flattening metric for both flattening methods overlaid and normalized to the
ground truth. Sharper peaks illustrate a lower variance in the angles of the
Sharp-to-Flat method, suggesting a more accurate “flattening” process. . . 41
3.11 A false-color image created by combining the sharpest bands from the ground
truth and two flattening methods. The red band of the ground truth image was
applied to the green channel, the Flat-to-Sharp 690 nm band was applied to the
red channel, and the Sharp-to-Flat 690 nm band was applied to the blue channel.
Black represents a full alignment of three image texts, green represents alignment
of the two sharpening methods but not the ground truth, and pink represents the
ground truth text with no alignment from the sharpening methods. . . 42
4.1 A MegaVision MSI system for cultural heritage recovery and discovery, one of
which is used by University of Rochester. The system uses a panchromatic
MegaV-ision detector, utilizing colored LED lights to achieve a MSI effect, while
main-taining a very high spatial resolution via the 50 MP E7 detector. . . 47
4.2 The pushbroom HSI system at the Bodleian Library uses a Micro-Hyperspec E
detector with Headwall optics. It can operate by translating either with the target
4.3 (Left) The MSI system used by EMEL, similar to that of Figure 4.1 but
perma-nently stationed at Mt. Sinai. An example of a non-portable system with a plethora
of targets brought to it. (Right) The Stokes Preservation Book Cradle specifically
handles fragile documents and codices gently to avoid accidental damage due to
more physical handling [3]. . . 49
4.4 The NGA HSI system designed for imaging cultural heritage art objects. With
significant funding, this system can image between 400-2500 nm using a cooled
system with multiple detectors. A scan mirror is used to build the spatial image
as opposed to a pushbroom system. The high spectral resolution of this system
(2.5-2.8 nm resolution) allows for characterization of artist pigments [4]. . . 50
4.5 A cost-efficient MSI system used by RIT Color Science Department, composed
of Finger Lakes Instrumentation Microline camera, with 50 MP TruSense sensor,
and 7 filter-wheel [5]. . . 51
4.6 From left to right, the high resolution detector centered above the target area, a
target bound similar to a warped codex, and the projector/mirror system which
projects the well-characterized, structured light onto the target [6]. . . 52
4.7 The Kirtas systems uses a fixed cradle system to hold manuscripts at a 110◦angle,
with fixed cameras to image both upturned pages at once. It is designed for rapid,
automated digitization of bound targets, using a vacuum seal to turn pages during
collection [7]. . . 53
4.8 An unmanned aerial system (UAS) with a Nano-Hyperspec attached. Though
imaged here on a remote sensing platform, the system was adjusted to perform
captures on a translation stage, or could also remain stationary with a translating
LIST OF FIGURES xix
4.9 The spectrum and relative intensities of each LED source. The y-axis shows the
relative intensity of the given source normalized to the largest intensity and the
x-axis shows the wavelength of light, ranging from the UV from the left, through
the visible, and to the near IR at the right. Intensities of the sources were obtained
from MegaVision [9]. . . 55
4.10 The spectrum and output of SoLux daylight lighting. These broadband sources
cover the full spectrum of typical CCD sensitivity, ranging from 400-1100 nm.
The relatively flat response of the 4700 K source is particularly promising for an
HSI system, being both broad and relatively uniform. The 3500 K and 4100 K
have a CRI of>98, while the 4700 K source has a CRI of>99[10]. . . 56
4.11 Two NovaSol examples of the SRF modeling for the HSI systems, with FWHM
defining the Gaussian response. (Top) The VisNIR MicroHSI A detector with
no overlap of passbands and (below) the SWIR microHSI 640 with overlap of
passbands. . . 59
4.12 The contrast sensitivity function of the human visual system. The CSF decreases
beyond 3-5 cycles/degree due to optical limits of the eye, and decreases below
3-5 cycles/degree due to neuronal processing. (Left) A relative photopic curve is
highlighted along a visual representation of the CSF. (Right) The CSF also varies
by age, degrading over time (after Schieber, 1992) [11]. . . 61
4.13 The setup of the modeled scene, captured from the RIT Image, Visualization, and
Education Resource GUI. The parameters pertinent to the scene are also shown,
and mirror the radiometry setup outlined in Figure 2.1.rdis the distance from the
detector to the target,rsis the distance from target to source, andφis the angle
4.14 (Top-left) Calibrated reflectance image from the R-CHIVE MSI system, with an
80% reflector for integration time adjustment. (Top-right) The R-CHIVE system
with an adapted integration time to reach saturation of said panel. (Bottom-left)
The MicroHSI A detector with band 7 centered on the LED’s peak wavelength.
(Bottom-right) The HSI detector’s band 3, off-center of the LED peak by
approxi-mately 12 nm. All images are set with the bit depth as the maximum value for the
image. . . 67
4.15 Histograms of the images from Figure 4.14, for the original, current system, band
7, and band 3 left to right. As can be seen, the histogram is stretched in the
modeled images to use more of the dynamic range. Even more adjustment could
be done, as there is still a majority of the data that falls into the lower portion of
the dynamic range. . . 68
4.16 The impact of the noise on the images can be seen more clearly by histogram
stretching the images over the cal panels, which should have smooth responses
over their area. (Bottom-left) The modeled system on the centered passband 7
has an SNR that appears visually similar to that of the R-CHIVE sensor at this
resolution. (Bottom-right) As expected, the poor SNR of the off-center passband
3 highlights the noise inherent in the low signal image. . . 68
4.17 The original and modeled text portions of the image, showing visual impacts to
an-alysts and historians using the data. Again, the reintegrated images appear brighter
than the original, but the SNR remains very similar for band 7, but is more
de-graded in band 3. Band 3 could still be used by analysts or historians, as the text
LIST OF FIGURES xxi
4.18 The SNR of the current R-CHIVE system compared to the SNR of each passband
of the HSI system over the UV365 LED spectrum. In addition to the SNR values,
a curve of the source spectrum with arbitrary units is also overlaid (dashed line) for
a comparison of the HSI SNR curve to the shape of the source intensity. It is clear
the SNR follows the intensity profile for it’s constituent bands, which suggests the
system is operating in a photon-limited region of the detector. . . 70
4.19 The contrast/frequency pairs of targets and Poisson noise within the reflectance
image of Figure 4.17. Points falling under the CSF curves are discernible, while
points above the curve are not. This highlights the ability to see the overtext and
undertext within the image, while viewed at a scale of approximately a sentence,
while not being able to discern the Poissonian noise of the signal. . . 74
5.1 Effect of decreasing pixel pitch to increase spatial resolution, which produces a
“smoother-looking” image. The gray scale of the images has been scaled by
his-togram stretching to better illustrate these spatial differences. . . 80
5.2 MTF’s of variousQvalue systems compared to their Nyquist frequency,
normal-ized to the number of cycles per pixel. LowerQvalues result in higher frequencies
being allowed into the system, resulting in aliasing (right of the dashed line) as
well as sharper looking edges. . . 86
5.3 The contrast sensitivity functions of the human visual system by age (after Schieber,
1992) overlaid upon a sine wave of increasing frequency along the x-axis and
5.4 Effects ofQon image sharpness. Images with smaller values ofQappear sharper
as the amplitudes at large spatial frequencies are increased, but this can also
present aliasing. Depending on theQvalue and the frequencies of the image, this
may be indiscernible. The differences are more noticeable in the lower images
than the top, despite having the sameQvalues. . . 95
5.5 Aliasing at variousQvalues, increasing asQdecreases to the right. The true target
was blurred by the MTFs of Figure 5.2. The sampling size was selected for the
angular resolution of the horizontal bars at line 3 to be atρnyq. Aliasing is most
visible on the horizontal bars of target 2, as well as making out the numerals 2-4
in higherQ’s and being unable to do so at lowerQ. . . 96
5.6 Aliasing is highlighted in difference images (bottom) as new patterns. The original
image (top) is composed of bars at approximately a 15◦angle at discrete
frequen-cies, and a lower row of vertical bars regularly increasing in frequency. Aliasing
is shown inQ = 0.25(bottom-right) as horizontal bars in window 9, 45◦ bars in
10, and crossing bars in window 8. Aliasing in the lower row is highlighted as
irregular intervals. Q= 3(bottom-left) only shows differences based on blurring
and modulation of existing frequencies. . . 97
5.7 Effect of decreasing pixel size: spatial resolution increases linearly, while sensor
area decreases exponentially. Constant scaling is maintained across the top row of
images based upon the well depth of the system. The lower images are replicas
that have been histogram stretched to use the full dynamic range of the system,
LIST OF FIGURES xxiii
5.8 The same type of modeling as performed in Figure 5.7, but over a flat response
reflectance target to highlight the “salt and pepper” noise added to the system
due to lower SNR values at higher resolution. Lower resolution images, though
blockier, will maintain higher SNR over similar lighting conditions. . . 99
6.1 (Left) The High-Resolution Spatial/Spectral Scanning System (HS4) prototype
setup. It uses a Headwall Nano-Hyperspec HSI detector and a broadband 4700K
SoLux illumination source. These are attached to a scanning system that uses
CNC-machined parts to translate both the detector and source in three dimensions
above a scanning table. (Right) Source radiance of the broadband light across the
detector’s spectral response range. . . 108
6.2 The Cary Collection’s Italian antiphonal palimpsest, circa 1300 undertext with
1460 overtext. An RGB image taken with the RIT HS4 system, clearly shows the
overtext, with the undertext most visible in the margin at the top and bottom of the
image, written perpendicular to the overtext. . . 110
6.3 An overview of the image quality metrics’ (SNR, LSF FWHM, and spectral
dif-ferences) impacts on an image’s overallIQvalue for a range of sample values. . 117
6.4 A flowchart of the panchromatic sharpening process from input HSI and
panchro-matic images to output spatial, spectral and SNR comparisons. . . 119
6.5 (Top) The spatial distribution of pixels chosen for the ROI method of spectral
com-parison. Targets were chosen on red ink (highlighted in the software as red), blue
ink (blue), black ink (white), undertext (green), and hairless substrate (yellow).
(Bottom) The mean reflectance spectra of these targets, to be compared between
6.6 (Left) The hi-res panchromatic image taken with the Canon EOS 5D Mark III, and
(Right) a pseudo-color image of the text using bands 3 (displayed as red and blue
bands) and 4 (as the green band) of the MNF spectra after imaging with the HS4
system, effectively highlighting the palimpsested undertext in green. . . 124
6.7 Due to the significant size of the dataset, with both high spatial and spectral
resolu-tion, only a swath of the total image could be analyzed due to memory limitations.
The swath is shown here taken from the (Top) pan, (Middle) HSI, and (Bottom)
GS sharpened datasets. These are registered pixel-to-pixel for simplified spatial
and spectral comparisons. . . 125
6.8 An example of the spatial sharpening accomplished with the (a) original HSI data
captured, (b) the 1/20 resolution downsampling of the image, (c) the
Nearest-Neighbor Diffuse and (d) Gram-Schmidt panchromatic sharpening methods. Though
GS appears sharper, and does outperform NND according to FWHM metrics, it is
clear there is a step function remaining from the pixelated low-resolution input.
The x-profile, shown below each image, makes this clear as smooth curves across
edges become plateaued. . . 125
6.9 The mean SAM values of the sharpened images using (Top) NND and (Middle)
GS methods. The NND method is shown to have less accuracy on the blue ’H’ than
the rest of the image, while the GS method tends to perform almost equally across
the inks. (Bottom) Not only does NND before better on average at this scale, but
it also has less variance in its distribution, making it the better performing method
LIST OF FIGURES xxv
6.10 The mean SAM values of the 10×downsampled (Top) and then sharpened
im-ages using (Middle) NND and (Bottom) GS sharpening methods. Below these are
the histograms of the SAM distributions. Downsampling artifacts appear is the
10×downsampled image and remain after NND sharpening. The GS sharpening,
however, seems to weight the pan image more heavily in its spectral distribution
method. . . 127
6.11 The mean SAM values of the 20×downsampled (Top) and then sharpened
im-ages using (Middle) NND and (Bottom) GS sharpening methods. Below these
are the histograms of the SAM distributions, showing NND again matching the
downsampled image more closely, to include the downsampling artifacts. . . 128
6.12 The SoLux light spectra over various dimmer settings, with the total integrated
lux labeled in the legend. Three different measurements of total illumination were
measured by varying wavelength bands: total lux (lum/m2) (red dashed lines), effective illuminance (W/m2) over the range of the detector (blue dash-dot lines), and equivalent illuminance (W/m2) over the full spectra (black lines). . . 133 6.13 (Top) Semi-log plot ofIQvs dose on a log axis, for the Table 6.1 dataset. While
the largestIQcame from the highest dose, relatively comparableIQs were achieved
at significantly lower doses with pan-sharpening. (Bottom) SAM, LSF, and SNR
breakdown metrics of the same dataset. . . 134
6.14 TheIQvalue per lux dose received for each imaging setup in the height-adjusted
experiments. The regular imaging setup of 270 lux and 25 ms are highlighted
with a red rectangle for a more direct comparison to one another, and regularly
6.15 A diagram to be used with reference comparisons between various imaging
scenar-ios (GSD, integration time, source intensity), creating a “quad-chart” highlighting
decision-points based on change in image quality vs. change in total dose. If
im-age quality/dose is a user’s objective, then imaging scenarios falling within the
green areas should always be chosen before the reference scenario, and red should
never be chosen. . . 137
6.16 Quad-chart referencing 235270base, varying only source intensity from 270 lux to
2210 lux. A largeIQimprovement is achieved at a significant increase to total dose.138
6.17 Quad-chart referencing 34025270base, varying only GSD, ranging from 403 ppi
to 116 ppi (higher imaging heights correlate to larger GSD and lower ppi
reso-lutions). A range of IQ improvements are achieved at various impacts to total
dose. . . 138
6.18 Quad-chart referencing 47025270base, varying only integration time from 25 ms
to 98 ms at 270 lux. AnIQimprovement comes at a slight cost to dose. . . 139
6.19 Quad-chart referencing 23552210base, varying only integration time from 5 ms to
25 ms at 2210 lux. Similar to Figure 6.18, but with more drastic changes to IQ
and dose. . . 139
6.20 Quad-chart referencing 47098270base, adjusting GSD and integration time to
main-tain similar total scan times and dose. Increasing GSD and integration time results
in increasedIQwith no impact on total dose. . . 140
6.21 Change inIQvs change in dose compared to base image 716215270. The
quad-rants of the plot represent decision parameters for a user, with green representing
methods withIQimprovement at no dose costs, and red representing methods that
LIST OF FIGURES xxvii
6.22 The reference image from Figure 6.21 compared with illustrative samples from
key regions of the figure, showing a qualitative comparison between IQ gained
or lost, with reference to total dose cost or savings. The region from which each
image is pulled is outlined by a corresponding color to a marker placed in the
original figure as a reference. . . 142
6.23 A decision-making flowchart for imaging cultural heritage objects in HSI or MSI,
potentially under constraints involving total dose, illumination intensity, or time.
The primary variables include integration timet, light intensity,φ, and GSD. . . 147
C.1 Another way of visualizing IQ improvement vs dose cost. This orders the best
performers of each dataset based on their IQ value, and then measures how much
change in dose there is to achieve that value. The green section should always be
utilized, as it increases dose at no dose cost or a dose savings, while the red section
comes at significant dose cost. . . 174
C.2 IQ vs lux, equivalent illuminance, and effective illuminance as defined by
Fig-ure??. The datasets are primarily translated from one another, with the sameIQ
values and relatively similar doses values compared to one another. TheIQ
im-provement though relatively small in lux·hr photometric units can be seen to be
much more significant when integrated over the entire spectrum. . . 175
C.3 (Top) IQ breakdown by SNR, SAM, and FWHM metrics. (Bottom) A closer
(reduced dose-range) inspection of the low-light illuminated targets at 270 lux.
List of Tables
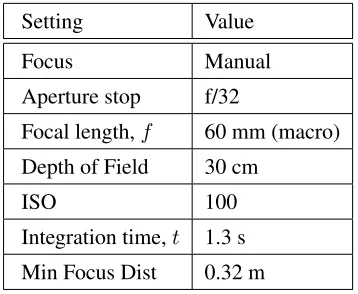
3.1 Settings used on Canon Rebel t2i DSLR for optimal SFM reconstruction. . . 25
3.2 Spectral reconstruction accuracy of Gram-Schmidt pan-sharpened and digitally
flattened document, measured using SAM, EUD, and ERGAS. The most accurate
sharpening/flattening method is highlighted in bold. The column labeled ’F2S’
used the Flat-to-Sharp method, with the final two columns Sharp-to-Flat. . . 30
3.3 Variance within±10◦of angle histogram peaks in curved and flattened images. . 31
3.4 Median absolute deviation within±10◦ of angle histogram peaks in curved and
flattened images. . . 32
3.5 Medians of±10◦of angle histogram peaks in curved and flattened images. . . . 32
5.1 Example targets at given NIIRS levels and their associated approximate sizes. . . 81
5.2 Acoefficients for GIQE 5. . . 82
5.3 Proposed cultural heritage relevant targets at theoretical NIIRS levels and their
associated approximate sizes. . . 94
6.1 Experimental setup for adjusted height image captures. Includes height (h) setting
of detector, resolution, scan speed, integration time (tint), x-shift of the scanning
system, and total lux on target. . . 120
6.2 The SAM and EUD values between the mean reflectance spectra of pure pixels
chosen for the ROI method. NND outperforms GS in eight of ten cases, defining
it as the most spectrally accurate reconstruction of the base image. . . 121
6.3 Gram-Schmidt (GS) and Nearest-Neighbor Diffuse (NND) panchromatic
sharp-ened and spatially downsampled (10×and 20×) HSI images to a 4.8×resolution
HSI ground truth, using SAM, EUD, and ERGAS. The best sharpening method
for each measurement and resolution is listed in bold. . . 129
6.4 Spatial comparisons of the different palimpsest images and sharpening results.
This includes FWHM measurements of the LSF, where smaller numbers correlate
to sharper images, and SNR values. . . 129
6.5 Spatial comparisons of the downsampled palimpsest images and sharpening
re-sults. This includes FWHM measurements of the LSF, where smaller numbers
correlate to sharper images, and SNR values. . . 130
6.6 Verification of shift-subtraction method for same-scene SNR estimation found to
be on average 5.15% accurate. . . 131
6.7 Image quality values of the different downsampling and sharpening methods. An
IQ ratio is included for ease of comparison between methods, normalizing the
data to the best-performing method, NND at reference GSD (4.8×). . . 132
B.1 An overview of the objective and threshold requirements considered for the
Chapter 1
Introduction
The scientific method is very important to those who value integrity and the search for truth and
understanding. This process begins with observation and investigation of the world around us,
which results in the forming of hypotheses. These hypotheses are tested agnostic to their expected
outcome and, whether accurate or inacurate, the results are recorded and communicated.
Regard-less of the result, this process can fuel future questions and investigations, restarting the scientific
method. Cultural heritage is mankind’s recording of this cycle at a societal level, transcribing past
lessons learned from a given culture. World history contains a millennia of experiments, solutions,
and failures by our predecessors for future generations to learn from. And with true genius being
so rare, whether artistic or purely intellectual, how devastating would it be to mankind as a whole
to lose those intermittent sparks of inspiration and wonder?
Scientists and academics are in a unique position to fully appreciate this. Our history as a
world is essentially this continual process of finding what succeeds or what fails, occasionally
changing the world forever along the way (see Homer, Beethoven, Socrates, Pythagoras).
Com-bating our preservation of this history of knowledge, Mother Nature, time, and mankind itself may
degrade historic texts or artifacts. Mother Nature provides a seemingly limitless number of ways
to cause destruction to documents and artifacts, whether by fire, earth, wind or water. Over time,
these historic documents decay as their inks fade or materials react. And, some humans, typically
religious or extremist groups, unfortunately work against the greater good by looting, damaging
on purpose or by accident, or destroying works that don’t fit specific paradigms of acceptance.
We can see this repeated in history, throughout numerous wars and occupations, as temples, art,
libraries, and more have been destroyed by man. For the defenders of history, having the proper
tools to combat these processes provides us the best chance to protect, and even regain, historic
knowledge. One of those tools is spectral imaging; including imaging and scanning across
mul-tiple wavelengths of light, potentially highlighting information invisible to the human eye. The
Rochester Institute of Technology (RIT) Chester F. Carlson Center for Imaging Science (CIS) is a
group that conducts this spectral imaging of cultural manuscripts. Though multispectral imaging
systems were available to the CIS for this task, capable hyperspectral scanning systems were not.
The goal of this research is to understand techniques to achieve useful, high quality hyperspectral
images of sensitive cultural heritage manuscripts under low-illumination conditions.
1.1
Relevant Parameters
Experimentation and development of an image quality (IQ) metric will be used to compare
ad-vantages and disadad-vantages of various imaging systems, to find which systems best fit the given
set of requirements. The parameters generally consist of detector and optic specifications,
includ-ing some of high import such as spatial resolution, spectral resolution, spectral response, sensor
well depth, signal-to-noise ratio (SNR) and dark noise parameters, modulation transfer functions
1.1. RELEVANT PARAMETERS 3
requirements, as the perfect cultural heritage imaging system will mean very little if it is
pro-hibitively expensive or locked in a laboratory that no cultural heritage documents will be sent
to.
Techniques will be considered to improve upon limitations of a purely hyperspectral
imag-ing system, most notably signal and spatial resolution limitations. One technique to improve on
these limitations is panchromatic sharpening, fusing information between high spatial resolution
monochromatic or RGB detectors and high spectral resolution hyperspectral detectors. An
ad-ditional technique associated with such a high spatial resolution camera attached to a scanning
system is “structure from motion” (SFM), the generation of a 3D model of the target using
mul-tiple images from various viewing locations. Leveraging computer vision and image processing
techniques combined with SFM can digitally remove projective deformities from a purely nadir
image. Structured light could also be considered to accomplish this, but would require the addition
of a projector system. Fourier methods can be used to analyze the outputs of these techniques, as
well as help model expected outputs of imaging systems given detector specifications.
Given that much of the work in analyzing results of the imaging hardware and processing
sys-tems are done through visual inspection, human vision constraints are also considered as limiting
factors for the system. In particular, the resolution of the human eye and the contrast sensitivity
function (CSF) of the human visual system (HVS) are considered for sampling and noise limits
respectively. The spacing of photo-receptors within the eye limits the maximum resolution that
can be seen. If it can be assumed that a cultural heritage document was created for human vision
to interpret, then the capabilities of the imaging system can be matched to the document’s design.
This allows the user to avoid imaging a target well beyond the limits of human vision, which may
come with a cost of decreased signal-to-noise ratios. The contrast sensitivity function can be used
HVS, either due to physical limitations or neuronal processing.
1.2
Application
It is a combination of radiometry, system modeling, Fourier methods, digital image processing,
and the human visual system that is required to find a novel yet affordable design for use in cultural
heritage imaging within RIT’s Center for Imaging Science. Leveraging knowledge from these
fields will help find an ideal balance between capability and cost, meeting threshold requirements
while working within a trade space to try and achieve objective requirements and get the most
benefit out of a given system. This will allow for a system to be defined for cultural heritage
imaging users without a national lab funding, yet more technically sound than buying the first
hyperspectral sensor that meets a given budget.
1.3
Safe Light Levels
Similar to the fading of a baseball cap left on the dashboard of a car, or the sun-side of curtains
in the window of a house, illuminating cultural heritage manuscripts can cause damage in
vari-ous ways; exposure to ultraviolet (UV) and infrared (IR) illumination are two primary concerns,
causing damage through chemical or thermal interactions. Standards for imaging or even
display-ing documents range widely from curator to curator, and even among different written standard
(which certainly makes them seem less “standard”). Significant care was taken within this research
to explore these varying thresholds of illumination and work within those safe illumination levels
to provide the most assurance possible to curators that undue harm will not come to their prized
1.3. SAFE LIGHT LEVELS 5
ASTM D 4303-10andISO 11341:2004.
Combining these requirements with a selected imaging system and modern image processing
techniques will enable operation and analysis at the highest capabilities possible while
maintain-ing safety of the target. Specifically, panchromatic sharpenmaintain-ing is used to combine a high spatial
resolution monochromatic image with a hyperspectral image collected at lower spatial resolution.
Both images were taken at low light levels and combined to create a high spatial and spectral
res-olution image, with varying signal-to noise ratios that depend upon the experimental setup. The
image quality of these images are finally compared to one another, while weighting the lighting
dose required to illuminate the target, to find the best methods for achieving the highest image
Chapter 2
Background
2.1
Imaging Techniques
Photography is an art-form that took shape in the early 19th century with the camera obscura, or
pinhole camera. More advanced photography evolved with the exposure of silver to photons in
various media, from early daguerreotypes to silver halide emulsion film. In more modern systems,
photons impart their energy into a system, using an Analog-to-Digital Converter (ADC) to turn a
continuous signal into quantized digital counts. Electrons are counted on individual pixels, with
intensity at a given location pixel measured based on how many electrons were generated there
during a specific integration time. The maximum number of electrons a pixel is capable of storing
is known as the “well depth” or “full-well capacity” of the pixel. Thanks to photographs and
movies, the general populace has a decent understanding of black-and-white and/or color imagery.
However, the process behind capturing color images is sometimes misunderstood. The analog to
television screens or monitors tends to do a decent explanation of metamerism in the human visual
system, where a specific combination of discrete colors can trick the brain into seeing a different
color than any of the constituent parts. When arranged in a regular pattern of colored pixels, called
a Bayer pattern, filters of an RGB camera, or the RGB LEDs of a computer or television screen,
can recreate nearly any color for the HVS.
No matter which imaging method is chosen, radiometry plays a vital role in determining which
photons reach the detector. Radiometry is the science of following photons from source to target to
detector, while accounting for losses via atmospheric scatter and absorption, target absorption,
fil-ter transmissions over optics or pixels, efficiency of the detector to convert photons into electrons,
and anything else that may occur between the source and detector. A schematic representing this
process is shown in Figure 2.1, where the source is an LED light bank, the target is a manuscript,
and the detector is a monochromatic camera. The analog for environmental remote sensing would
have the sun as a source, the Earth as the target, and a detector perhaps on an airborne or space
platform.
2.1.1 Multispectral Imaging (MSI)
Typical photography from digital cameras involves a set of pixels covered with red, green, or
blue filters. These filters are organized in a specific order, usually a Bayer pattern. This pattern
spreads the measurement of different colors of light evenly across a detector, while doubling the
green band, as that is where the human visual system is most sensitive, and would therefore notice
the most difference in reproduction accuracy. A blue-green-green-red Bayer pattern is shown in
Figure 2.2. This is the foundation of “multispectral” imagery, utilizing three bands in this case.
Monochromatic, or black-and-white, imagery is created by capturing all photons across a
rela-tively large bandpass. The term “multispectral image” can be thought of as an image created with
multiple bands of wavelengths collected through the use of filters or colored illumination. Filters
sys-2.1. IMAGING TECHNIQUES 9
Figure 2.1: Schematic of a simplified radiometric model following photons from an LED source to a diffusing panel, onto a target of given reflectance, and to a detector with specific transmittance values for optics and dispersion patterns, converting the energy from the photons to electrons within the detector based on a wavelength-based quantum efficiency.
[image:40.612.208.364.438.600.2]tem. Another method would be to use a monochromatic detector, but limit the wavelengths of light
output to the target, either by LEDs or filters over broadband sources. The wavelength captured
by the monochromatic detector therefore follows the spectral output pattern of the source.
A benefit of MSI is that high resolution images with relatively large SNR are captured quickly,
as the passbands tend to be large, allowing more photons through, and the system is already setup
with a framing camera which may have very fine spatial sampling (50 megapixel, MP, detectors
are not uncommon). The downside is that, depending on the system setup, changing filters or
lighting conditions for each image could add a significant amount of time. Additionally, the same
metamerism process that results in different inputs producing the same perceived color leads to
the inability to distinguish some signatures, as the low spectral sampling could fit multiple varying
signatures.
2.1.2 Hyperspectral Imaging (HSI)
Hyperspectral imagery takes “multiple bands” one step further, typically consisting of hundreds
of discrete, contiguous spectral bands. This is achieved using a prism or diffraction grating that
spreads the light into its constituent parts. Liquid Crystal Tunable Filters (LCTF) are electrically
addressable spectral bandpass filters. In each state, only a specific passband of light is allowed
through. Shifting this over multiple contiguous bands would result in a hyperspectral image.
Because a prism or diffraction grating spreads incoming light over an area of space (imagine
a crystal diffracting light into a rainbow), one direction of the detector system is typically devoted
to capturing the different wavelengths of light. This means that, for a 2D detector, only one
dimension of spatial information is captured at a time. This is different from the LCTF, where two
dimensions of spatial data are captured with a framing camera, but only over one narrow passband
2.1. IMAGING TECHNIQUES 11
Figure 2.3: An example of a pushbroom HSI system taking data in the along-track direction of a target text. The imaged text is dispersed down the along-track direction of the detector’s pixel array, with the 1D spatial dimension captured in the across-track direction.
or the target must be translated with respect to the other, scanning images line-by-line to construct
a 3-D hyperspectral data cubef[x, y, λ]. The imaging process of scanning one line at a time is
known as a “pushbroom” scanner (Figure 2.3), with one line of imaging being dispersed across
the detector array.
The primary benefit of HSI is the potential for high spectral resolution. This reduces the
chances for metamerism to affect material analysis. Most spectral targets can be defined to a high
fidelity using HSI. A drawback of this method is that the SNR can decrease given similar
integra-tion times to MSI, due to the highly selective nature of the spectral dispersion. Narrow passbands
result in fewer photons of each given wavelength reaching the detector. To make up for this,
reduce the overall spatial resolution of the detector if its total area remains the same. The
pushb-room scanning method results in a relatively straightforward capture process, with registration of
overlapping scans being the primary concern.
By collecting hundreds of wavelength bands and calibrating out the illumination source, a
fine resolution reflectance spectra can be generated for each pixel in the image. This reflectance
spectra, at an appropriately high spatial resolution, can act as a unique fingerprint for different
materials. A recent review described it as “one of the best nondestructive technology allowing to
perform the most accurate and detailed information extraction” of a target. Methods like partial
least-squares can be used to compare physical-chemical parameters and discriminant analysis can
be used with a priori knowledge to generate material classification predictions [13]. This would
be impossible to replicate in such detail and accuracy with an MSI system.
2.2
Cultural Heritage Recovery and Discovery
Cultural heritage imaging is a multipurpose process. Posterity is the simplest goal, maintaining
a representation of the target in its current state via digitization. This preserves the document
digitally for future generations to be capable of viewing and interpreting, protecting at least the
target’s image from physical degradation or loss. Recovery efforts tend to focus on damaged
targets, whether by fire, mold, mildew, or human interaction. A regular practice in early years
of literature was to palimpsest, or overwrite, a document deemed no longer vital. This substrate
would be reused, as paper and papyrus could be rare or difficult to come by. Despite the many
ways to decay or erode original text, techniques exist to recover the text from man-made or natural
damage, and imaging across multiple spectral bands is one of the least invasive ways of doing so.
dur-2.2. CULTURAL HERITAGE RECOVERY AND DISCOVERY 13
ing image capture. This can arise from a number of sources, but in cultural heritage imaging it
often stems from fluorescence techniques, where text not visible to the naked eye will become
highlighted via fluorescent imaging. Additional details of targets, such as authors, pigment/text
classification, or changes to the text over time can also be discovered by subtle differences in the
spectral response of the targets. Discovery also relates to codicology, or the study of codices or
manuscripts themselves. Instead of revealing lost text, the goal of codicology is to find out
in-formation regarding the document, such as its history, material analysis, or composition method.
Because this can be reliant upon fine spectral details between similar targets, HSI can play an
important role in the material characterization process beyond the capabilities of MSI.
The goal of imaging historic documents and artifacts typically falls into one of these
cate-gories: posterity, recovery, or discovery. A prime example of all of these is the imaging of the
Archimedes Palimpsest, a codex copied over a thousand years ago, erased in 1229 CE (after the
sixth Crusade), used as a prayerbook, discovered in the 1800’s, lost again in World War I, and
finally recovered in the late 1990’s. Using multispectral imaging, pseudocolor rendering,
prin-cipal component analysis, and least squares spectral unmixing allowed the original Archimedes
undertext to be highlighted from both the overtext and mold damage [14]. First and foremost, the
primary goal was posterity, as the state of the manuscript was degrading significantly over the past
decades due to the significant mold damage and a number of pages being lost. The Archimedes’
palimpsest was recovered as discussed above. This one codex contained works of import to
math-ematics, philosophy, and history [15]; in addition to the Archimedes text, palimpsests were
dis-covered within the codex including Athenian orator Hypereides’ commentary on Aristotle and a
treatise on the history of St. Pantaleon. These types of achievements should be considered as
benefits achievable with a MSI system.
famous for being the oldest surviving map of the British Isles in recognizable geographic form.
The map illustrates distances, rivers, and villages of significant size. Analysis revealed five
domi-nant red pigments with their own spatial pattern across the map, leading to insight regarding how
the map was edited over its history [16]. Similar work was performed on the green pigments of
the Selden map of China. These pigments were found to be used to edit the ocean and islands in
the Pacific as well as riverways throughout China [17]. These types of achievements should be
considered as benefits attainable with an HSI system, and generally unattainable with the limited
spectral resolution of an MSI system.
2.3
Light Damage to Manuscripts
Anecdotally, imaging professionals in the field have run into varying degrees of uncertainty
re-garding lighting limits and requirements for imaging historic manuscripts. Gregory Heyworth
from the University of Rochester has encountered reactions ranging from reticence to
noncha-lance regarding various documents, with UV illumination being a cited concern. John Delaney
from the National Gallery of Art, highlights light damage as a major concern for art pieces and a
major consideration in system design. However, we have not yet had historians or imaging experts
to direct us toward one limit.
David Howell from the Bodleian Library and Andrew Beeby of Durham University are
fa-miliar with the UK standard (PAS 198:2012) of 50 lux as a limit for displays of cultural heritage,
which is set based on HVS capabilities, age, as well as the contrast of the document. The
50-lux level was selected for a 25-year-old, with a 50% contrast object, and a “difficulty level” of
30 (which varies based on exposure and size in accordance with the HVS), to have 75% “visual
inten-2.3. LIGHT DAMAGE TO MANUSCRIPTS 15
sity [18]. This has much variability based on age, contrast, and difficulty, but serves as an actual
benchmark to compare lighting levels to.
This threshold of 50 lux is selected under the premise that the total amount of damage to a
target is dependent upon the total amount of energy incident on the target. Therefore it is both
wavelength (or energy) and exposure dependent. It also operates under similar conditions to
med-ical levels of radiation damage for humans, where there is technmed-ically no “safe” limit to avoid
damage, but all incident light is potentially damaging. This measurement of lux is the intensity
at the target, and is therefore dependent upon power of the source as well as distance to the
tar-get. The total dose, due to its temporal dependence, follows the units of lux-hours (lx·h) [19, 20].
Therefore an object on display 8 hours a day for a month at the 50-lux limit would achieve 12,000
lx·h of dose, but a document imaged with a hyperspectral detector for a day, under possibly 1000
total lux-equivalence across its broadband source, could reach 8000 lx·h. This helps to link
imag-ing light levels to a display-time equivalent, with which museums should be familiar.
One of the major drawbacks of lux as a measurement of total dose is its reliance upon the
spectral response of the human visual system (HVS). Because of this, IR and UV aspects of
the source fail to be accounted for with photometric units like lux. The HVS photopic response
function,V(λ), is taken from Commission Internationale de L’Eclairage (CIE) in 1988 [21], and
is shown in Figure 2.4. The illuminance,Ev(λ), at the target from a point source is measured as
Ev(λ) =
Z ∞
0
Φ(λ)
4πr2 ·κdλ[lux], (2.1)
Figure 2.4: The photopic spectral response of the human visual system, as reported by CIE in 1988 [1].
scaling factor relating the signal modulated byV(λ)to its total output spectrum
κ= R∞
0 L(λ)V(λ)dλ
R∞
0 L(λ)dλ
·k, (2.2)
wherekis the scale factor 683 W/lm, such that a 1 W monochromatic source at 555 nm (the peak
ofV(λ)) would equate to 683 lm.
The other concern for illumination, beyond total integrated dose, is the impact of high-energy
2.3. LIGHT DAMAGE TO MANUSCRIPTS 17
all wavelengths equally, as total dose measurements do, but expects higher energy photons to
cause different excitations and degradations for different types of object (parchment, paper, etc.).
Piccablotto, et al., [2015] cites an Italian standard, “Addressing the technical-scientific criteria and
operating standards for museums”, for UV lighting limits of 10µW/lm for “very high-responsivity
objects” [22].
The unit ofµW/lm relates to luminous efficacy of bulbs, for its lumen-to-watt conversion.
However, this conversion is not relevant for UV light. We were unable to find the 10µW/lm limit
referenced by Piccoblotto, et al., and were further unable to find the definition for varying “levels
of responsivity objects,” nor how the authors accounted for varying energy levels of UV light. It
is odd, from a physics standpoint, to say UV light is different than visible, but then to treat all UV
light equally. All of this highlights the unclear limits set on imaging standards of sensitive objects.
Recent research on impacts of wavelengths of different LEDs found that shorter wavelengths
produced more damage, with 447-nm LEDs causing nearly ten times the relative damage as
627-nm LEDs. Relative damage, in this case, was calculated using the color difference of the damaged
target compared to the effective radiant exposure in W·h/m2. This work also referenced 100 lux as an average illuminant of paintings in a museum, twice that of the European PAS standard [23].
Though aging and damage assessments followed ISO and ASTM standards, they disagreed with
one another on acceptable levels, withASTM D 4303-10 citing 500 W/m2 andISO 11341:2004 citing 1440 W/m2.
Based on the widely varying existing standards and best practices, the lowest stable light level
achievable with typical museum light sources (SoLux 4700K bulbs [24]) was used for imaging.
Because of the short working distance of the hyperspectral scanner, this correlated to
approxi-mately 270 lux. The SoLux bulbs, which are used in museum displays as well as HSI imaging
For this type of bulb, the 270 lux translates to approximately 151 W/m2. This fell safely below the ASTM and ISO limits and equated to 57 lx·h, approximately an hour’s total dose according to
PAS198:2012 (50 lx·h). The goal of the research is to test if images taken at these low-illumination
levels can still be useful to analysts and historians, given an image quality metric encompassing
spectral accuracy, spatial sharpness, and SNR. Achieving such meaningful results, while
main-taining illumination near museum levels, would both encourage curators to allow access to their
artifacts or manuscripts due to the low-risk imaging process and help ensure imaging professionals
Chapter 3
Additional Imaging Techniques
After understanding the background and sensitive nature of cultural heritage artifacts, it is
impor-tant to understand the tools that may be used to work within the parameters that will keep the
documents safe. Cultural heritage artifact imaging has been performed by the Center for Imaging
Science (CIS) at Rochester Institute of Technology (RIT) since the early 1990’s. Primarily, this
analysis has been conducted with a multispectral imaging (MSI) system. MSI is used in
conjunc-tion with x-ray fluorescence (when available) to uncover spectral informaconjunc-tion about an object that
is hidden from the human eye [15]. While these techniques are critical in the analysis of historical
documents, additional devices and methodology could be utilized to improve the end product for
analysts and historians. Specifically, “structure from motion” (SFM) and panchromatic sharpening
are helpful, non-intrusive methods to improve analyst interpretability, and can be used with either
MSI or HSI systems.
3.1
Structure from Motion and Panchromatic Sharpening
If a document is warped from water, fire, or other physical damage, some text may be difficult to
read or completely illegible due to projective distortions of imaging the warped document simply
from nadir. Because of the sensitivity of some artifacts or documents, physical manipulation
may be impractical or destructive. However, techniques exist to “unravel” or “flatten” a warped
object digitally instead of physically, into two dimensions (2D). Throughout the remainder of this
dissertation, unless otherwise stated, any reference to an action performed on a document such as
unraveling or flattening will be purely digital, not physical.
There has been much work in the field of restoring historical documents thought to be beyond
meaningful recovery [25]. Imaging systems in the medical field have been leveraged to conduct
3D depth imaging of documents and artifacts; scrolls once burnt and charred to carbon are now
able to be scanned and unraveled. This allows the user to identify how many layers of the scroll
are present and whether or not a signature of ink exists for a particular layer. Combining the depth
information with physical locations of scans and signals from carbonized ink, a team is able to
“unroll” a scroll layer-by-layer, line-by-line, and place text in its appropriate 2D locations [26].
The work in this dissertation is focused on less severe damage, such as documents warped from
age, environmental damage, or binding. With warped pages, some text can be lost or obscured by
the page itself. This projective distortion can be captured in a mathematical sense, in which case
it can be undone with a mathematical transformation [27]. Unraveling or flattening a document
requires specific understanding of the 3D layout of the document, which can be represented by a
vectorized mesh.
One method of obtaining 3D information of an object is through SFM. With regular
3.1. STRUCTURE FROM MOTION AND PANCHROMATIC SHARPENING 21
increasingly accessible medium for 3D reconstruction of objects and scenes. SFM is the process
of developing a three-dimensional surface map of a scene by moving a camera’s location, similar
to how the human visual system utilizes parallax to estimate depth. However, the process is made
simpler in terms of equipment required, where instead of using stereo-vision, an individual can
use one camera taking images of a single scene from multiple viewpoints [28]. This capability
is only enhanced with similar advances in the software used to perform such 3D reconstructions
[29–31].
Though flattening processes have been investigated in the past, the proposed SFM method
with a framing panchromatic camera also matches well with the process of taking low spatial,
high spectral resolution imagery with a pushbroom-style sensor. This would result in two sets of
imagery, ideal for panchromatic sharpening. It is important to note some historic texts or artifacts
only have a limited amount of time to be imaged, either due to museum or detector limitations
[32]. Combining these methods can result in an image with both high spatial and spectral
infor-mation, digitally flattened for increased readability and total coverage area. However, combining
these methods warrants investigation into the order of operations between sharpening and
flatten-ing while maintainflatten-ing spatial and spectral fidelity of the object. Structured light could also be
considered as a method for determining 3D structure, where a known pattern of light is displayed
on an object, and the distortion of that pattern mathematically describes the topographical features
of its surface.
The two methods of sharpening used throughout this dissertation were Gram-Schmidt (GS)
and Nearest Neighbor Diffuse (NND) sharpening. Mathematically, the GS transform
orthonor-malizes a set of vectors. GS sharpening first simulates a panchromatic image using the combined
bands of the MSI or HSI image, conducts a GS transformation on the set of MSI or HSI bands
modeled one, and then reverses the process, resulting in pan-sharpened bands. The combination
of the GS transform with the simulated and spectral data was represented by [66] as
P an0sim =P anSim
M S10 =M S1−
< P an0Sim|M S1 >
< P an0Sim|P an0Sim >P an 0 Sim
M S02=M S2−
< P an0Sim|M S2 >
< P an0Sim|P an0Sim>P an 0 Sim−
< M S01|M S2 >
< M S01|M S10 >M S 0
1...
M Sn0 =M Sn−
< P an0Sim|M Sn> < P an0Sim|P an0Sim>P an
0 Sim−
n−1
X
k=1
< M Sk0|M Sn> < M Sk0|M Sk0 >M S
0
k, (3.1)
where ’ represents the transformed band after GS orthonormalization and< a|b >represents the
covariance between bandsaandb[66].
The NND method was developed to improve upon the radiometric accuracy of GS sharpening,
particularly outside the visible spectrum. This method instead uses an anisotropic diffusion
as-sumption, comparing similarity and proximity of surrounding nearest-neighbor pixels and
weight-ing their summation into subpixels of the registered panchromatic image. The diffusion method is
defined for a pan-sharpened imagePSas
PS(x, y) = 1
k(x, y)
9
X
j=1
exp
−Nj(x, y) σ2
×exp
−||(x, y)−(xu,v, yu,v)|x,y,j| σ2
s
M(u, v;x, y, j),
(3.2)
where (x, y) are pixel locations in the panchromatic image, k(x, y) is a normalization factor,
Nj is a similarity metric, and σ is the intensity range with σs smoothness factor affecting the
diffusion sensitivity. (u, v)are superpixel locations (registered HSI pixels of larger GSD), withj
3.2. METHODOLOGY TESTED 23
vector of the neighboringjpixels. Additional details regarding this equation and the normalization
constant can be found in [46]. With NND’s linear mixture model “reducing color distortion and
preserving spectral integrity”, it regularly achieved higher spectral accuracy compared to the GS
method [46].
The pan-sharpening method used in this section was Gram-Schmidt, due to its ease of use
within ENVI, and it is assumed the relative accuracy between order of operations with the GS
method will correspond to the relative accuracy of NND.
3.2
Methodology Tested
The image collection for this research included a scanning system for SFM that translated a DSLR
camera in the x-, y-, and z-directions. Because depth of field (DOF) increases with working
distance, the z-distance of the scanning system setup shown in Figure 3.1 was maximized to allow
large variations in target height, which can vary significantly in a distorted document. The x- and
y-directions cover approximately 18” x 36” respectively [33]. An image of the scanner is shown
in Figure 3.1.
Capturing appropriate images for the SFM operation required a number of manual adjustments
to be made to the Canon t2i Rebel DSLR camera used for imaging. Proper SFM requires a fixed
focal length without autofocus [28] to maintain continuity of objects and changes caused by the
motion of the camera. The focus was selected to match the average height of the target. The
prox-imity of the detector to target required the aperture set to its smallest radius, which increased the
depth of field on the focus, at the cost of signal. This caused the DSLR to try and “correct” for the
lack of photons by increasing the ISO, which increased the detector’s sensitivity, thus increasing
3.2. METHODOLOGY TESTED 25
with the noise buried within the image and actually produced the least complete reconstruction
of the target from all semi-automated settings previously attempted. An increased exposure time
increased the SNR and allowed for a lower ISO. With the settings shown in Table 3.1, a proper
[image:56.612.197.376.270.417.2]reconstruction of the target was able to be created with the Photoscan software.
Table 3.1: Settings used on Canon Rebel t2i DSLR for optimal SFM reconstruction.
Setting Value
Focus Manual
Aperture stop f/32
Focal length,f 60 mm (macro)
Depth of Field 30 cm
ISO 100
Integration time,t 1.3 s
Min Focus Dist 0.32 m
The target was a standard USAF 3-bar resolution test target (Figure 3.2). The bar targets
were expected to provide ideal measurements for flattening analysis, either by comparing bar area
or corner angles. The target was modified to include color targets for MSI or HSI sharpening
analysis. These color targets were red, green, blue, cyan, magenta, yellow, and black, with color
intensities varying from 0 to 100% in steps of 25%. All color blocks other than black were the
same size at 0.5”×0.5”, with the black bar twice the width of the others. After printing the
test target, it was traditionally scanned at high resolution as a ground-truth target for spatial and
spectral comparison. The 3D distortion applied to the target mimicked that of a bound book or
codex.
Figure 3.2: Traditionally scanned ground truth document. The target is a resolving power test target adapted for MSI/HSI use with color bars added to the bottom with varying intensities.
method here may be applied to any MSI or HSI system, the filters used in this case were
cen-tered on 550, 690, and 850 nm, each with a full width at half maximum of 10 nm. The focal length
of the lens was 8.5 mm and the pixel count of the CMOS sensor was 3840×2748 pixels with a
pixel pitch of 1.7 microns [34]. Because the camera was a high resolution framing camera,
pushb-room and mosaicing methods were not required to create the MSI image. Registration merely had
to be performed on a band by band basis to account for minor camera or platform motion between
filter adjustments.
Multiple pieces of software were used in the processing chain, and figure 3.3 shows an overview
of this process. Multip
![Figure 2.4: The photopic spectral response of the human visual system, as reported by CIE in1988 [1].](https://thumb-us.123doks.com/thumbv2/123dok_us/25491.1973/47.612.164.484.98.373/figure-photopic-spectral-response-human-visual-reported-cie.webp)