Survey: Adults in FE,
Apprenticeship, other LR and PCDL
Tracy Mitchell, Charlotte Beckford and James Davison and all colleagues at LSC, Skills Funding Agency, Young People’s Learning Agency and BIS who worked on the research for all their help and assistance; thanks are also due to all the survey respondents who gave up their time to take part.
Department for Business, Innovation and Skills 1 Victoria Street
London SW1H 0ET
www.bis.gov.uk
BIS Research paper number 17
Contents
Introduction ... 4
Background ... 4
Sampling ... 4
Sample profile ... 5
Multivariate analysis ... 6
Interpretation of data ... 6
Report structure... 7
Summary and Implications ... 8
Implications ... 11
Overall satisfaction ... 13
Satisfaction with the learning experience... 13
Advocating the provider... 16
What drives satisfaction with the learning experience?... 18
Performance on key drivers ... 19
Specific aspects of quality of teaching ... 22
Needs and expectations ... 25
Information, advice and support ... 28
Personalisation, learner involvement and provider responsiveness ... 33
Respect shown by staff ... 33
Relating to learners as people... 33
Listening and acting on learners’ views ... 34
Attitudes to learning and benefits of learning... 38
Feelings about education on leaving school ... 38
Feelings about learning currently... 39
Usefulness of course for future career... 40
Likelihood to undertake future learning... 41
Early leavers ... 43
Profile of early leavers ... 43
Reasons for leaving early... 44
Introduction
Background
This report presents the key findings for further education (FE), other learner responsive (LR)1, personal and community development learners (PCDL) and Apprentices aged 19 and over (described as adult learners for the purposes of this report), who took part in the National Learner Satisfaction Survey (NLSS) 2009. The NLSS was conducted by Ipsos MORI Social Research Institute and commissioned by the Learning and Skills Council (LSC). In April 2010, the LSC was superseded by the Skills Funding Agency and the Young People’s Learning Agency (YPLA). The LSC research function was transferred to the Department of Business, Innovation and Skills (BIS).
The NLSS is a large tracking survey of then LSC-funded learners aged 16 and over. The NLSS provides a wealth of data on learners’ satisfaction with their learning experience over time, including detailed information on three key aspects of the learner journey: initial choice and information; support during learning; and benefits of participation. There have been six national surveys since 2001 (annually between 2001 and 2004, 2007 and 2009). A total of 13,679 adults in FE, PCDL and other LR learning and Apprenticeships took part in the 2009 survey, out of a total of 25,084 telephone interviews conducted.
The 2009 survey comprises three waves, each dealing with a distinct set of modular questions:
Pre-entry advice and guidance (wave 15); Support for learners (wave 16); and Impact of learning (wave 17).
There is a set of core questions that are also covered in all three waves:
overall satisfaction with the learning experience;
overall satisfaction with the quality of teaching and management of learning; and how likely the learner is to return to learning in the future
Sampling
The NLSS covers learners in further education (FE), Apprenticeships, other Learner Responsive courses2, non-accredited personal and community development learning (PCDL), Skills for Jobs (SFJ) and Employability Skills programme (ESP) learning.
1
Other LR provision includes charities, HEIs, local authorities, business organisations, public or voluntary organisations.
2
Learners were sampled from the LSC’s individualised learner record (ILR), with the exception of PCDL learners who were sampled directly from local education authorities’ records due to the lack of a robust national database of these learners. In line with previous years of NLSS, quotas were set by local LSCs for the FE learners, and by local education authorities for PCDL learners.
Data from all learners drawn from the ILR were weighted using final ILR profiles for the 2007/08 academic year. Further details about the sampling and weighting approach are provided in the technical report.
Sample profile
Table 1 shows the demographic profile of learners aged 19+. PCDL and other LR learners are predominantly female, while there is a broadly even gender split across FE learners and Apprentices.
The majority of FE, Other LR and PCDL learners are 25 years old and over, while Apprentices are largely between 19 and 24 years old.
Table 1: Sample demographic profile (weighted)
FE Apprentices Other LR PCDL
(Unweighted Base: all respondents)
(7,547) %
(2,804) %
(1,389) %
(1939) %
Gender
Male 40 52 27 23
Female 60 48 73 77
Age
19-24 23 72 11 2
25+ 77 28 89 98
Ethnicity
White 83 92 81 93
BME 16 8 18 5
Refused * - * 1
Not known 1 * 1
-Disability 9 6 12 11
Learning difficulty
7 5 9 5
Multivariate analysis
In addition to standard analysis of the data, multiple regression (also known as key driver analysis – KDA) was used to examine the relative importance of a range of factors in explaining overall satisfaction with the learning experience. (PCDL learners were excluded from this analysis because the representativeness of this sample is unknown – there is no population profile data).
Interpretation of data
It should be remembered that a sample and not the entire population of adult learners on FE, other LR, PCDL course or Apprenticeships has been interviewed. Consequently, all results are subject to sampling tolerances, which means that not all differences are statistically significant.
Where percentages do not sum to 100, this is due to computer rounding, the exclusion of ‘don’t know’ categories, or multiple answers. An asterisk (*) denotes values above zero but less than 0.5 per cent.
In this report, reference is made to ‘combined scores’. This is where we combine ‘extremely’, ‘very’ and ‘fairly’, or ‘strongly’ and ‘tend to’ scores. The report also makes reference to ‘net’ figures. This represents the balance of opinion on attitudinal questions. In the case of a ‘net satisfaction’ figure, this represents the percentage satisfied with a particular issue, less the percentage dissatisfied. For example, if an aspect of learning records 40 per cent satisfied and 25 per cent dissatisfied, the ‘net satisfaction’ figure is +15 points.
Combined and net scores are calculated using the true value of the scores before they are rounded. This can result in a small discrepancy (usually one percentage point) between the combined score and the sum of the rounded scores it relates to.
This report also makes reference to mean scores for questions where learners were asked to rank an aspect of their course or provider on a scale of 1 to 10. The mean score is compiled by adding the scores provided by all learners and dividing it by the number of learners answering the question.
Report structure
This report is organised into six main sections:
Summary of key findings and implications;
Satisfaction with learning experience and advocacy; Satisfaction with teaching and the provider;
Needs and expectations;
Information, advice and support; and Early leavers
To protect the LSC’s interest in ensuring that the findings of this research are accurately reported, any such publications are therefore subject to the advance approval of Ipsos MORI.
Summary and Implications
Summary
Satisfaction with the learning experience
Overall, around nine in ten adult learners are satisfied with their learning experience, including around one in five who are extremely satisfied. Only one in twenty are dissatisfied. However, there has been a decline across all learner groups in the proportion reporting they are extremely satisfied with their learning experience, reversing the previous upwards trends.
Reasons for satisfaction and dissatisfaction with the course focus on the quality of teaching and issues related to the course. For all learner groups the quality of teaching is the most commonly-cited reason for satisfaction. A badly run course is the top reason for dissatisfaction among FE learners, Apprentices and other LR learners, whilst the course not being what they expected is the top cause of dissatisfaction among PCDL learners.
The majority of adult learners would speak highly of their provider, including around one in three who would so without being asked. PCDL learners are more positive about their learning provider than Apprentices or FE learners.
Satisfaction with teaching and the provider
As with overall satisfaction, a high proportion of adult learners are satisfied with the quality of teaching at their provider (around nine in ten), in line with 2007 levels. As is the case with advocacy, PCDL learners are more satisfied with the quality of teaching than Apprentices or FE learners.
Adult learners are also positive about specific elements of the course related to teaching, including the tutors making the subject interesting or enjoyable, understanding how the learner likes to learn and managing the group of learners. PCDL and other LR learners tend to be more positive than FE learners and Apprentices on all the specific course aspects we asked about.
Needs and expectations
Most adult learners feel that their learning experience has at least met their expectations, and around one in three say it has exceeded their expectations. However, around one in five learners says they did not know what to expect. Apprentices and FE learners are more likely to say they did not know what to expect, while PCDL learners are more likely to say it met their expectations.
Information, advice and support
The vast majority of adult learners are positive about the support they receive from their provider, with at least half reporting it is verygood. Similarly, adult learners across all groups are very positive about the support received from staff in the first few weeks of the course, with nine in ten saying it is good.
Around two in five adult learners have experienced problems on their course. For PCDL, FE and other LR learners the most commonly-cited problem is fitting course commitments in with commitments at home. In line with the more vocational nature of the course, Apprentices, however, are most likely to mention fitting their course commitments in with work commitments as an issue. Other problems among all learner groups are maintaining personal motivation, keeping up with the standard of work required and dealing with money pressures.
Most adult learners feel that they received good information when they were choosing their course, including around two in three who say it was verygood.
Personalisation, learner involvement and provider responsiveness
The vast majority of adult learners feel the respect staff show to them is good, with PCDL learners the most positive, followed by other LR learners.
Adult learners also rate their tutors well on how they relate to them as people, with mean scores ranging from 8.42 (FE learners) to 8.74 (PCDL learners). PCDL and other LR learners rate their tutors significantly higher on this measure than Apprentices and FE learners.
The majority of adult learners say their provider is good at listening to their views, with Apprentices the most positive. Furthermore, the majority think their provider is good at acting on those views. While these figures are slightly lower than those who agree their provider listens to their views, much of the reduction comes from an increase in learners saying they do not know or that this does not apply.
Attitudes to learning and the benefits of learning
Roughly over half of adult learners say they had positive feelings about education when they left school; this proportion ranges from 52 per cent of Apprentices and other LR learners to 63 per cent of PCDL learners.
Usefulness of course for future career
A high proportion of adult learners say their course will help them in their career or future jobs. The exception to this is PCDL learners, who, perhaps reflecting the type of courses they are taking, are less likely to agree. Apprentices are the most positive about the usefulness of their course.
Likelihood to undertake future learning
Around three in five adult learners say they are likely to undertake learning in the next three years, though for Apprentices the proportion drops to just under half. Other LR and PCDL learners are most confident about enrolling in further learning.
Which learners are more satisfied, and which are less satisfied?
The key factor influencing overall satisfaction and attitudes to various aspects of the learning experience is the learner’s status on the course – specifically whether they have left the course early. These learners are less satisfied than other adult learners with their learning experience and are less positive over a range of measures.
In terms of learner groups, PCDL learners tend to be more positive about all aspects of their learning experience compared to other learner groups.
Whether or not the learner pays fees also has a bearing on satisfaction: those who do not pay fees are generally more positive about their learning experience than those who do. For instance, satisfaction with learning experience and advocacy tend to be higher among other LR and PCDL learners who do not pay fees compared to those who do pay fees. These differences could be linked to learners’ expectations: those who pay fees are more likely than those who do not to have expectations about the course.
Related to this, FE learners who claim financial support (e.g. an Adult Learning Grant) and those who hold a Skills Account or an Adult Learner Account are more positive than those who do not about aspects such as learner involvement, provider responsiveness, the impact on the course on their future career and on their feelings about learning. This is in line with differences observed in this learner group as a whole.
FE learners on Level 3 courses tend to be less positive than FE learners on Level 2 or lower courses. They are more likely to say their course is worse than they expected, to have problems while on their course and to be dissatisfied with their learning experience.
more likely to be satisfied with the quality of teaching and aspects relating to it, such as managing the group of learners and making the subject interesting.
It should be noted that the differences described above are small, and satisfaction is high across all demographic groups.
Early leavers
The profile of adult early leavers is broadly similar to learners as a whole in their respective learner groups, though there are some differences. Women on FE, Apprenticeship and other LR courses are over-represented among early leavers, and those with learning difficulties or disabilities on FE courses or Apprenticeships are more likely to leave early. The proportion of early leavers has remained similar to 2007.
The most common reason for leaving early varies by learning group. Other LR and PCDL learners tend to cite health reasons, while FE learners find it difficult to combine family commitments with the course and Apprentices mention changing jobs.
Apprentices are most likely to have sought support before leaving their course, with three in five having done so. Around two in five FE and other LR learners sought support, and one in five PCDL learners did.
Again, Apprentices have the highest proportion of those offered support (58 per cent), followed by other LR learners (46 per cent), FE learners (40 per cent) and PCDL learners (30 per cent).
Implications
Across all learner groups, learners’ satisfaction with their learning experience is very high. The proportion who are extremely satisfied has decreased significantly since 2007. However, this drop is consistent across all subgroups and learner groups and so does not appear to be limited to a certain group of learners. Additionally, learners’ assessment of their course on a range of issues remains positive, indicating no clear reason for this change.
One area that may be linked to relatively lower proportions of those extremely satisfied is expectations: around two in five adult learners say their course is meeting their needs and roughly one in five say they did not know what to expect. Finding ways to manage – and where possible exceed - expectations may help to increase the group of learners who are extremely satisfied.
worth considering further research to investigate these issues in more depth. However, it should be borne in mind that the majority of learners in these groups are still very positive about their courses.
As mentioned previously, adult early leavers are more negative about numerous aspects of their course compared to other adult learners. The proportion of early leavers has remained similar to last year as have the reasons adult learners give for leaving early. While providers may not be able to counteract reasons such as health problems and family and work commitments, they perhaps could do more on pre-entry information to address the numbers who say they chose the wrong course or cite teaching quality as a reason for leaving early. However, these recommendations should be seen in the context of high levels of satisfaction on pre-entry information and teaching quality.
Overall satisfaction
Satisfaction with the learning experience
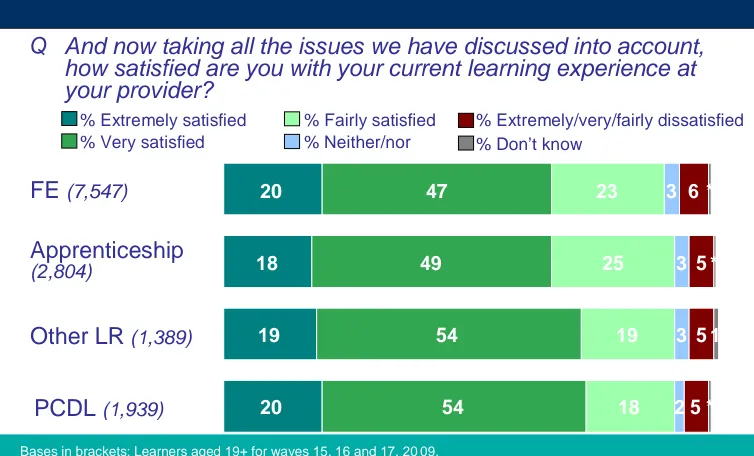
Around nine in ten adult learners across all learner groups are satisfied with their learning experience. Few significant differences emerge among learner groups, though PCDL learners report significantly higher satisfaction levels than FE learners (92 per cent compared to 90 per cent).
Satisfaction among adult Apprentices3is in line with satisfaction among Apprentices aged 16-18 (93 per cent among 16-18 year olds and 92 per cent among adults). However, adult FE learners are slightly less likely to be satisfied than young FE learners (90 per cent compared to 92 per cent of 16-18 year olds).
[image:13.595.104.481.444.672.2]FE learners on Level 3 courses have lower rates of satisfaction than FE learners on Level 2 courses or below (89 per cent for those on Level 3 compared to 91 per cent of FE learners at Level 2 or below). Other LR and PCDL learners who do not pay fees have higher levels of satisfaction with their learning experience than those who do (94 per cent and 95 per cent, respectively, compared to 90 per cent and 92 per cent of those who do not pay fees). This is also generally the case across all key satisfaction measures included within this report.
Figure 1: Satisfaction with the learning experience
3 20 18 19 20 47 49 54 54 23 25 19 18 3 3 2 6 5 5 5 1 3 * * * Q And now taking all the issues we have discussed into account,
how satisfied are you with your current learning experience at your provider?
% Extremely satisfied % Very satisfied
% Fairly satisfied % Neither/nor
% Extremely/very/fairly dissatisfied % Don’t know
FE(7,547)
Other LR(1,389)
PCDL(1,939)
Apprenticeship
(2,804)
Bases in brackets: Learners aged 19+ for waves 15, 16 and 17, 20 09.
Overall satisfaction levels are similar to those reported in the 2007 survey (Figure 2). Satisfaction among adult Apprentices has increased one percentage point, while satisfaction among PCDL learners has decreased one percentage point.
Figure 2: Trends in satisfaction with the learning experience
4
Q And now taking all the issues we have discussed into account, how satisfied are you with your current learning experience at your provider? 90% 92% 92% 92% 90% 91% 92% 93% 2009 2007 % satisfied
Bases in brackets: Learners aged 19+ for waves 15, 16 and 17, 2009; waves 12, 13 and 14, 2007. FE Other LR PCDL Apprenticeship (18,798) (7,547) (2,804) (3,164) (1,389) (1,570) (1,939) (3,821)
While overall satisfaction has remained broadly similar since 2007, the proportions reporting they are extremely satisfied have declined significantly among adult learners across all learner groups (Figure 3). However, these findings need to be seen in the context of the high levels of satisfaction overall, and in the stable trends in the proportion who are satisfied (i.e. combining those extremely, very and fairly satisfied).
Figure 3: Decline in extreme satisfaction
5
Q And now taking all the issues we have discussed into account, how satisfied are you with your current learning experience at your provider? 20% 18% 19% 20% 32% 27% 28% 36% 2009 2007 % extremely satisfied
Bases in brackets: Learners aged 19+ for waves 15, 16 and 17, 2009; waves 12, 13 and 14, 2007. FE Other LR PCDL Apprenticeship (18,798) (7,547) (2,804) (3,164) (1,389) (1,570) (1,939) (3,821)
[image:14.595.112.489.481.711.2]PCDL and other LR learners cite the quality of their tutors more frequently than Apprentices, while Apprentices mention helpfulness of their providers more than other learner groups.
Figure 4: Top reasons for satisfaction with the learning experience
Q
You said you were extremely/ very/ fairly satisfied ,
what is the main reason for this?
Base: Learners aged 19+ for waves 15, 16 and 17, 2009
Enjoy subjects/ areas covered/ interested in what I do
Tutors are good/ they make it easy/ interesting for us/ help us
A good course/ learnt a lot/ enjoyed it/ up to expectations
Gives me what I wanted/ needed/ the experience/ qualification
They were very helpful/ always ready to help/ get all the help I need
46%
35%
23%
22%
10%
35%
34%
31%
25%
6%
45%
38%
21%
23%
11%
43%
38%
16%
26%
14%
FE(6,811) Apprentice(2,571)
Other LR(1,278) PCDL(1,793)
Adult learners who are dissatisfied with their course are most likely to say this was because the course was badly run, the tutors had poor attitudes, they did not get the help they needed or the course was disappointing or not what they expected. Top mentions differentiated by learner group are shown in Table 2.
those aged 19-24). However, caution should be taken when comparing the two because of low base sizes4.
Table 2: Reasons for dissatisfaction (weighted)
FE Apprentices Other LR PCDL
(Unweighted Base: learners who are
dissatisfied with their course)
(453) %
(145) %
(72) %
(101) %
Badly organised/run 32 33 31 27
Poor attitudes of
tutors/not supportive 31 26 24 31
Didn’t get the help I
needed 27 31 20 20
It was
disappointing/not what I was expecting
24 22 34 29
Lack of
staff/assessors/ change of staff
15 16 13 6
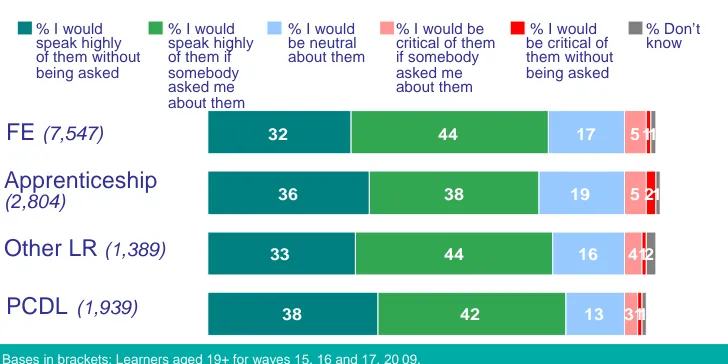
Advocating the provider
Most adult learners would speak highly of their provider, including around one in three who would do so without being asked (Figure 5). Only around one in twenty would be critical. PCDL learners tend to be more positive than FE learners or Apprentices. PCDL learners and Apprentices aged 25+ are most likely to speak highlywithout being asked (39 per cent and 45 per cent, respectively), while Apprentices aged 19-24 are most likely to be critics (seven per cent).
Other LR and PCDL learners who do not pay fees are significantly more positive about their learning providers: 82 per cent of other LR learners and 84 per cent of PCDL learners who do not pay fees would speak highly of their learning provider, compared to 75 per cent of other LR learners and 80 per cent of PCDL learners who pay fees. Similarly to satisfaction with learning experience, a lower proportion of FE learners on Level 3 courses advocate their provider than FE learners on Level 2 courses or below (73 per cent of Level 3 FE learners are advocates compared to 78 per cent of those on Level 2 or below).
As with satisfaction with learning experience, adult Apprentices are just as likely to be satisfied as young Apprentices.
Figure 5: Advocacy towards learning provider
2 32 36 33 38 44 38 44 42 17 19 16 13 5 4 3 1 2 1 1 1 1 2 1 5
Q Which of these statements best describes the way you would speak of your provider?
% I would speak highly of them without being asked
% I would be neutral about them % I would
speak highly of them if somebody asked me about them
% I would be critical of them if somebody asked me about them
% I would be critical of them without being asked
% Don’t know
FE(7,547)
Other LR(1,389)
PCDL (1,939)
Apprenticeship
(2,804)
Bases in brackets: Learners aged 19+ for waves 15, 16 and 17, 20 09.
The proportion of adult learners who would speak highly of their provider has remained broadly similar to the level observed in 2007, with an increase of one percentage point for FE learners and PCDL learners and no significant change for other LR learners. The proportion of Apprenticeship advocates has increased two percentage points (Figure 6).
Figure 6: Trends in advocacy (speaking highly of provider)
7
Q Which of these statements best describes the way you would speak of your provider?
76% 74% 78% 81% 75% 72% 78% 80% 2009 2007 % speak highly
What drives satisfaction with the learning experience?
Regression analysis was undertaken to determine the factors most commonly associated with high satisfaction and advocacy among all Apprentices, FE, and other LR learners (i.e. including young people as well as adult learners). The following factors were identified as being particularly closely linked to learner’s overall satisfaction with the learning experience and
advocacy:
The extent to which the learning programme is deemed by learners to be meeting their needs and expectations;
The quality of tutors or teachers; and
Issues related to provider responsiveness and learner involvement, such as listening to and acting on learner views and treating learners with respect.
It should be noted that, although the factors closely linked to overall satisfaction and advocacy are similar; issues related to learner responsiveness are even more strongly related to advocacy than overall satisfaction. Additionally, for Apprentices in particular, good levels of support provided on the course and helpfulness of staff in the first few weeks is also closely linked to satisfaction with the learning experience.
Performance on key drivers
This section looks at adult learners’ views on the key drivers that were identified in the Apprenticeship, FE, and/or other LR learners KDA: quality of teaching; needs and expectations; information, advice and support; and personalisation, learner involvement and provider responsiveness.
Tutors/teachers
Satisfied with quality of teaching 89% 90% 92% 93%
Understand learner(s) and how they like to learn (mean score)
7.9 8.0 8.2 8.2
Set clear goals to improve (mean score) 7.9 7.1 7.1 8.1
Manage the group well (mean score) 8.1 8.0 8.4 8.5
Interest and enjoyment (mean score) 8.2 8.0 7.6 8.7
Needs and expectations
Learning programme is meeting my needs (% agree)
90% 90% 91% 90%
Experience was better than expected 35% 32% 36% 35%
Information, advice and support
Satisfied overall because learning provider was helpful/always ready to help
23% 32% 20% 15%
Good support on the course 87% 91% 92% 90%
Good help in the first few weeks 90% 90% 96% 92%
Well informed of course content 88% 92% 87% 88%
No problems experienced during course 58% 65% 63% 61%
Future Career
Good advice on next steps 67% 73% 60% 53%
Relationship
Tutors relate to learner(s) as a person (mean)
8.2 8.0 8.6 8.7
Respect shown to learner 95% 94% 96% 96%
Provider good at listening to views 73% 85% 75% 65%
Provider good at acting on views 64% 79% 64% 54%
Satisfaction with teaching and the provider
Figure 7 shows adult learners’ attitudes to the quality of teaching or training on their course. Views are generally positive, with around nine in ten satisfied across learner groups. Among learner groups, PCDL learners not only have significantly higher levels of satisfaction than Apprentices and FE learners, but they also have higher levels of thoseextremelysatisfied.
[image:20.595.54.553.54.583.2]to adult FE learners (90 per cent compared to 88 per cent), a similar pattern to satisfaction with the overall learning experience.
Figure 7: Satisfaction with the quality of teaching/training
9
Q Overall, how satisfied are you with the quality of the teaching/ training at your provider?
28 23 31 35 40 44 46 44 20 23 13 13 4 4 2 7 6 6 5 4 * * * 1 % Extremely satisfied
% Very satisfied
% Fairly satisfied % Neither/nor
% Extremely/very/fairly dissatisfied % Don’t know
FE(7,547)
Other LR (1,389)
PCDL (1,939)
Apprenticeship
(2,804)
Bases in brackets: Learners aged 19+ for waves 15, 16 and 17, 2009.
These findings are very similar to those obtained in 2007 and in previous years, as Figure 8 shows. FE adult learners show a one percentage point decrease in satisfaction, while no other learner groups show significant differences.
Figure 8: Satisfaction with quality of teaching/training over time
10 88% 90% 91% 93% 89% 90% 91% 92% 2009 2007 % satisfied
Bases in brackets: Learners aged 19+ for waves 15, 16 and 17, 20 09; waves 12, 13 and 14, 2007.
Q Now moving on to teaching/training. Overall, how satisfied are y ou with the quality of the teaching/training at your provider?
[image:21.595.103.474.508.682.2]Specific aspects of quality of teaching
[image:22.595.110.470.197.419.2]Figure 9 summarises the findings for the first of three important elements of teaching: making the subject interesting and enjoyable. Asked to give a rating between 1 (very poor) and 10 (excellent), adult learners generally give high ratings.
Figure 9: Making the subject interesting and enjoyable
12
8.20
7.94
8.60
8.70 Mean*
Bases in brackets: Learners aged 19+ for waves 15, 16 and 17, 2009.
Q How would you rate the teachers or tutors/ assessor and trainers on…?
Making your subject interesting or enjoyable for you
FE(7,445)
Other LR(1,383)
PCDL(1,923)
Apprenticeship(2,793)
*Excluding ‘don’t know’ and ‘not applicable’
PCDL and other LR learners give the highest ratings among learner groups. Broadly, learners aged 25+ are more positive than those aged 19-24, as shown in Table 4.
Table 4: Making the subject interesting and enjoyable*
FE Apprentices Other LR PCDL
(Unweighted Base: All learners)
(7,445) (2,793) (1,383) (1,923)
Age
Aged 19-24 7.89 7.87 7.94 8.53**
Aged 25+ 8.30 8.13 8.68 8.71
*excluding ‘don’t know’ and ‘not applicable’
**Caution: low base size
Figure 10: Understanding the learner and how they like to learn
14
7.94
8.05
8.26
8.29 Mean*
Bases in brackets: Learners aged 19+ for waves 15, 16 and 17, 20 09.
Q How would you rate the teachers or tutors/ assessor and trainers on…?
Understanding you and how you like to learn
FE(7,407)
Other LR(1,378)
PCDL(1,886)
Apprenticeship(2,793)
*Excluding ‘don’t know’ and ‘not applicable’
Again other LR and PCDL learners give higher ratings and those aged 25+ are more positive than those aged 19-24. FE learners and Apprentices in Level 3 learning are less likely to rate their tutors highly, while female learners rate their tutors higher than male learners (see Table 5).
FE Apprentices Other LR PCDL
(Unweighted Base: All learners)
(7,445) (2,793) (1,383) (1,923)
Age
Aged 19-24 7.67 7.95 7.59 8.32**
Aged 25+ 8.02 8.32 8.34 8.29
Current level of study
Below Level 2 8.33 6.86** 8.42 8.19
Level 2 7.91 8.27 8.17 8.13
Level 3 or higher 7.71 7.88 7.90 8.11
Gender
Male 7.85 7.76 8.15 8.06
Female 8.00 8.38 8.29 8.36
*excluding ‘don’t know’ and ‘not applicable’
**Caution: low base size
[image:24.595.109.481.77.358.2]Another key factor in the quality of teaching is how well the tutor manages the group of learners. As shown in Figure 11, adult learners again rate their tutors highly on this aspect.
Figure 11: Managing the group of learners
13
8.09
8.00
8.46
8.54 Mean*
Bases for each in brackets: Learners aged 19+ for waves 15, 16 a nd 17, 2009.
Q How would you rate the teachers or tutors/ assessor and trainers on…?
Managing the group of learners
FE(7,314)
Other LR(1,371)
PCDL(1,891)
Apprenticeship(2,654)
in Table 6). Similarly to ratings of understanding how the learner likes to learn, women rate their tutors higher than men on managing the group of learners.
Table 6: Managing the group of learners*
FE Apprentices Other LR PCDL
(Unweighted Base: All learners)
(7,445) (2,793) (1,383) (1,923)
Age
Aged 19-24 7.80 7.91 7.77 8.48**
Aged 25+ 8.18 8.25 8.54 8.54
Gender
Male 7.99 7.79 8.31 8.37
Female 8.16 8.25 8.51 8.59
*excluding ‘don’t know’ and ‘not applicable’
**Caution: low base size
Needs and expectations
This section focuses on the expectations of adult learners before they started the course and whether the course is meeting their needs.
Meeting learners’ expectations
A new question was asked in the 2009 survey about meeting learners’ expectations. Overall, most adult learners feel that their expectations have at least been met, with around one in three saying their experience of the course has exceeded their expectations. Figure 12 shows adult learners’ views of how their courses matched their expectations.
Apprentices are most likely to say they did not know what to expect, followed by FE learners. PCDL learners, however, have significantly higher proportions saying their course is similar to what they expected. FE learners, especially those aged over 25, have higher numbers saying the course is worse than they expected (eight per cent). However, this is still a small minority of FE learners overall.
16
35
32
37
34
37
36
36
44
6
6
6 20
26
20
16 1 7
* * * Q Overall, would you say that your experience with your course/
training is better than you expected, similar to what you expected, worse than you expected, or did you not know what to expect?
% Worse than I expected % I didn’t know what to expect
% Don’t know % Better than I expected
% Similar to what I expected
FE (7,547)
Other LR (1,389)
PCDL (1,939)
Apprenticeship
(2,804)
Bases in brackets: Learners aged 19+ for waves 15, 16 and 17, 2009.
FE and other LR learners who paid fees are more likely to say the course was worse than they expected than those who did not pay fees (FE learners: eight per cent among those who did pay fees compared to seven per cent who did not; other LR learners: eight per cent among those who did pay fees and three per cent among those who did not).
In FE and Apprenticeships, the proportion saying their course is better than expected is significantly higher among those who hold a Skills Account or an Adult Learner Account5, as shown in Table 7.
5
% better than expected
(Unweighted Base: All learners)
FE
Skills Account(211) 43
Adult Learner Account(514) 42
None of these(6,339) 34
Apprenticeship
Skills Account(114) 40
Adult Learner Account(100) 46
None of these(2,391) 30
Meeting learners’ needs
Figure 13: Meeting learner needs
17
60
62
59
64
30
28
32
26 3
4
3
3 3
3
3 3
3
3
3 1
1
1 4
* Q Can you tell me how strongly you agree or disagree with the
following statement: my learning programme is meeting my needs.
% Strongly agree
% Neither/nor % Tend to
agree
% Tend to disagree
% Strongly disagree
FE (7,547)
Other LR (1,389)
PCDL (1,939)
Apprenticeship
(2,804)
Bases in brackets: Learners aged 19+ for waves 15, 16 and 17, 20 09.
% Don’t know
Information, advice and support
This section examines the information, advice and support given to adult learners. It looks at the support given during the course, the help received in the first few weeks, any problems experienced during the course and the provision of information before starting the course.
Support given while on course
Adult learners are very positive about the support given to them while on their course. Across learner groups, over half think the support they receive isverygood, and less than one in twenty say it is bad (Figure 14).
Figure 14: Learner support
19
Q Please tell me how good or bad: how good is the support you get on this course/learning programme/training programme?
55
54
55
59
31
37
36
29
5
5
6 3
3
2
2 1
1 1
1
3 8
1 2
* % Very good % Good % Not good but not
bad
% Bad % Very bad
FE(2,600)
Other LR(451)
PCDL(634)
Apprenticeship
(984)
Bases in brackets: Learners aged 19+ for wave 16, 2009.
% Don ’t know/ does not apply
Help given in the first few weeks
Adult learners are also positive about the help they received from staff in the first few weeks, with around nine in ten saying this was good (Figure 15). Only a small minority rate their help as bad. This is reflected in the finding that a top reason for course satisfaction is the helpfulness of tutors.
Figure 15: Support in early weeks
1
Bases in brackets: Learners aged 19+ all in wave 16, 2009
Q How good was the help staff gave you in the first few weeks at t he college/of your learning programme/of your training programme
55
55
59
64
34
34
36
27 7
3
4 2
2
1
2 1
1 2
1
2 6
1 1
*
FE (2,600)
Other LR (451)
PCDL (634)
Apprenticeship
(984)
% Very good % Good % Not good but not bad
% Bad % Very bad % Don ’t know/ does not apply
Problems experienced during the course
Overall, around two in five adult learners say that they experienced at least one of the problems read out to them (the most common of which are shown in Figure 16). The problems cover a range of issues related both to the course itself and to external pressures that cause learners difficulty.
Figure 16: Problems encountered during the course over time
21
Q Since you started the course have you had any problems with any of the following?
17% 15% 14% 13% 11% 9% 10% 12% 8% 7% 14% 9% 11% 9% 7% 15% 12% 9% 11% 6% Managing to keep up with the
standard of work required
Bases in brackets: Learners aged 19+ all wave 16, 2009.
Maintaining your personal motivation Managing to fit course commitments in with other commitments at home
Managing to fit course commitments in with other commitments at work
Dealing with money pressures
Top 5 mentions
FE(2,600) Apprenticeship(984) Other LR(451) PCDL(634)
[image:31.595.102.485.505.676.2]Apprentices aged 19-24 are the least likely to have experienced a problem (69 per cent say they have not experienced any problems), while FE learners on Level 3 courses are more likely to have experienced problems than FE learners on Level 2 courses or below (53 per cent compared to 59 per cent of Level 2 or below). Men across the Apprenticeship, FE and other LR learner groups are less likely to say they have experienced problems compared to women, as shown in Table 8.
Table 8: Proportion of learners who havenotencountered problems
FE Apprentices Other LR PCDL
(Unweighted Base: All
learners at wave 16) (2,600) % (984) % (451) % (634) % Gender
Male 61 70 72 59
Female 54 60 54 62
Information provision after induction
The vast majority of adult learners say they received good information about the content of the course and the subjects they would cover, including around two in three who say it was very good. Only around one in twenty describe the information as bad (Figure 17).
FE learners and Apprentices aged 19 to 24 and over are more likely to say they were well informed compared to their cohorts overall and PCDL learners (95 per cent, 95 per cent and 92 per cent, respectively). Though a very small minority (three per cent), PCDL learners have higher proportions saying they do not know, perhaps reflecting the types of courses they undertake.
Figure 17: Information at induction
22
% Not very well informed
64
65
65
68
29
30
30
24 5
2
3 1
1
1
2 4 % Not at all well informed % Very well
informed % Quite wellinformed
Q Please say whether you felt very well informed, quite well informed, not very well informed or not at all informed after induction?
Bases in brackets: Learners aged 19+ all wave 16, 2009.
The content of the course, what subjects you would cover.
FE(2,600)
Other LR (451)
PCDL (634)
provider responsiveness
This section will examine findings among adult learners on how good the respect they were shown by programme staff is, how well staff relate to them as a person, how well their provider listens to their views and how well they act on them.
Respect shown by staff
Figure 18 shows that the majority of adult learners rate staff as very good at showing them respect, with most of the remainder rating staff as good. Very few say the respect staff have shown is poor.
PCDL learners tend to be the most positive, with the highest proportion rating staff as very good. They and other LR learners are more likely than Apprentices and FE learners to say respect shown is good.
Other LR learners aged 19-24 have the highest level of those saying respect shown to them by staff is bad (five per cent), though this is a very small minority of learners.
Figure 18: Respect shown by staff
24
Q Please tell me how good or bad is the respect staff show to you/ respect training staff show to you.
Bases in brackets: Learners aged 19+ for waves 15, 16 and 17, 2009
66
60
69
74
28
34
27
22 4
2
2 1
1
11 1
1 3
** * 1
* *
FE(7,547)
Other LR(1,389)
PCDL(1,939)
Apprenticeship
(2,804)
% Very good % Good % Not good but not
bad % Bad % Very bad
% Don ’t know/ does not apply
Relating to learners as people
Figure 19: Relating to learners as people
25
8.42
8.47
8.70
8.74 Mean*
Bases in brackets: Learners aged 19+ for waves 15, 16 and 17, 20 09.
Q How would you rate the teachers or tutors/ assessor and trainers on…?
How well they relate to you as a person
FE(7,460)
Other LR(1,381)
PCDL(1,920)
Apprenticeship (2,797
*Excluding ‘don’t know’ and ‘not applicable’
PCDL and other LR learners rate their tutors significantly higher on relating to them as people than FE learners and Apprentices do. As shown in Table 9, adult learners aged 25 and over are more likely to be positive than those aged 19-24 (though the PCDL base size for 19-24 year olds is low and so comparisons should be treated with caution)6.
Table 9: Relating to learners as people*
FE Apprentices Other LR PCDL
(Unweighted Base: All learners)
(7,445) (2,793) (1,383) (1,923)
Age
Aged 19-24 8.12 8.34 7.94 8.79**
Aged 25+ 8.51 8.79 8.79 8.74
*excluding ‘don’t know’ and ‘not applicable’
**Caution: low base size
Listening and acting on learners’ views
6
Apprentices. A small minority say their provider is bad at listening to their views.
Figure 20: Listening to learners’ views
3
Q How good is the college/learning provider/company at listening t o the views of learners/apprentices and employees in training?
Bases in brackets: Learners aged 19+ for waves 15, 16 and 17, 2009
36
45
40
34
37
39
35
31
9
8
9 4
4
3
4 1
1
1
14
21 9
2 2 12
FE(7,547)
Other LR(1,389)
PCDL(1,939)
Apprenticeship
(2,804)
% Very good % Good % Not good but not bad
% Bad % Very bad % Don’t know/ does not apply
Apprentices are the most positive about providers listening to their views; they are more likely to say their provider is very good at listening. FE learners aged 19-24 are also particularly positive (80 per cent). PCDL learners are less likely to say providers are good at listening to the views of learners, but it should be noted they are significantly more likely to say this does not apply or they do not know (20 per cent).
[image:35.595.105.475.178.354.2]As seen in previous analysis, those who do not pay fees are more positive than those who do (Table 10).
Table 10: Proportion saying their provider is good at listening to learners’ views – differences by whether learners pay fees or not
FE Other LR PCDL
(Unweighted Base: All learners)
(7,547) (1,389) (1,939)
Pay fees 69% 69% 60%
Do not pay fees 77% 83% 82%
differences are not specific to adult learners – they are also observed among FE learners aged 16 to 18.
Table 11: Proportion of adult FE learners saying their provider is good at listening to learners’ views – differences by account holders and learner
support received
% good
(Unweighted Base: All learners)
FE
Skills Account(211) 81
Adult Learner Account(514) 82
None of these(6,339) 72
Received learner support 79
Do receive learner support 72
[image:36.595.124.468.121.406.2]A high proportion of adult learners are also positive about providers acting on learners’ views (Figure 21), though slightly less positive than they are about providers listening to their views. Much of this drop is due to increasing numbers saying they do not know or it does not apply. The exception is Apprentices, whose proportion is in line with the proportion saying their provider is good at listening to their views.
Figure 21: Acting on learners’ views
27
Bases in brackets: Learners aged 19+ for waves 15, 16 and 17, 20 09
QHow good is the college/learning provider/company at acting on those views?
27
37
30
25
36
42
33
29
12
9
10
5
5
3
4 1
1
19
3
23
31 11
2 2
FE(7,547)
Other LR(1,389)
PCDL(1,939)
Apprenticeship
(2,804)
% Very good % Good % Not good but not bad
PCDL learners, and FE learners aged 19-24 are particularly positive (72 per cent of this age group say their providers are good). As before, PCDL learners are most likely to say they do not know or this does not apply.
Again, those who do not pay fees are more positive (Table 12).
Table 12: Proportion saying their provider is good at acting on learners’ views – differences by whether learners pay fees or not
FE Other LR PCDL
(Unweighted Base: All learners)
(7,547) (1,389) (1,939)
Pay fees 58% 57% 48%
Do not pay fees 67% 72% 73%
Table 13: Proportion of adult learners saying their provider is good at acting on learners’ views – differences by account holders and learner support
received
% good
(Unweighted Base: All learners)
FE
Skills Account(211) 79
Adult Learner Account(514) 78
None of these(6,339) 61
Receive learner support (1,288)
71
Does not receive learner support(6,076)
62
Other LR
Skills Account(29) 73
Adult Learner Account(107) 75
None of these(1,167) 62
Receive learner support(126) 79 Do not receive learner support
(1,228)
62
Attitudes to learning and benefits of
learning
This section looks at learners’ attitudes to learning and education, as well as the perceived usefulness of their course to their future career. It also examines the likelihood of undertaking further learning.
Feelings about education on leaving school
A majority of adult learners had generally positive feelings about education when they left school, while around one in four had negative feelings; details are shown in Figure 22.
Figure 22: Feelings about education on leaving school
29
55
52
52
63
22
19
25
19 29
20
15 3
1
4
3 21 % Had generally positive feelings
about education
Q Thinking back to when you left school would you say that you . . .?
Bases in brackets: Learners aged 19+ all wave 17, 2009
% Had generally negative feelings about education
% Were not bothered either way
about education, were indifferent % Don’t know
FE (2,632)
Other LR (476)
PCDL (640)
Apprenticeship
(958)
Feelings about learning currently
The majority of adult learners agree that they feel more positive about learning since beginning their course (Figure 23). These proportions compare favourably to the proportion that were positive about learning when leaving school.
Apprentices are particularly likely to agree with this statement, while PCDL learners are more likely to disagree (although it should be noted that these learners are already very positive about education when leaving school).
Few differences among age groups emerge, but FE learners 19-24 are more likely to agree than FE learners aged 25+.
FE and other LR learners who do not contribute to their fees have higher levels saying they are positive about learning (FE learners: 80 per cent of those who paid no fees compared to 74 per cent of those did agreed; other LR learners: 86 per cent compared to 76 per cent).
Related to this, FE learners who hold a Skills Account or and Adult Learner Account (of whom 55 and 57 per cent do not contribute toward their course fee) are also more likely to agree with the statement, compared with those who do not hold such accounts (89 per cent compared with 76 per cent).
30
77
85
80
71
20
14
16
23 3
1
3
5 % Disagree
% Agree
Q Can you tell me whether you agree or disagree with... I feel more positive about learning than I did when I started
% Don’t know
Bases in brackets: Learners aged 19+ all wave 17, 2009 FE(2,632)
Other LR(476)
PCDL(640)
Apprenticeship
(958)
Usefulness of course for future career
A high proportion of learners report that their course will help them move forward in their career and make it easier to find the type of job they want (Figure 24).
Apprentices overwhelmingly agree with this statement (92 per cent), followed by FE learners. Among both these sets of learners, those aged 19-24 are more positive than those aged 25 and over (95 per cent and 90 per cent, respectively compared to 84 per cent and 69 per cent, respectively) perhaps reflecting the different stages their careers are likely to be at.
The exception is PCDL learners, who, possibly because of the courses they take, have fewer numbers agreeing.
[image:40.595.132.476.128.299.2]In line with earlier findings, agreement with this statement is higher among FE learners who receive learner support (90 per cent) compared with those who do not (71 per cent), and among those who hold a Skills Account or an Adult Learner Account, compared with those who do not (86 per cent, 81 per cent and 73 per cent respectively).
31
Bases in brackets: Learners aged 19+ all wave 17, 2009 Other LR(476)
PCDL(640)
63
30
30
54
7
16
Likelihood to undertake future learning
[image:41.595.114.471.317.490.2]Roughly three in five learners say they are verylikely to undertake further learning in the future (e.g. in the next three years), aside from Apprentices, where just less than half say they are very likely to do so (Figure 25).
Figure 25: Likelihood of undertaking further learning
32 60
48 62
64
23 29
25 23
7
6 6
7 9
4 5
3 3 4 2 11
% Fairly
unlikely % Veryunlikely % Don’tknow % Very
likely % Fairlylikely
Q How likely will you be to undertake further learning in the next 3 years?
Bases in brackets: Learners aged 19+ for waves 15, 16 and 17, 2 009 FE(7,547)
Other LR(1,389)
PCDL(1,939)
Apprenticeship
(2,804)
Other LR and PCDL learners are not only significantly more likely to undertake further learning, but very likely. Apprentices are least positive about undertaking further learning, with one in eleven (nine per cent) saying this isveryunlikely.
Table 14: Likelihood of undertaking further learning
FE Apprentices Other LR PCDL
(Unweighted Base: All
learners at wave 16)
(7,547) %
(2,804) %
(1,389) %
(1,939) %
Age
19-24 78 76 69 94*
25+ 84 78 89 87
Gender
Male 81 73 79 87
Female 84 80 89 87
*Caution: low base size
Adult learners’ likelihood of undertaking further learning has remained broadly similar to 2007 findings (Figure 26). The proportion of FE and other LR learners agreeing it is likely has decreased by one percentage point, while the proportion of PCDL learners agreeing has decreased by two percentage points.
Figure 26: Likelihood of undertaking further learning compared to 2007
33
83%
76%
87%
87% 84%
76%
88%
89%
2009 2007 % likely
Bases in brackets: Learners aged 19+ for waves 15, 16 and 17, 20 09; waves 12, 13 and 14, 2007.
Q How likely will you be to undertake further learning in the next 3 years?
FE
Other LR
PCDL
Apprenticeship
(18,798) (7,547)
(2,804)
(3,164)
(1,389)
(1,570)
(1,939)
[image:42.595.110.489.454.644.2]In this section we examine early leavers in more detail, including their demographic profile, reasons for leaving early, and whether they sought or received support.
Profile of early leavers
In total, between four and seven per cent of adult learners had left their course early at the time of their interview. Most respondents were still on the course at the time of the interview, so the survey does not aim to collect data on completion rates; these are monitored by the LSC’s own analysis of the individualised learner record (ILR) database.
The proportion of early leavers is similar to the 2007 survey, as shown in Figure 27.
Figure 27: Proportion who left course early
35
Q I would like to start by finding out where you are at with your course/training. Are you still doing your course/training?
Bases in brackets: Learners aged 19+ for waves 15, 16 and 17, 2 009
% Successfully completed course
% Still learning % Left early % Failed/not successful
63
65
66
53
7
4
7
7
29
26
39 29
* * *
1
FE(7,547)
Other LR(1,389)
PCDL(1,939)
Apprenticeship
(2,804)
% Left early 2007
8
4
7
8
Table 15: Sample demographic profile of early leavers compared to all learners in learner group (weighted)
FE Apprentices Other LR PCDL
(Unweighted Base: Early leavers and all respondents)
(493) (7,547) (104) (2,804) (97) (1,389) (126) (1,939)
% % % %
Gender
Male 35 40 44 52 23 27 25 23
Female 65 60 56 48 77 73 75 77
Age
19-24 23 23 65 72 14 11 - 2
25+ 77 77 35 28 86 89 100 98
Ethnicity
White 81 83 93 92 81 81 91 93
BME 18 16 7 8 15 18 7 5
Refused * * - - - * 2 1
Not known - 1 - * 5 1 -
-Disability 13 9 10 6 12 12 13 11
Learning difficulty
10 7 7 5 12 9 6 5
Reasons for leaving early
The top reasons given for leaving courses early are shown in Figure 28. Adult learners who left their course early can be divided into two groups. The first group left for reasons related to the course itself – either because they felt the course was not as expected or was not right for them, or because they had problems with the tutor or teaching. The second group left early because of external factors – family, work, health or other personal issues.
course as good, suggesting that better information will not completely solve this issue.
Figure 28: Reasons for leaving the course early
36 15% 13% 13% 12% 11% 7% 12% 2% 11% 9% 16% 16% 22% 10% 10% 13% 15% 23% 12% 19%
Difficult to combine with work commitments
Top 5 mentions
Q You said that you have left the course early. What do you consider were the main reasons for leaving early?
Health reasons
Wrong course for me
Difficult to combine with family or other commitments
Tutor poor/ problems with quality of teaching
Bases in brackets: Learners aged 19+ who left early, 2009
FE (493) Apprenticeship (104) Other LR (97) PCDL (126)
Support for learners thinking of leaving early
As can be seen in Figure 29, the proportion of early leavers who sought support from their teachers, trainers, employers or assessors varies by learner group. Apprentices have the highest proportions seeking support, while FE and other LR learners are more likely than PCDL learners to have turned for help.
Figure 29: Support sought when thinking of leaving early
37 39% 59% 43% 22% 59% 41% 57% 76% 2% 0% 1% 2%
Q And when you were thinking about leaving the course...Did you seek support from your teachers or tutors (Apprentices:employer, assessor, trainers) to help you stay on the course, postpone the course, or change to another course?
Bases in brackets: FE, other LR, PCDL and Apprenticeship learners aged 19+ who left early for waves 15, 16 and 17, 2009
Yes No Don’t know
Other LR(97)
FE(493)
PCDL(126)
Apprenticeship*
(104)
*Different question wording
[image:45.595.106.479.486.705.2]Figure 30: Support offered when thinking of leaving early
38
40%
58%
46%
30%
57%
42%
52%
65%
2%
0%
2%
5%
Q And when you were thinking about leaving the course...Did your teachers or tutors (Apprentices: employer, assessor, trainers) offer support to help you stay on the course, postpone the course, or change to another course?
Bases in brackets: FE, other LR, PCDL and Apprenticeship learners aged 19+ who left early for waves 15, 16 and 17, 2009
Yes No Don’t know
Other LR(97)
FE(493)
PCDL (126)
Apprenticeship*
(104)
*Different question wording
mail:psi@nationalarchives.gsi.gov.uk.
This publication is also available on our website athttp://www.bis.gov.uk
Any enquiries regarding this publication should be sent to:
Department for Business, Innovation and Skills 1 Victoria Street
London SW1H 0ET Tel: 020 7215 5000
If you require this publication in an alternative format, emailenquiries@bis.gsi.gov.uk, or call 020 7215 5000.