Evidence Report 74
November 2012
UK Commission’s
UK Commission’s Employer Skills
Survey 2011: Wales Results
Ben Davies, Katie Gore, Briony Gunstone, Jan Shury, David Vivian,
Mark Winterbotham
IFF Research
Dr Susannah Constable and Ken Manson
Project Managers
UK Commission for Employment and Skills
Foreword
I am keenly aware of how crucial the skills of staff are to the success of business. Our
company isn’t just a brewer, it’s also the home of hundreds of hospitality retailers who
operate across Wales and the west of England. Our pubs, bars and coffee shops rely on the
skill and tenacity of managers and landlords who know their staff and know their local
markets.
This kind of detailed knowledge and understanding underlies the work of the UK
Commission for Employment and Skills to study and report on the labour market in Wales
and across the UK. To tackle an issue successfully, you first have to understand it.
By understanding more about the labour market, business and government alike can
understand where there are problems but also opportunities. Along with the UK, the Welsh
economy is growing only very slowly. Much pain remains: for people out of work; for
businesses struggling to survive. In my view, this makes it more important, not less, to build
on the understanding we have of our teams and to work to improve them. At Brains – as in
all businesses – the people we work with are the most important part of the company.
Putting their skills to the best use is not a separate agenda to growing Welsh business. It is
at the centre of that effort.
The UK Commission’s Employer Skills Survey is a vital source of evidence and analysis of
business vacancies, skills shortages, and training regimes in Wales and across the UK. This
means that what you are reading is not just a report; it is a resource you can use to
understand and to act upon.
If you are in business, I urge you to look at what it tells you about your industry, and think
about the skills of your employees and how you approach the challenge of staff
development.
And if you are a teacher, trainer, or you work for a college, I urge you to use its results to
target your offer to meet the needs that businesses across Wales have told the UK
time, we are able to compare directly between Wales and other parts of the UK. This is due
to the cooperation of the Welsh Government with its partners in Northern Ireland, Scotland
and England. These comparisons show that we have much to be proud of, and in many
areas we are ahead of our partner nations. But there is no room for complacency, and there
are also measures that show where Wales is falling behind. Here we need to take
responsibility together and use this insight to plan how to respond.
I would like to thank the 6,000 businesses across Wales who gave their valuable time to
answer the survey, helping to inform the UK Commission’s most comprehensive report yet
into the challenges and opportunities available to Welsh business.
Scott Waddington
Acknowledgements
Many individuals and organisations have been involved in the design and execution of the
UK Commission’s Employer Skills Survey 2011 and the Wales Results. Particular thanks are
given to the 6,000 businesses who gave their time to speak to us. As the lead contractor, we
have been supported by the research agencies who conducted much of the fieldwork: BMG
Research and Ipsos MORI.
The project was sponsored by the four UK governments who came together to ensure the
delivery of this first UK employer skills survey was possible. A steering group was
established to guide the direction of the project.
Members attending this group were: Mark Langdon, Department for Business, Innovation
and Skills (BIS); Dominic Rice, BIS; Kathy Murphy, BIS; Euan Dick, Scottish Government;
Sarah Munro, Scottish Government; Joanne Corke, Welsh Government; Graeme Belshaw;
Department for Employment and Learning Northern Ireland (DELNI); Linda Bradley, DELNI;
Tim Devine, DELNI; Mauricio Armellini, Department for Work and Pensions (DWP); Jacqui
Hansbro, DWP; Alasdair Yeo, DWP; Anthony Clarke, Department for Education (DFE);
Muriel Bankhead, Alliance of Sector Skills Councils; Sally Walters, Alliance of Sector Skills
Councils; Helen Lindsay, Alliance of Sector Skills Councils and Mark Spilsbury of the UK
Commission for Employment and Skills.
The report was completed with the assistance of Rachel Stephens and James Carey at the
Welsh Government.
Thanks are due to staff at the UK Commission who supported the preparation of this report,
including Allan Noy, Carol Stanfield, and Dr Vicki Belt. Ken Manson worked on the survey
throughout and managed the Wales Results from September 2012.
Special thanks are due to the UK Commission project manager throughout the course of the
survey, Dr Susannah Constable.
Jan Shury
Table of Contents
Foreword ... i
Acknowledgements ... iii
Glossary ... 1
Executive Summary ... 3
Work-readiness of education leavers ... 3
Employers, recruitment and skill shortages ... 3
Internal Skills Mismatch ... 4
Employer Investment in Training and Workforce Development ... 6
High Performance Working ... 7
1
Introduction ... 8
1.1 Methodological overview ... 8
1.2 Sampling ... 9
1.3 Questionnaire ... 9
1.4 Fieldwork ... 9
1.5 Data weighting ... 10
1.6 Reporting conventions ... 10
2
Nature of Welsh establishments ... 12
2.1 Size ... 12
2.2 Sector ... 13
2.3 Region ... 15
2.4 The structure of establishments ... 17
2.5 Business strategies ... 19
2.6 Product Market Strategy and workforce skill level ... 21
2.7 Structure of this report ... 24
3
Work-readiness of education leavers ... 25
Chapter Summary ... 25
3.1 Introduction ... 25
3.2 Incidence of recruitment of school, college and HE leavers ... 25
3.3 Perceived work-readiness of education leavers ... 28
3.4 Skills and attributes lacking among education leavers ... 29
4
Employers, recruitment and skill shortages ... 33
Chapter Summary ... 33
4.1 Introduction ... 33
4.2 What is the level of demand for new staff? ... 34
4.3 The ability of the market to meet employer demand for new staff ... 37
4.4 Causes of hard-to-fill vacancies ... 40
4.5 Impact of hard-to-fill vacancies ... 44
4.6 Measures taken to address hard-to-fill vacancies ... 46
4.7 Skill-shortage vacancies ... 47
4.8 The incidence, volume, density and distribution of skill-shortage vacancies ... 48
4.9 Skills lacking from applicants ... 51
4.10 Conclusion ... 52
5
Internal Skills Mismatch ... 55
Chapter Summary ... 55
5.1 Introduction ... 55
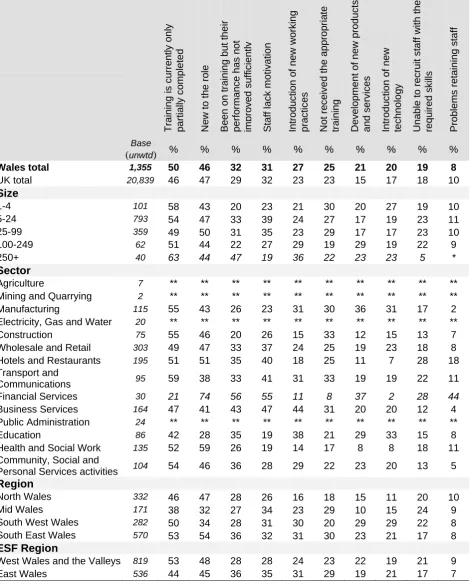
5.2 The incidence, volume, density and distribution of skills gaps ... 56
5.3 Causes of skills gaps ... 59
5.4 Impact of skills gaps ... 62
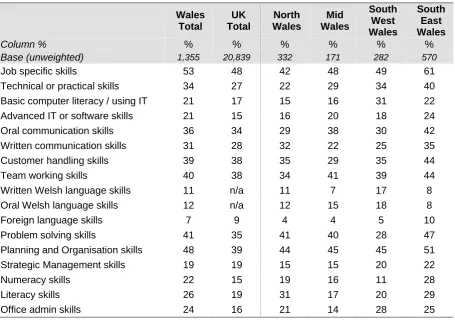
5.5 Skills that need improving ... 65
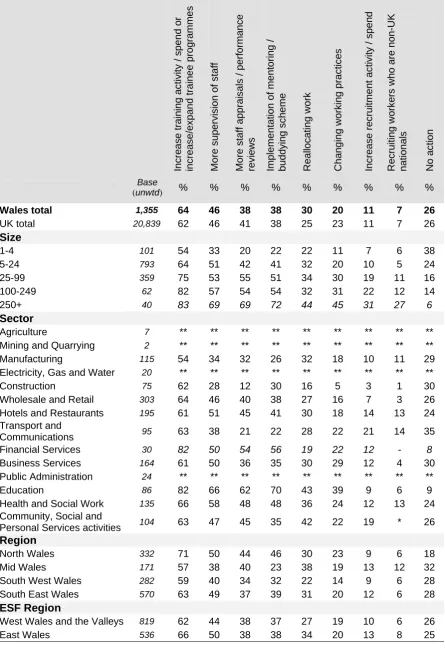
5.6 Actions taken to overcome skills gaps ... 66
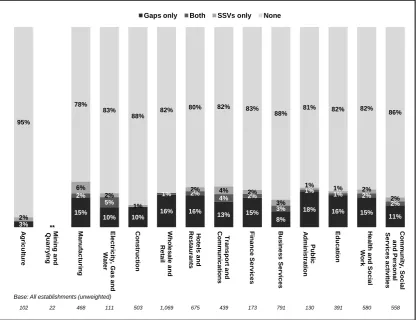
5.7 Combined skill deficiencies ... 68
5.8 Difficulties retaining staff ... 71
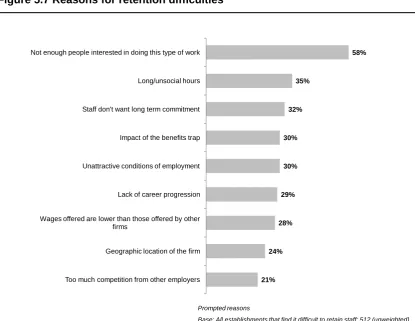
5.9 Reasons for retention difficulties ... 75
5.10 The impact of retention difficulties ... 76
5.11 Measures taken to overcome retention difficulties ... 76
5.12 Under-utilisation of skills ... 78
5.13 Conclusion ... 80
6
Workforce Development ... 82
Chapter summary ... 82
6.1 Introduction ... 82
6.2 The extent of training and workforce development activity ... 83
6.3 Incidence of training and workforce development activity ... 87
6.8 Training to qualifications ... 95
6.9 Employer expenditure on training ... 98
6.10 Training and Investors in People status ... 102
6.11 Assessing the impact of training ... 103
6.12 Reasons for not providing training ... 104
6.13 Conclusion ... 106
7
How employers use staff skills ... 108
7.1 Introduction ... 108
7.2 Human resource management practices ... 109
7.3 Use of reward and commitment practices ... 111
7.4 Employee engagement practices ... 112
7.5 Workplace culture practices ... 114
7.6 Conclusions ... 116
8
Conclusions ... 117
8.1 Skills deficiencies in Wales ... 117
8.2 Retention ... 119
8.3 Investment in Training ... 119
8.4 The work-readiness of education leavers ... 120
8.5 Facing the challenge ... 121
Appendix A: Comparisons with Future Skills Wales 2005 ... 122
Employers’ interaction with the labour market ... 123
Internal skills mismatch ... 127
Workforce Development ... 128
Appendix B: A Note on Proficiency and Skills Gaps ... 129
Appendix C: Technical Appendix ... 130
Employer Skills Survey: Wave 1 ... 130
Employer Skills Survey: Investment in Training follow-up ... 132
Appendix D: Industry Coding ... 133
Appendix E: Occupational Coding ... 137
Appendix F: Sampling Error and Statistical Confidence ... 139
Appendix G: Weighted base sizes ... 141
Table of Graphs and Charts
Table 1.1 Survey response rates ... 10
Figure 2.1 Size distribution of establishments and employees ... 12
Figure 2.2 Sectoral distribution of establishments and employment ... 13
Figure 2.3 Establishments and employment by Private, Public and Third sector ... 14
Figure 2.4 Establishments and employment by Region ... 15
Figure 2.5 Size distribution within Region ... 16
Table 2.1 Sector distribution within Region ... 17
Figure 2.6 Single or Multi site organisation ... 18
Figure 2.7 Product Market Strategy positions ... 19
Figure 2.8 Product Market Strategy positions ... 20
Table 2.2 Product Market Strategy by Size ... 21
Table 2.3 Product Market Strategy by ESF Region ... 21
Figure 2.9 Proportion of staff qualified to Level 3 and Level 4 ... 22
Figure 2.10 Skills level by Product Market Strategy ... 23
Table 3.1 Incidence of recruitment from education in last 2-3 years ... 27
Figure 3.1 Perceived work-readiness of education leavers in the last 2-3 years ... 28
Figure 3.2 Perceived work-readiness of education leavers in the last 2-3 years by region . 29 Table 4.1 Incidence, volume and density of vacancies ... 35
Table 4.2 Incidence and density of vacancies by occupation ... 36
Table 4.3 Incidence, volume and density of hard-to-fill vacancies: 2011 ... 38
Table 4.4 Incidence, volume and density of hard-to-fill vacancies: by occupation ... 39
Figure 4.1 Causes of hard-to-fill vacancies ... 41
Table 4.5 Causes of hard-to-fill vacancies (unprompted) ... 43
Figure 4.2 Impact of hard-to-fill vacancies ... 44
Table 4.6 Impacts of hard-to-fill vacancies (unprompted) ... 45
Figure 4.3 Measures taken to address hard-to-fill vacancies ... 47
Figure 4.4 Skill-shortage vacancies route map ... 48
Table 4.7 Incidence, volume and density skill-shortage vacancies ... 50
Table 4.8 Incidence, volume and density of skill-shortage vacancies: by occupation ... 51
Table 5.1 Incidence, volume and density of skills gaps ... 57
Table 5.2 Incidence, volume and density of skills gaps: by occupation ... 58
Figure 5.1 Causes of skills gaps ... 60
Table 5.3 Causes of skills gaps ... 61
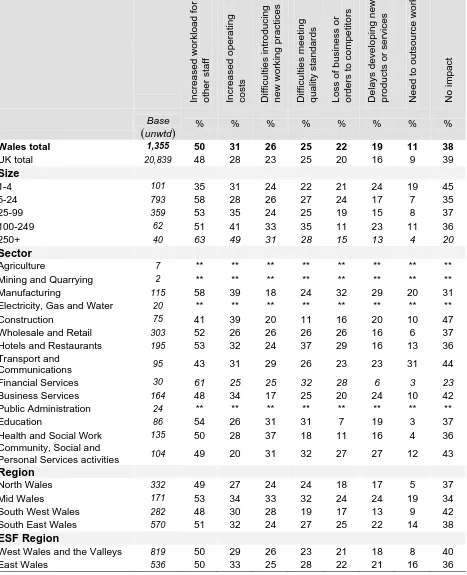
Figure 5.2 Impact of skills gaps ... 62
Table 5.4 Impact of skills gaps ... 64
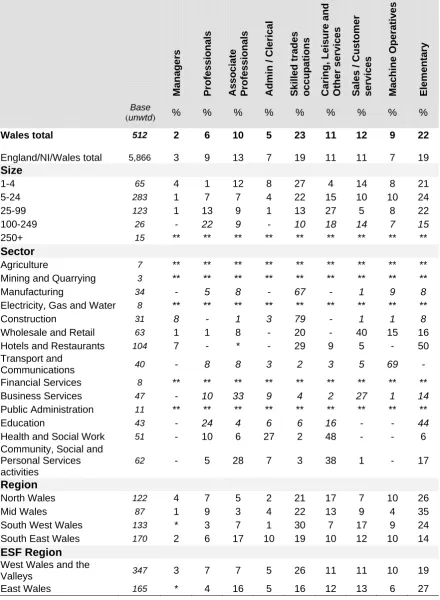
Table 5.5 Skills that need improving in occupations with skills gaps ... 65
Table 5.7 Combined skill deficiencies (internal and external) ... 68
Figure 5.3 Establishments with skill deficiencies: by size ... 69
Figure 5.4 Establishments with skill deficiencies: by sector ... 70
Figure 5.5 Establishments with skill deficiencies: by region ... 70
Figure 5.8 Impact of retention difficulties ... 76
Figure 5.9 Measures taken to overcome retention difficulties ... 77
Table 5.9 Proportion of staff that are under-used ... 79
Figure 6.1 Incidence of training activity by size ... 84
Figure 6.2 Incidence of training activity by sector ... 85
Figure 6.3 Incidence of training by region ... 86
Table 6.1 Incidence and volume of training: by ESF region ... 86
Figure 6.4 Incidence of training and further development by establishment size ... 88
Figure 6.5 Incidence of training and further development by establishment sector ... 89
Figure 6.6 Incidence of training and further development by establishment region ... 90
Table 6.2 Volume of training ... 92
Figure 6.7 Distribution of training by occupation ... 93
Table 6.3 Training plans and training budgets: by size ... 94
Figure 6.8 Types of training funded or arranged by employers ... 95
Table 6.5 Training expenditure (in absolute terms) over the previous 12 months and the components of training expenditure ... 98
Table 6.6 Training investment by region ... 100
Table 6.7 Training expenditure per capita and per trainee ... 100
Table 6.8 Training expenditure per capita and per trainee by region ... 102
Table 6.9 Investors in People Standard ... 103
Figure 6.9 Proportion of establishments that formally assess the impact of training ... 104
Figure 6.10 Reasons for not providing training ... 105
Figure 7.2 Use of performance related pay and incentive schemes ... 112
Figure 7.3 Involvement of employees in decision making ... 113
Figure 7.4 Communication and sharing of information in the workplace ... 114
Figure 7.5 Amounts of variety, flexibility and discretion employers provide to workers 115 Table A.1 Incidence of vacancies in Wales: time series ... 123
Table A.2 Incidence of vacancies in Wales: time series by size ... 123
Table A.3 Incidence of vacancies in Wales: time series by sector ... 124
Table A.4 Incidence of vacancies in Wales: time series by region ... 126
Table A.5 Incidence of skills gaps in Wales: time series ... 127
Glossary
This glossary gives a short guide to the key terms used in this report:
Employment The overall number of people employed.
Establishment (also referred to as workplace, business, employer, site)
A single location of an organisation with people working at it.
ESF European Structural Fund. For the purposes of
European Union ESF programmes, Wales is divided into two regions, East Wales and West Wales and the
Valleys.
Hard-to-fill vacancies Vacancies which are proving difficult to fill, as defined by the establishment (from question: “Are any of these vacancies proving hard to fill?”).
Hard-to-fill vacancy density
The number of hard-to-fill vacancies as a proportion of all vacancies.
Occupations For definitions of the occupational groups used in this report please refer to Appendix E.
Sector For definitions of the different sector groupings used in this report please refer to Appendix D.
Skill-shortage vacancies (SSVs)
Vacancies which are proving difficult to fill due to the establishment not being able to find applicants with the appropriate skills, qualifications or experience.
Skill-shortage vacancy density
Skills gaps A “skills gap” is where an employee is not fully proficient, i.e. is not able to do their job to the required level. See Appendix B.
Skills gap density The number of staff reported as being not fully proficient as a proportion of all employment.
Vacancy density The number of vacancies as a proportion of all employment.
Executive Summary
The UK Commission’s Employer Skills Survey 2011 is the key UK data source on
employer demand for and investment in skills. It is the first UK-wide employer skills
survey, and is one of the largest employer skills surveys undertaken in the world,
involving over 87,500 interviews with employers. In Wales 6,012 interviews were
completed across all sectors and covering all sizes of employer. The survey covered
topics such as skill related recruitment difficulties, skills gaps, training investment and the
work-readiness of education leavers. Headline findings on these and other topics are
provided below.
Work-readiness of education leavers
In Wales around a quarter of establishments (24 per cent) had recruited at least one
person straight from education in the two to three years prior to the survey, in line with the
proportions seen across the UK. As in the UK as a whole, employers mostly found these
education leavers to be well prepared for work; the proportion saying this increased with
the recruit’s age and / or educational level (from 56 per cent recruiting 16 year-old school
leavers up to 80 per cent of those recruiting from Higher Education). Interestingly 17-18
year olds leaving FE College were reported to be better prepared for work than their
17-18 year-old peers leaving school; suggested reasons for this include college students
being more likely to be studying vocational courses which are more relevant to working
life, and college students also being more likely to combine work and learning and
therefore to have amassed more work-relevant experience.
Where education leavers were found to be poorly prepared for work this was most
commonly put down to a lack of experience of the working world, life experience or
maturity.
Employers, recruitment and skill shortages
At the time of the survey (March to July 2011) 11 per cent of establishments in Wales had
a vacancy, totalling 25,500 vacancies across Wales. As a proportion of the workforce in
each occupation demand was highest for Associate Professionals, with 5.7 vacancies for
every hundred current employees in this area. Establishments in the Education, Health
and Social Work and Manufacturing sectors were most likely to have a current vacancy at
the time of the survey, but the highest vacancy density was seen in Electricity, Gas and
The labour market is largely able to meet the recruitment requirements of most
establishments; however four per cent of establishments reported having a vacancy they
were finding it difficult to fill (a “hard-to-fill vacancy”). Overall 8,500 hard-to-fill vacancies
were reported, equating to a third of all vacancies. Of these, 5,700 are proving hard to fill
due to a difficulty in finding applicants with the skills, qualifications and experience
required for the role; this equates to over a fifth of all vacancies and is an issue reported
by three per cent of establishments. It is amongst Associate Professional and Machine
Operative roles where employers experience the greatest difficulties in meeting their
demand for skills from the available labour market. Skill-shortage vacancies were most
common among establishments in the Manufacturing and Electricity, Gas and Water
sectors, and most prevalent (i.e. made up the highest proportion of all vacancies) in the
Business Services sector.
Whilst the proportion of establishments experiencing hard-to-fill vacancies and
skill-shortage vacancies was similar to that in the UK as a whole, the total proportion of
vacancies that were classed as hard-to-fill vacancies and the total classed as
skill-shortage vacancies was higher in Wales than the UK. This suggests the problem is more
acute in Wales. These differences were almost entirely driven by establishments in Mid
Wales, where the proportion of vacancies proving problematic was far higher than in the
other regions of Wales.
Whilst these recruitment difficulties may not be common in terms of the proportion of
establishments experiencing them, where they do exist their impact can be significant.
Almost all establishments with hard-to-fill vacancies said they were having an impact on
the establishment, most commonly on the workload of existing staff which will risk
knock-on effects knock-on morale and retentiknock-on, but also a more direct impact knock-on performance such as
meeting customer service objectives, delaying the development of new products and
services, and even causing the establishment to lose business to competitors.
Internal Skills Mismatch
Internal skills mismatch considers the proficiency of existing staff: whether they have the
skills they need to do their job and whether their skills are being fully utilised in their
current role. It also looks at retention of employees, as retention issues can cause skills
The majority of employers report their workforce are all proficient in their current job role,
however 13 per cent report having one or more employee who is not fully proficient at
their job, i.e. they have a “skills gap”. Overall 53,700 employees were reported as having
skills gaps, equating to five per cent of the workforce in Wales. This is similar to the levels
of proficiency seen in the UK as a whole. Skills gaps were most common amongst staff
working in Machine Operative roles. Establishments in the Hotels and Restaurants sector
were among those most likely to have a skills gap, and also had the highest proportion of
their staff experiencing gaps; this sector was also most likely to suffer retention difficulties
so their skills gaps were likely to be caused by new staff. Establishments from the Public
Administration sector on the other hand were also among the most likely to have a skills
gap, but had among the lowest proportions of the workforce with a gap suggesting that
the high incidence here is driven by better systems to identify skills lacking.
Where gaps exist their impact can be significant, and as with hard-to-fill vacancies the
impact is most commonly felt by an increased workload for other employees of the
establishment. However far fewer employers with gaps than employers with hard-to-fill
vacancies reported that they had an impact on the establishment; indeed around
two-in-five employers with skills gaps reported they did not have any tangible impact on the
performance of the establishment. This may be related to skills gaps being caused in
some instances by new staff having been taken on, in which circumstance the skills gaps
will often be both anticipated and temporary (in support of this, the most common causes
of skills gaps were training only being partially completed, and the employee in question
being new to the role).
The finding that employees being new to the role is often a cause of skills gaps is of
concern to establishments who have difficulties retaining staff, as these establishments
will regularly be taking on new employees and potentially experiencing skills gaps as the
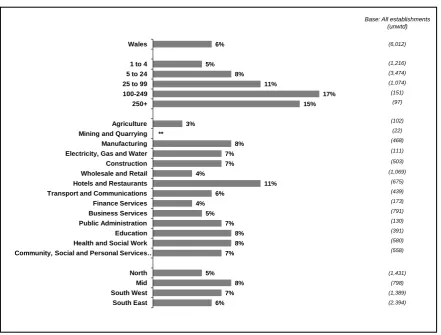
new staff become familiar with their roles. Overall across Wales six per cent of
establishments reported they had difficulties retaining staff, most commonly among
Skilled Trades occupations and Elementary staff. Most commonly these difficulties were
attributed to a lack of interest in the work in question, a factor in three-fifths of all
establishments with retention difficulties. As with hard-to-fill vacancies and skills gaps, the
impact is largely felt by other employees of the establishment.
Almost half (45 per cent) of establishments in Wales reported having at least one
employee with both qualifications and skills that are more advanced than required for
their current job role, amounting to 14 per cent of the total workforce in Wales. These
findings resulted from an experimental question asked for the first time in this survey.
This enables us to get an employer perspective on a measure that has traditionally been
Employer Investment in Training and Workforce Development
Three-fifths (59 per cent) of establishments had provided on- or off-the-job training for
some or all of their staff in the 12 months preceding the survey; this is the same level as
seen across the UK as a whole. During this period employers had arranged or funded
training for approximately 650,000 staff, equivalent to 56 per cent of the total workforce in
Wales at the time of the survey, and provided five million days of training (equivalent to
4.2 days per employee per annum and 7.5 days per person trained).
Employees in Professional roles and in Caring, Leisure and Other services roles were
most likely to have received training; conversely Administrative and Clerical staff,
Elementary occupations and Managers were least likely. This is similar to findings from
the UK as a whole.
Employer expenditure on training over these 12 months was £1.72 billion, which is
equivalent to £1,450 per employee and £2,600 per person trained. Whilst overall volume
of training is equivalent to that seen in the UK as a whole, this per trainee spend is lower
in Wales than it is in the UK. This could be related to there being lower wages in Wales
than across the UK as a whole. Another possibility is that it results from the specific types
of training undertaken in Wales (i.e. the average cost of these is lower than across the
UK more widely). Furthermore, the fact that a slightly higher proportion of staff in Wales
are trained than across the UK as a whole may also explain why the difference widens
between the per capita and per trainee expenditure.
Half of total expenditure covers the cost of paying staff while they are being trained, whilst
just eight per cent is accounted for by fees to external providers.
The extent to which establishments plan their training varied, with fewer than half (44 per
cent) having either a training plan (38 per cent) or a budget for training expenditure (26
per cent). Many workplaces undertake training on an ad hoc basis, with over half of those providing training saying they did not have a formal training plan in place.
The most common reason for not training is that employers consider their staff to be fully
proficient and / or that their staff did not need training (mentioned spontaneously by 65
per cent of non-trainers). Few point to failures in training supply as a reason for not
High Performance Working
“High Performance Working Practices” are those designed to increase employee
discretion over their work and effectively use and develop skills that employees possess.
Most establishments in Wales were engaging in practices that could be considered “high
performance working practices”, most commonly through providing a varied, flexible
working environment where employees have discretion to do their work.1
Communication with employees was also widespread, most commonly via scheduled
team meetings.
In terms of people management, around two-thirds of establishments gave formal job
descriptions to at least some of their employees and a half of establishments had annual
performance reviews for at least some staff. However fewer used pay and incentive
schemes to motivate staff: the most common scheme was to award bonuses based on
overall company performance, used by 23 per cent of establishments.
Larger establishments and those in South East Wales were most likely to have high
performance working practices in place.
1
For more information on High Performance Working, see UKCES (2010), High Performance Working: A Policy Review
1
Introduction
The UK Commission’s Employer Skills Survey 2011 is the key UK data source on
employer demand for and investment in skills. It is the first UK-wide employer skills
survey and is also one of the largest employer skills surveys undertaken in the world with
over 87,500 achieved interviews across the UK and over 6,000 in Wales among large
and small businesses in every sector.
The full UK report is published on the UK Commission website.2 This report focuses on
the findings from the interviews in Wales in 2011, and how this compares to the overall
UK population.
A skills survey was carried out in Wales in 2005, Future Skills Wales. The approach to
sampling and weighting paired with the differences in the question wording mean the data
from that study is not directly comparable with the 2011 survey, therefore results from this
2005 survey are not referenced in this report. Appendix A shows data tables comparing
equivalent populations in the 2011 and 2005 surveys where the questionnaire has been
similar enough to allow such a comparison.
This report delves into the rich data provided by the survey to set out the extent of
employer demand for skills; experiences of skill deficiencies and approaches to workforce
development, and how this varies among different groups of employers. Viewing this
information, alongside evidence of the product strategies used by business units, enables
us to look at the extent of employer ambition, and to start to explore what impact this
might have on training patterns and the emergence of skill deficiencies.
1.1
Methodological overview
The UK Commission’s Employer Skills Survey 2011 was a telephone-based survey. It
was conducted in three parts: a core population survey of UK workplaces, and a (smaller)
follow-up survey of workplaces which had provided training for some of their employees
in the 12 months preceding the survey, looking at employers’ investment in training
(“Investment in Training Survey”), Below we briefly summarise the key features of the
methodology adopted across the surveys. Further details can be found in Appendix C
1.2
Sampling
The sample analysed in this report comprises establishments (i.e. individual sites of an
organisation) that have one or more people working at them, excluding sole traders
(where a site has one worker and this person also owns part or all of the business). It
encompasses establishments across the full geographical spread of Wales, in all sectors
of the economy (across the commercial, public and charitable spheres). It should be
noted that the presence of establishments from multi-site organisations in the survey
means that in some instances interviews will have been completed with more than one
site of an organisation.
A stratified random approach was taken to sampling the core survey, using population
statistics from the Office for National Statistics’ (ONS) Inter-Departmental Business
Register (IDBR), and setting quotas for establishment size crossed by sector within each
region.
A stratified random approach was also taken for the Investment in Training survey, with
targets set based on country, size, sector and the type of training establishments reported
arranging for employees during the core survey.
All of the employers interviewed for the follow-up surveys had previously been
interviewed as part of the core survey (and had given their permission to be contacted for
further research).
1.3
Questionnaire
The core survey questionnaire was designed in several stages, with the co-operation of
the four constituent nations of the UK. There were considerable pressures on the
questionnaire both in terms of balancing the need for consistency across the UK with the
need for continuity with legacy questionnaires; and also in terms of the drive to cover a
wide range of issues without over-burdening employers and creating a lengthy
questionnaire. The questionnaire was extensively piloted in May 2010 and again in
February 2011, an exercise which included 10 follow-up cognitive interviews.
The questionnaire used for the 2011 Investment in Training follow-up exercise was the
same as that used in the “Cost of Training Survey” in England in 2009. The questionnaire
used for the survey can be found on the UK Commission website and within the
Technical Report.
1.4
Fieldwork
Fieldwork for the core survey was undertaken between March and July 2011, involving
Fieldwork for the follow-up survey of training expenditure was undertaken in May to July
2011, and involved more than 11,000 interviews across the UK (around 1,500 in Wales)
with employers who had taken part in the first survey. Table 1.1 shows the total number
of interviews in Wales in each of the two facets of the survey, along with the respective
response rate for each.
Table 1.1 Survey response rates
Total interviews Response rate
Core survey 6,012 55%
Investment in Training follow up 1,501 69%
Response rates are shown as a proportion of all completed contacts (completes, refusals and stopped interviews).
1.5
Data weighting
Findings from the core survey have been weighted and grossed up to reflect the total
population of establishments in Wales with one or more people working there, excluding
sole traders. The weighting was designed and undertaken on an interlocking size and
sector basis separately for each country. Separate weights have been generated which
allow findings to be presented (a) based on the number of workplaces reporting a
particular experience, and (b) based on the number of employees and/or job roles
affected by different challenges.
Findings from the Investment in Training Survey have been weighted and grossed up to
reflect the population of training employers as defined by the weighted core survey
findings.
1.6
Reporting conventions
The survey was carried out at an establishment level; the terms “establishment”,
“employer”, “workplace” and “business unit” are used for this interchangeably throughout
The scale and scope of data collected by the UK Commission’s Employer Skills Survey
2011 means that it is a valuable research resource supporting detailed and complex
statistical analysis of the inter-relationships between employer characteristics, and their
practices and experiences. The findings presented in this report have been produced
through a more descriptive exploration of the data. The large base sizes on which most of
the findings are based mean that we can have a good degree of confidence in the
patterns described in the text; the document should not be read as a statistical report,
however. A table showing confidence intervals is shown in Appendix F to give some
indicative guidance as to what can be considered a “significant” difference at sub-group
level. Throughout the report unweighted base figures are shown on tables and charts to
give an indication of the statistical reliability of the figures. These figures are always
based on the number of establishments answering a question, as this is the information
required to determine statistical reliability. Therefore, for example, where percentages are
based on “all vacancies”, the base figure quoted is the number of establishments with
vacancies.
As a general convention throughout the report, figures with a base size of fewer than 25
establishments are not reported (with a double asterisk, “**”, displayed instead), and
figures with a base size of 25 to 49 are italicised with a note of caution.
In tables, “zero” is denoted as a dash “-” and an asterisk “*” is used if the figure is larger
than zero but smaller than 0.5.
For more detail on the survey methodology, sampling and weighting, questionnaire
design and analysis, refer to the UK Commission’s Employer Skills Survey 2011:
2
Nature of Welsh establishments
In order to give some context to the findings that are presented in this report, and to
facilitate understanding of the differences in employers’ experiences and practices, this
section describes some of the key characteristics of the business establishments in
Wales. These include their size and sector distribution; and the geographical spread of
establishments across the nation.
ONS figures show there were around 100,000 “in-scope” establishments in Wales in
March 2010, with around 1.2 million people working in them.3
2.1
Size
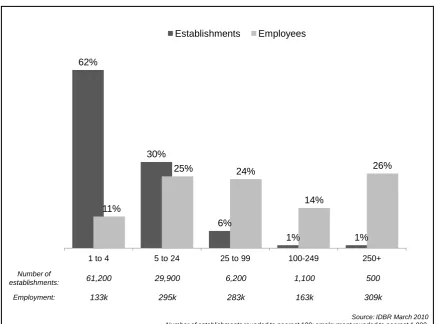
IDBR data shows us that the majority of Welsh establishments (62 per cent) were small,
employing fewer than five people. Sites employing 250 or more staff represent only one
per cent of all establishments but account for one-quarter (26 per cent) of overall
employment (see Figure 2.1). Distribution of establishment and employment by size is
[image:23.595.79.516.392.716.2]similar in Wales to the rest of the UK.
Figure 2.1 Size distribution of establishments and employees
62%
30%
6%
1% 1%
11%
25% 24%
14%
26%
1 to 4 5 to 24 25 to 99 100-249 250+
Establishments Employees
Number of
establishments: 61,200 29,900 6,200 1,100 500
Employment: 133k 295k 283k 163k 309k
2.2
Sector
Sectoral analysis in this report is defined by a 14 sector split, based on the
establishment’s Standard Industrial Classification (SIC) 2007 code.4
IDBR statistics show that Wholesale and Retail and Business Services (this sector
includes, among other things, real estate activities, consultancy, advertising and
employment agencies) are the two largest sectors in terms of the number of
establishments. Together, these two sectors account for more than a third (37 per cent)
of establishments in Wales. When measured in terms of people working in the sector,
however, the two largest sectors are Wholesale and Retail and Health and Social Work,
each of which employ 16 per cent of the workforce in Wales
The sector profile of Wales differs from that of the rest of the UK. The most striking
difference is in the proportion of establishments in the Agriculture sector, at 10 per cent in
Wales but just four per cent in the UK as a whole (with two and one per cent of all
employment falling into this sector respectively). Conversely the proportion operating in
Business Services is just 17 per cent in Wales compared to 24 per cent in the UK as a
whole, where it is the largest sector, and 11 per cent of the workforce is employed in this
sector in Wales compared to 17 per cent of the UK workforce as a whole.
Figure 2.2 Sectoral distribution of establishments and employment
10% *% 5% 1% 10% 20% 9% 7% 2% 17% 2% 3% 7% 7% 2% 12% 1% 5% 16% 7% 5% 3% 11% 7% 10% 16% 4% A gr ic ul tur e M ini ng a nd Q ua rr y ing M a nuf a c tur ing E lect rici ty , G as an d W at er C ons tr uc tion W h o les al e an d R et ai l H ot e ls a nd R e s ta ur a nt s T ra ns por t a nd C om m uni c a tions F in an ce S er v ices B u si n e ss S e rvi c e s P u b lic A d m in is tr a tio n E duc a tion H e a lth a nd S oc ia l W or k C om m uni ty , S oc ia l a nd P er s o n al S er v ices a c tiv it ie s Establishments Employees
Number of establishments in Wales (rounded to nearest 100)
9,900 100 5,400 700 10,000 19,700 8,800 6,500 2,000 17,000 1,600 3,200 7,200 6,800
Employment in Wales (rounded to nearest 1,000)
28k 2k 139k 15k 64k 193k 80k 64k 30k 131k 88k 117k 183k 48k
Source: IDBR March 2010
The Health and Social Work, Public Administration and Education sectors have a higher
proportion of large establishments and employ a disproportionately high percentage of
workers compared to the percentage of establishments in their sectors. For example,
Education has only three per cent of all establishments, but 10 per cent of employment.
The Manufacturing sector also represents a higher than average proportion of larger
establishments that employ a relatively large proportion of the workforce: Manufacturing
has five per cent of the enterprises in Wales, but 12 per cent of the workforce.
Conversely, the Agricultural sector comprises 10 per cent of establishments, but employs
only two per cent of the workforce in Wales, meaning that establishments in this sector
are likely to be smaller.
Most establishments in Wales (85 per cent) described themselves in the survey as
operating in a commercial sphere, with small minorities operating in the public sector
(seven per cent) and in the third sector (eight per cent). Establishments in the private
sector tend to be relatively small, accounting for 85 per cent of total establishments, but
only 68 per cent of employment. Conversely, establishments in the public sector tend to
be larger than those in the private sector; these account for only seven per cent of
establishments in Wales, but employ one-quarter (25 per cent) of the workforce.
Figure 2.3 Establishments and employment by Private, Public and Third sector
85%
7% 8%
68%
25%
6%
Private sector Public sector Voluntary sector
Establishments Employees
Base: All establishments in Wales: 6,012 (unwtd)
2.3
Region
As shown in Figure 2.4, South East Wales has the largest number of both establishments
and employees. This region is the most built-up of the four and contains the cities of
Cardiff and Newport; it accounts for over two-fifths (41 per cent) of establishments, and
half (50 per cent) of the workforce in Wales. Mid Wales is the smallest region with only 11
per cent of establishments, employing seven per cent of the workforce; this might be
expected as the region is predominantly rural. North Wales and South West Wales are of
similar size, both holding around a fifth to a quarter of both establishments and
employees.
Figure 2.4 Establishments and employment by Region
The size distribution of establishments is not uniform between regions; establishments in
Mid Wales are more likely to be smaller whilst those in South East Wales and North
Wales are more likely to fall into one of the larger sizebands. Throughout this report size
will be highlighted as a main driver of difference for a lot of the measures; therefore
understanding the different size profiles of the regions will aid the interpretation of any
differences seen between the regions.
25%
11%
23%
41%
22%
7%
21%
50%
North Mid South West South East
Establishments Employees Number of establishments in Wales (rounded to nearest 100)
24,300 11,400 22,700 40,600
Employment in Wales (rounded to nearest 1,000)
265k 80k 252k 586k
Figure 2.5 Size distribution within Region
Similarly, there is some difference in the sector distribution of establishments between the
different regions. Mid Wales has a far higher proportion of Agriculture establishments,
with over a quarter of establishments in this region falling into this sector compared to 10
per cent in Wales as a whole. In turn, it has far fewer establishments than the other
regions in Construction and Wholesale and Retail. South West Wales on the other hand
has a higher prevalence of Wholesale and Retail compared with the Wales average (see
Table 2.1). Along with size, sectoral differences account for much of the differences seen
between regions. 58%
72%
66%
59% 34%
24%
27%
32%
6% 4% 6% 7%
2% 1% 1% 2%
North Mid South West South East
1 to 4 5 to 24 25 to 99 100+
Number of establishments in Wales (rounded to nearest 100)
24,300 11,400 22,700 40,600
Table 2.1 Sector distribution within Region
Sector Wales North
Wales
Mid Wales
South West Wales
South East Wales
Total number of establishments 98,950 24,300 11,400 22,700 40,600
% % % % %
Agriculture 10 8 26 12 6
Mining and Quarrying * * 1 * *
Manufacturing 5 6 6 5 5
Electricity, Gas and Water 1 1 1 * 1
Construction 10 11 6 10 11
Wholesale and Retail 20 17 13 24 21
Hotels and Restaurants 9 12 11 8 7
Transport and Communications 7 6 5 6 8
Financial Services 2 3 1 1 2
Business Services 17 17 17 15 19
Public Administration 2 2 1 2 2
Education 3 3 2 3 4
Health and Social Work 7 7 6 7 8
Community, Social and Personal
Services activities 7 7 5 6 8
Source: ONS IDBR March 2010
2.4
The structure of establishments
The size of an establishment is important in that it determines both the skills and
employment challenges employers face and the ways in which they react to these
challenges. However, establishments can be part of wider organisations, and this can
bring a different dimension to their experience and practice. The size of an establishment
does not necessarily tell a complete story about, for example, its access to skills or other
resources when the establishment is part of a larger, multi-establishment (and potentially
multi-firm) organisation.
A third of all establishments (32 per cent) report that they are part of a larger
organisation; this is broadly in line with the UK average of 36 per cent. The likelihood of
an establishment being part of a larger organisation varies with size, with over four-fifths
(83 per cent) of establishments with more than 250 employees reporting they are part of
a larger organisation compared to just over one-fifth (23 per cent) of establishments with
Figure 2.6 Single or Multi site organisation
The survey confirms that decisions about recruitment and training are most commonly
taken at site level (and this is the natural level to discuss these issues in subsequent
sections of the report). The majority of establishments in Wales are single site
organisations (68 per cent) and therefore have full responsibility and autonomy when it
comes to decisions about recruitment and training; a further five per cent are the Head
Offices of multi-site organisations, and as such we can assume that they too have full
autonomy in these areas. This leaves just over one-quarter of employers which are sites
within larger organisations, most of whom, nevertheless, have substantial or even
complete autonomy of these issues (just 12 per cent of establishments have no input into
recruitment and training decisions).
Single site 68% Multi-site: Head
Office 5%
Multi-site: Not Head Office
27%
Base: All establishments in Wales: 6,012 (unwtd)
2.5
Business strategies
The UK Commission’s Employer Skills Survey 2011 included a series of questions which
asked establishments how they compared to others in their industry on a range of
indicators including innovation, quality of product, price dependency and customisation.
Together these indicators can be seen to give a sense of the overall type of ‘product
market strategy’ (PMS) being adopted by the establishment. Private sector employers
were asked to rate their establishments, compared to others in their industry, in terms of:
• the extent to which success of products/services was dependent on price;
• the extent to which they perceive their establishment to lead the way in their sector in
terms of developing new products, services or techniques;
• whether they compete in a market for standard/basic or premium quality products or
services;
• and whether they offered a standard range of goods or services, or customised
products/services with substantial differences according to customer requirements.
Figure 2.7 shows overall responses to each of these individual position statements; these
are similar to the responses seen in the UK for the same questions.
Figure 2.7 Product Market Strategy positions
17%
20%
8%
14%
14%
6%
36%
39%
26%
26%
28%
15%
16%
25%
31% 11%
18%
30%
1 2 3 4 5
Base: All establishments in Wales in the private sector: 4,743 (unweighted)
Source: UKCESS 2011 survey Wholly price
dependent
Rarely leads the way
Standard or basic quality
Standard range of goods/ services
Not at all price dependent
Often leads the way
Premium quality
Responses to these individual product market positions were then aggregated to derive a
composite product market score5 on a scale from “very low” to “very high” as illustrated in
Figure 2.8. The distribution of product market strategy scores was very similar in Wales to
that seen in the UK as a whole. Overall establishments were more likely to score a high
level product market strategy position than a low one. A third of establishments (32 per
cent) describe a product market strategy which places them in the middle of their sector,
with a similar number (32 per cent) categorised as having a high or very high product
strategy. A fifth of establishments scored ‘low’ or ‘very low’; the remainder could not be
classified as they had not given answers to all of the necessary questions.
Figure 2.8 Product Market Strategy positions
Table 2.2 shows where there are differences in each sizeband; smaller establishments
are more likely to have a “low” or “very low” score on the PMS scale than larger ones;
these larger establishments are more likely to fall into the group with a “high” score.
5%
18%
32%
24%
9%
0% 5% 10% 15% 20% 25% 30% 35%
Very Low Low Medium High Very High
Product Market Strategy score
Base: All establishments in Wales in the private sector : 4,743 unweighted
Note: 14 per cent of private sector establishments could not be classified into a PMS score as they answered “don’t know” at one or more of the questions that make up the composite measure.
Table 2.2 Product Market Strategy by Size
Wales
Total 1-4 5-24 25-99 100+
Unweighted base 4,740 1,050 2,771 759 163
Column % % % % % %
Very Low 5 5 4 2 1
Low 18 20 15 10 6
Medium 32 31 33 34 36
High 24 22 26 33 33
Very High 9 8 10 11 14
Base: All establishments in the private sector
NB 100-249 and 250+ groups have been combined in this table to give a more robust base size Source: UKCESS 2011
There was little difference in product market strategy score between the four regions.
Table 2.3 sets out the differences in the levels of product market strategy between the
two designated ESF regions: West Wales and the Valleys and East Wales. There were
few differences between the two regions, however, East Wales was more likely to be
scored high or very high (36 per cent) than West Wales and the Valleys (30 per cent). At
the low end of the scale the variation was smaller: 23 per cent were scored low or very
low in West Wales and the Valleys, compared with 20 per cent in East Wales.
Table 2.3 Product Market Strategy by ESF Region
West Wales and
the Valleys East Wales Wales Total
Unweighted base 2,934 1,806 4,740
Column % % % %
Very Low 5 3 5
Low 18 17 18
Medium 31 33 32
High 22 27 24
Very High 8 9 9
Base: All establishments in the private sector
Source: UKCESS 2011
2.6
Product Market Strategy and workforce skill level
The business strategy adopted by an establishment will affect the skill levels it requires
staff to have. The UK Commission’s Employer Skills Survey uses workforce qualification
For the purposes of this report workforce qualification levels are based on the distribution
of Level 4 qualifications and group employers into three bands: those where fewer than
20 per cent of the workforce hold a Level 4 qualification (“Low”); those where between 20
and 80 per cent hold a Level 4 qualification (“Medium”) and those where more than 80
per cent of the population hold a Level 4 qualification (“High”). Figure 2.9 shows how
establishments in Wales split by these three groups, and also shows how the proportion
of staff with Level 3 qualifications or above is distributed. For example, it shows that in 41
per cent of establishments, fewer than 20 per cent of the workforce hold Level 4 or above
qualifications, but that in 17 per cent of establishments 80 per cent or more of the
workforce hold Level 4 qualifications or above and in 33 per cent of establishments 80
per cent or more of the workforce hold Level 3 qualifications or above.
Establishments in Wales reported slightly lower proportions of their workforces as
qualified to Level 3 than the UK as a whole, where 41 per cent had at least 80 per cent of
their staff qualified to Level 3. The difference between Wales and the UK at Level 4 was
slightly less pronounced with 23 per cent of establishments across the UK having at least
80 per cent of their workforce qualified to that level.
Figure 2.9 Proportion of staff qualified to Level 3 and Level 4
20% 41%
32%
32%
33% 17%
Proportion of staff with at least a level 3
qualification Proportion of staff with at
least a level 4 qualification
<20% 20-80% >80%
Base: All establishments in Wales: 6,012 (unweighted)
Source: UKCESS 2011
(10% Don’t know)
• small establishments (23 per cent of establishments with 1-4 staff had a highly skilled
workforce, compared to nine per cent of those with 5-24 staff, six per cent of those
with 25-99 staff and five per cent of those with 100 or more staff),
• in Business Services (31 per cent), Community, Social and Personal Services
activities (22 per cent) or Transport and Storage (21 per cent),
• in the East Wales ESF region (21 per cent, compared to 15 per cent in West Wales
and the Valleys).
Establishments who score highly in the product market strategy measure also tend to
have a higher level of skills among their staff (defined as the proportion qualified to at
least Level 4, see Figure 2.9). In the UK as a whole we see there is a pattern that as the
product market strategy score increases the proportion of establishments with a highly
skilled workforce also increases (and conversely the proportion with low skilled workforce
decreases). The same holds for Wales except for the “very high” PMS score group, which
drops back down to just 14 per cent with a highly skilled workforce compared to 21 per
cent in the “high” PMS score group.
Figure 2.10 Skills level by Product Market Strategy
Having set out the key characteristics of establishments in Wales, the remainder of this
report now presents findings from the survey. 65%
50%
43%
33%
45%
24%
30%
32%
36%
33% 3%
12%
17%
21% 14%
Very Low Low Medium High Very High
High skill level
Medium skill level
Low skill level
Product Market Strategy score
Base: All establishments in Wales in the private sector
Source: UKCESS 2011 survey
2.7
Structure of this report
The characteristics described in this chapter will be used to analyse the UK
Commission’s Employer Skills Survey 2011 data for Wales in the following areas:
• the work-readiness of leavers from education, which explores the incidence of
recruiting education leavers and how well prepared they are for the working world;
• recruitment and skill shortages, which looks at employer recruitment activity and
measures the extent and causes of labour market shortages, focusing particularly on
skill shortages, and identifying the impact that such labour market failure has on
establishments;
• internal skills mismatch, which explores the proficiency levels of establishments’
existing workforce, measuring and describing skills gaps in detail, and retention
issues. The survey also takes a preliminary look at the under-use of skills, where
establishments report that employees have more skills and qualifications than
required for their current job role;
• the extent and nature of employer training and workforce development, including the
3
Work-readiness of education leavers
Chapter Summary
In Wales around a quarter of establishments (24 per cent) had recruited at least one
education leaver in the two to three years previous to the survey. The majority of these
employers found their recruits to be well prepared for work; the minority that did not most
commonly put this down to a lack of experience of the working world, life experience or
maturity, or to poor attitude, personality or a lack of motivation.
The proportion of employers finding education leavers to be well prepared for work
increased with age / educational level:
• 56 per cent among those recruiting 16 year-old school leavers found them well
prepared;
• 65 per cent of those recruiting 17-18 year-olds from school;
• 75 per cent of those recruiting 17-18 year-olds from Further Education;
• 80 per cent of those recruiting from Higher Education institutions.
3.1
Introduction
Before considering recruitment activity and skills levels more broadly (in Chapters Four
and Five), this chapter looks at the recruitment and skill levels of education leavers. More
specifically, it looks at the proportion of employers that have recruited anybody into their
first job on leaving education in the past two to three years, before then exploring
employers’ perceptions of these recruits in terms of their readiness for work and their
skills.
Employers in Wales were asked about four groups of leavers: 16 year-olds from school,
17-18 year-old school leavers, 17-18 year-old FE college leavers, and those entering
employment straight from Higher Education. Higher Education leavers could be of any
age as long as they were entering their first job on leaving education.
3.2
Incidence of recruitment of school, college and HE leavers
In the last two to three years, just under one-quarter of establishments in Wales (24 per
cent) had recruited at least one education leaver to their first job on leaving education.
There was no variation in this proportion between Wales and the UK as a whole. More
specifically, between eight and 10 per cent of establishments had taken on education
The larger the establishment, the more likely they were to have taken on each type of
recruit from education. In part, this is simply a product of larger establishments being
more likely to recruit per se (current recruitment activity is discussed in Chapter Four), and is a trend that holds for all levels of education leaver.
There were some differences in recruitment of education leavers by sector.
Establishments in Education were considerably more likely to have taken on any
education leavers (45 per cent), and they were more than three times as likely as the
average to have taken on leavers from university or Higher Education (37 per cent,
compared with 10 per cent of all establishments). Recruitment from education was also
particularly common in the Health and Social Work sector (32 per cent), Hotels and
Restaurants (29 per cent) and Community, Social and Personal Service Activities (29 per
cent). Establishments in the industries of Agriculture (11 per cent) and Transport and
Communications (14 per cent) were the least likely to have taken on any education
leavers.
There was some variation between different regions in Wales. Establishments in South
East Wales were most likely to have recruited education leavers (26 per cent), while only
a fifth (20 per cent) in Mid Wales had recruited staff of this kind. Although the proportion
of establishments who had recruited education leavers was equal between ESF regions,
establishments in East Wales were more likely to have recruited university or HE leavers.
This ties in with the finding presented in Chapter 2 that establishments in this region were
more likely to have a highly skilled workforce.
Table 3.1 Incidence of recruitment from education in last 2-3 years An y 16 year olds r ecr uit ed t o f ir st job f rom school 17 or 18 year olds r ecr uit ed to f ir st job f rom school 17 or 18 year olds r ecr uit ed to f ir st job f rom FE C ol lege R ecr uit ed t o t heir f ir st job fro m U nive rsit y or ot her H igher E du cat ion inst it ut ion Unwtd
base % % % % %
Wales Total 6,012 24 8 8 10 10
UK total 87,572 24 7 9 8 10
Size
1-4 1,216 12 4 3 4 4
5-24 3,474 38 12 14 15 15
25-99 1,074 59 18 28 29 37
100-249 151 69 21 33 33 53
250+ 97 73 32 53 55 61
Sector
Agriculture 102 11 2 2 3 4
Mining and Quarrying 22 ** ** ** ** **
Manufacturing 468 27 9 13 10 8
Electricity, Gas and Water 111 25 6 10 6 9
Construction 503 23 13 6 8 4
Wholesale and Retail 1,069 26 11 12 14 8
Hotels and Restaurants 675 29 12 15 14 12
Transport and
Communications 439 14 4 3 4 7
Financial Services 173 22 5 7 7 15
Business Services 791 21 5 5 7 13
Public Administration 130 20 2 9 10 17
Education 391 45 4 7 13 37
Health and Social Work 580 32 4 9 14 17
Community, Social and
Personal Services activities 558 29 9 10 13 9
Region
North Wales 1,431 24 8 8 9 11
Mid Wales 798 20 5 7 8 8
South West Wales 1,389 22 8 8 10 8
South East Wales 2,394 26 8 9 11 12
ESF Region
West Wales and the Valleys 3,732 24 8 9 10 9
East Wales 2,276 24 7 8 9 12
Base: All establishments
3.3
Perceived work-readiness of education leavers
In order to gauge the perceived work-readiness of recruits that had been taken on in the
last two to three years straight from education, employers who had taken any on were
asked whether they considered these recruits to be very well prepared, well prepared,
poorly prepared or very poorly prepared for work.
Employers were more likely to feel that recruits from education were well prepared for
work than poorly prepared, and the perceived level of work-readiness increases with the
amount of time recruits have spent in education (see Figure 3.1). Four-fifths (80 per cent)
thought that university or HE leavers were well prepared, compared with only 56 per cent
who thought the same of 16 year old school leavers. This is similar to the pattern seen
across the UK.
Figure 3.1 Perceived work-readiness of education leavers in the last 2-3 years
There are a number of possible reasons why recruits from Higher Education may be seen
as better prepared for work than younger recruits: it could be because of the additional
time graduates have spent in education or because employers may invest more
resources in graduate recruitment and therefore be likely to find more suitable individuals.
It may also simply be because graduates are older and therefore more mature generally.
26% 23%
15% 14%
13%
8%
4% 1%
47% 53%
63%
56% 10%
12%
12% 24%
Very well prepared
Well prepared
Poorly prepared
University or HE leavers 17 -18 year old
school leavers 16 year old
school leavers
Unweighted base:
17 -18 year old FE leavers
Very poorly prepared
808 1,011 1,084 1,172
There are also various hypotheses that could explain why 17-18 year-old FE recruits are
seen as being more work-ready than contemporaries recruited from schools. These
include college students being more likely to be studying vocational courses, and college
students also being more likely to combine work and learning and therefore to have
amassed more work-relevant experience.
Establishments in South East Wales were less likely to see their university leavers as well
prepared for work; just 74 per cent did so compared to 80 per cent in Wales as a whole.
Those in Mid Wales were least likely to see 16 year-old school leavers as well prepared,
with 49 per cent saying they were compared to 56 per cent across Wales as a whole.
Establishments in North Wales were most likely to find university leavers well prepared or
very well prepared for work (88 per cent found them so). Figure 3.2 shows perceived
work-readiness by region.
Figure 3.2 Perceived work-readiness of education leavers in the last 2-3 years by region
3.4
Skills and attributes lacking among education leavers
Those employers who reported that the education leavers they had recruited were
poorly-prepared for work were asked to indicate what skills or attributes they were lacking.
The key findings are as follows (see Table 3.2):
31% 44%
24% 21% 27% 25% 25% 20% 15% 16% 16% 14% 7%
13% 10% 19%
8%
8%
14% 17% 4% 5% 5%
12% 4% 3% 9% 2% 1% 2% 2%
45% 45% 52%