In recent years, science teaching has increased in importance, given structural changes in the UK economy and an increasingly technology-driven society.1 By 2030, it is expected that there will be more than 7 million jobs in UK science-based industries.2
However, the recruitment of teachers with a qualification in the subject they teach, especially in physics, has failed to keep pace.3 A recent report by the Institute of Physics found that nearly 10% of school sixth forms had no students entered for AS- or A-level physics, with schools suggesting a lack of specialists as one reason for this absence.4 Other data has previously suggested that up to 500 secondary schools have no specialist physics teacher.5
Specialist subject qualifications are not the only measure of a good teacher, and not all evidence has found a link between a teacher’s subject qualifications and pupil attainment.6 The relationship is not straightforward to chart, because large scale studies tend to look at overall school effects, rather than narrowing the results for pupils taught by specific teachers. However, enough research, including dedicated studies of science provision, has pointed toward a benefit to student attainment to make this an area worthy of consideration.7 Previous Sutton Trust research has found that subject specific pedagogical knowledge is extremely important for effective teaching, and other research shows that, even if exam attainment is not considered, science teachers with relevant qualifications are more likely to encourage their students to pursue the subject post-16.8 The situation is well summarised by a previous DfE statement in this area: “An adequate qualification in the particular subject must be the basis for effective subject teaching, but good
teachers do not simply rely on their basic qualifications; they take every opportunity to keep up to date with developments in order to ensure that they are on top of their subject.”9 The lack of specialists is felt more keenly in some areas than others. Across the 40% of schools with the largest proportion of pupils entitled to free school meals (FSM), 76% of science teachers possess a qualification relevant to the main science subject they teach; across the 40% of schools with the lowest FSM entitlement, it is 83% of teachers.10 Similarly, Education Datalab have found that schools with higher attainment pupil intakes had more
physics specialist teachers and better entry rates to GCSE physics.11 This is a concern given the increasing size of the science job market and the existing shortfall of those from disadvantaged backgrounds in the top professions.12 What is being done? In 2015, it was announced by the government that £67 million would be made available to “offer career professionals the opportunity to receive fast track training to become maths and physics teachers, upskill thousands of existing teaching staff and attract top graduates into the profession[s] with financial incentives.” As part of this, “Up to £15,000 will be available to top maths and science undergraduates while at university –
Key findings
• Specialist science teaching in English secondary schools suffers from a recruitment problem. While there are many excellent science teachers, there has been a consistent failure to attract the required number with relevant qualifications. Those who do train also tend to have lower than average qualifications compared to other teachers and science graduates.
• This ‘science shortfall’ is particularly acute in physics. DfE figures show physics has the greatest recruitment shortage of the science subjects (five consecutive years of missed targets), the highest proportion of hours taught by non-specialists (25%), and the lowest teacher qualification levels (63% with a 2:1 at undergraduate level, compared to an undergraduate average of 76%). Only 51% of those who teach physics in secondary schools have a specialist degree or higher qualification.
• New data collected for this report shows schools with the largest numbers of disadvantaged pupils are the least likely to have teachers with relevant science qualifications. In the 40% of schools with the most pupils entitled to free school meals, 76% of teachers have a qualification relevant to the main science subject they teach; in the 40% of schools with the lowest numbers of FSM pupils, this rises to 83%.
• Secondary academies are also more likely to have specialists than maintained schools: 86% of science teachers at academies possess a qualification relevant to the main science subject they teach, falling to 67% for maintained schools.
• Independent schools are more likely to have science teachers with relevant qualifications in their main teaching subject than state schools. This is particularly pronounced in physics, where 91% of independent teachers are specialists, compared to 78% of state teachers.
Dr Philip Kirby and Carl Cullinane
Science Shortfall
in return for a commitment to teach for 3 years after graduating.”13 Such incentives hold promise, but recruitment remains a significant problem.
This brief uses data from the National Foundation for Educational Research (NFER) Teacher Voice Omnibus Survey, the Independent Schools Council’s Annual Census and the Department for Education (DfE)’s annual School Workforce Census, amongst other datasets, to provide an overview and discussion of current trends in science specialism. Defining subject specialism is complicated, but here we try to apply as common an approach as
possible across the multiple datasets (see Annex). The brief focuses on secondary science provision and the access of disadvantaged pupils to specialist science teachers.14
OVERVIEW
In the most recent DfE census, there were 6,300 teachers teaching physics in English secondary schools, 7,500 teaching chemistry and 8,700 teaching biology. Annually, physics teachers teach 44,500 hours of lessons, chemistry teachers 50,200 and biology teachers 57,300. For combined/ general science there are 32,100
teachers, who teach 384,900 hours of science, a large majority of science teaching as a whole. In total, there are 36,000 science teachers, teaching nearly 550,000 hours of science in English secondary schools.15 The past five years have seen government teacher recruitment targets missed in all three main science subjects (Table 1). The problem is especially pronounced in physics, which has had a long term recruitment shortage, and has continued to miss its target in each of the last five years. Trends across time are difficult to measure because of methodological changes to data collection (in this sense, absolute numbers can be misleading), but it is possible to highlight those years and subjects where targets have been missed. While provisional data for 2016/17 shows an improvement in all three science subjects from the previous year, particularly in physics, recent reports indicate that applications for physics places in the 2017/18 year are likely to be down substantially once again.16 One of the difficulties with the school provision of science is that STEM graduates are in such demand in the wider economy. Of all those enrolled on Initial Teacher Training (ITT) programmes by subject, physics trainees are the least likely to possess an undergraduate degree at 2:1 classification or above, followed
Subject 2012/13 2013/14 2014/15 2015/16 2016/17*
Entrants Biology 800 720 x 1050 1356
Chemistry 1170 1100 850 1003 1038
Physics 900 710 661 x x
Biology, General Science 850 x 766 x x
Physics, Physics with
Maths 900 710 661 x x
Entrants as % of target
Biology X 95% x 89% 115%
Chemistry 109 % 126% 119% 95% 99%
Physics X x x 71% 81%
Biology, General Science 101% x 85% x
Physics, Physics with
[image:2.595.40.562.34.311.2]Maths 97% 72% 67% x
Table 1: New entrants onto postgraduate Initial Teacher Training courses (x = data unavailable, * = provisional17
0% 1% 8%
1% 5%
11%
1% 2% 1% 0% 3%
2% 1% 2% 11%
6% 4%
9%
4% 23%
[image:2.595.38.381.552.777.2]closely by chemistry trainees (see Figure 3). Considering the distribution of degree classifications, this would appear to be only partly down to the fact that it is harder to get a first in science than in other degree courses, suggesting that top graduates in these subjects are entering professions other than teaching.
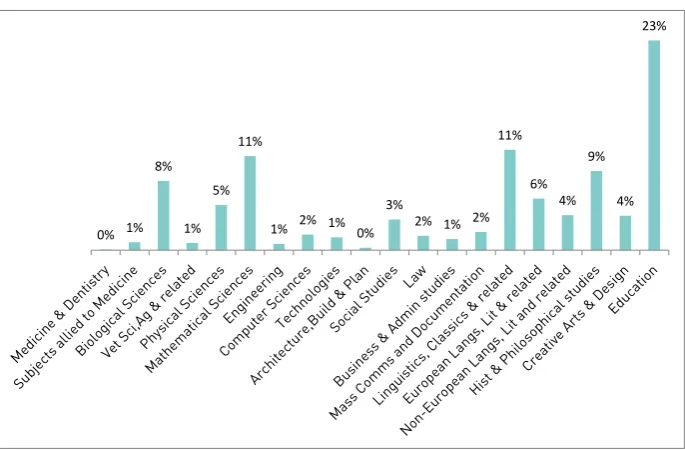
This is supported by other data. Figure 1 shows that the highest proportion of graduates entering ITT come from education undergraduate courses, as one might expect. However, ‘Linguistics, classics and related’, ‘mathematical sciences’, ‘historical and philosophical studies’, ‘European languages, literature and related’ and ‘biological sciences’ all have a higher proportion of students entering ITT courses than graduates in ‘physical sciences’. Partly, this will be a product of the differing number of graduates in each year, as well as the relative number of required secondary teachers in each of these fields, but it is notable than just 1 in 20 graduates in physical sciences choose to enter ITT.
The brief also finds differences in the proportion of science teachers with relevant science qualifications when disaggregated by region. Science teachers in London are more likely to possess a qualification in the subject that they teach than teachers in many other parts of the country. Again, these are broad trends, but given the distribution of poverty across the UK, it is important that students in different areas of the country have the same
access to specialist science teachers with relevant qualifications.
It is also important that any
recruitment drive does not become a numbers game. A small-scale survey conducted by the University of Cumbria found that the shortage of physics and chemistry teachers, and the relative surfeit of biology graduates, has led to biology graduates teaching physics and chemistry. This is supported by Department for Education data suggesting that 73% of non-specialist physics teaching hours, and 87% of non-specialist chemistry teaching hours, are being taught by teachers with a biology qualification.19 Amongst other concerns, it has been suggested that this will lower the standard of
biology teaching and disenchant teachers who are teaching a subject other than that with which they are most familiar.20
RESULTS
Science specialists by qualification and degree classification
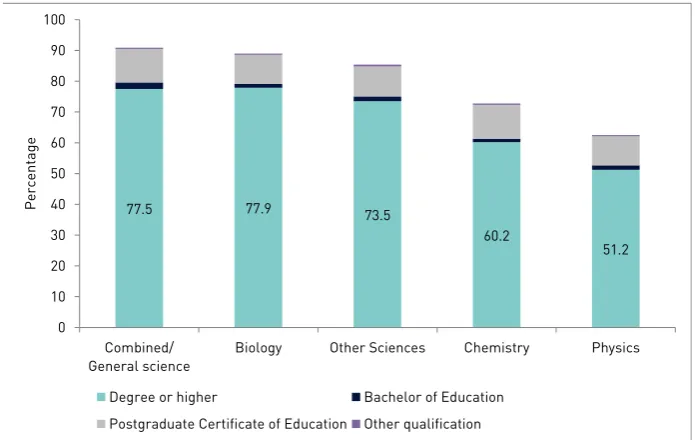
Combined/ general science lessons at secondary school are the most likely to be taught by a teacher with a relevant qualification. In large part, this is due to the fact that qualifications in any of those that map to biology, chemistry and physics are deemed relevant in the teaching of this subject, increasing the likelihood that a teacher will have a relevant qualification. Nonetheless, teachers of biology are only slightly less likely to have a relevant qualification, and are actually more likely than combined science teachers to have a degree or postgraduate qualification. Figure 2 shows chemistry and physics specialist teaching lagging behind biology, with teachers of physics significantly less likely to possess a relevant qualification in that subject. There also seem to be questions around the level of qualifications, as well as their relevancy. Of those graduates who entered postgraduate teacher training courses, STEM subject entrants possessed the lowest proportion of undergraduate degrees at 2:1 or better, while those in the humanities and social sciences generally possessed higher degree classes (Figure 3). It is possible that
77.5 77.9 73.5
60.2
51.2
0 10 20 30 40 50 60 70 80 90 100
Combined/
General science Biology Other Sciences Chemistry Physics
Pe
rce
nt
ag
e
Degree or higher Bachelor of Education Postgraduate Certificate of Education Other qualification
88% 87%
85% 84%
82% 81%
79% 78% 78%
76% 75% 75%
72% 72%
70% 69% 68% 65%
63%
[image:3.595.213.561.40.260.2]Figure 2: % of secondary science teachers with a relevant qualification, by subject and type of qualification (data from DfE)21
[image:3.595.36.379.553.777.2]these differences are derived, in part, from the differing proportion of upper seconds and above awarded across subjects. To give a broad comparison, about 71% of students awarded first degrees in biological sciences in 2015 achieved a 2:1 classification or higher, and about 73% in physical sciences, which includes degrees in chemistry and physics.22 However 75% of teacher trainees with a biology degree received a 2:1, compared to only 63% of those with a physics degree.
These figures suggest that a large proportion of the highest achieving graduates in chemistry and physics go into professions other than teaching. The economy is increasingly demanding skills in this area, often with generous remuneration packages. That some of the UK’s top science graduates are entering STEM careers other than teaching, though, may have the counterproductive effect of preparing today’s young people less well for careers in the same. SCORE has previously recommended that, “Candidates applying for teacher training courses in shortage subjects (physics and chemistry) should not be discouraged from doing so on the basis of having attained a lower class degree. A policy that does so may reduce recruitment into teacher training in shortage subjects and could represent a loss of teaching talent.”23 This might provide a solution in the short-term; in the long-term, of course, it would be desirable for science teaching to be able to attract the highest achieving graduates.
Data collected using NFER’s Teacher Voice survey for the Sutton Trust (Figure 4) suggests that secondary teachers with a qualification relevant to the main science subject they teach are more common in schools that have fewer FSM students, and vice versa. Across the top two quintiles of schools with the most FSM pupils, 76% of teachers possess a qualification relevant to the main science subject they teach; across the bottom two quintiles, 83%. Given the linkage between the possession of specialist topic knowledge and high quality teaching, this suggests that FSM students may be less able to access some of the best science teachers, by this measure, than their more advantaged peers.
The proportion of science specialists at secondary academies is also higher than at local authority maintained secondary schools: some 86% of science teachers at academies possess a qualification relevant to the main subject they teach, falling to 67% for maintained schools. (This may reflect the fact that many academies are now high performing secondaries that converted since 2010.) And the level of specialism amongst senior leaders appears higher than classroom teachers. Of senior leaders that teach science, 86% possessed a qualification relevant to the main science subject they teach; the equivalent for classroom teachers was 76%. Science specialists: state vs. independent sector
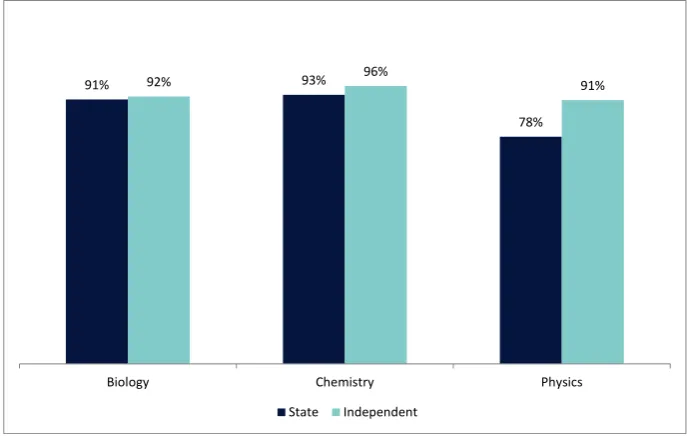
Science teachers are also more likely to have relevant qualifications in their main teaching subject in the independent sector compared to state schools. The differential is especially pronounced in physics, where a
substantially higher proportion (91% vs. 78%) of independent school teachers possess a relevant qualification in their main teaching science subject than in state school teachers (see Figure 5). Considering the breakdown by type of qualification and particular science subject shows that the differential in postgraduate degrees is especially stark. In biology, some 2% of state teachers possess a PhD relevant to their main teaching science subject, which rises to 11% in the independent
76%
83%
67%
86%
76%
86%
Most FSM
students Least FSMstudents Maintained Academies Classroomteacher Seniorleader
91% 93%
78%
92% 96% 91%
[image:4.595.215.559.55.261.2]Biology Chemistry Physics State Independent
Figure 4: Secondary science teachers with main teaching subject of biology, chemistry or physics and relevant qualification, by school and teacher type (data from NFER)25
[image:4.595.34.378.557.775.2]sector; in chemistry, the equivalent figures are 7% and 20%; in physics, 3% and 9% (Figure 6). In terms of specialist qualifications in main teaching subject, the independent science sector appears to have an edge over the state.
Science specialists by school region
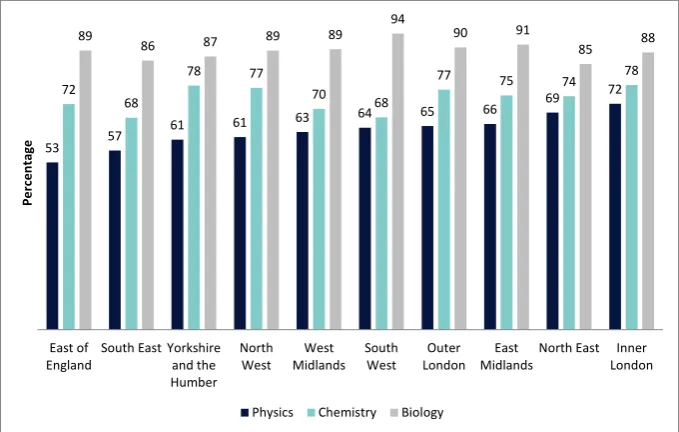
Substantial differences in rates of specialist teaching in science subjects exist across English regions. Again, this is particularly pronounced in physics provision, which exhibits the widest regional disparities. Using DfE data, Figure 7 shows the proportion of science teachers with a relevant qualification by region. This broadly supports polling for the Sutton Trust, which suggests that London has among the highest rates of science specialism. However, there is no clear North/South divide in access to physics teaching by those with specialist qualifications, with the East and South East among the regions with the lowest rates, and the North East only just behind Inner London. Given the substantially lower regional variation in biology and chemistry teaching, there appear to be particular geographical inequalities in access to physics teaching.
Access to triple science
Another consequence of the shortage and unequal distribution of physics teachers is in access to ‘triple science’ at GCSE – where students can study biology, physics and chemistry as separate subjects. Triple science is a
key avenue for pupils to access careers in STEM, and there has long been an access problem for disadvantaged pupils. Research conducted by the Sutton Trust has shown that only 13% of Pupil Premium students were taking triple science in 2013, compared to 30% of non-Pupil Premium students.27 While much of this difference can be attributed to prior attainment, a gap nonetheless remains.
Successive governments have sought to address the issue. Access to triple science increased in the 2000s when able pupils were first given an entitlement to study the subjects, and the Sutton Trust’s Changing the Subject shows that the introduction of the English Baccalaureate has also encouraged a greater number of pupils
53 57
61 61 63 64 65 66
69 72 72
68
78 77
70 68
77 75 74 78 89
86 87 89 89 94
90 91
85 88
East of
England South East Yorkshireand the Humber
North
West MidlandsWest SouthWest LondonOuter MidlandsEast North East InnerLondon
Per
cen
ta
ge
Physics Chemistry Biology
Figure 6: % of secondary teachers with main teaching subject of physics and relevant qualification, by type of qualification (data from NFER and ISC)
to take more science subjects, with entries to triple science increasing from 17% of pupils in 2010 to 25% in 2013, including a 5 percentage point increase for Pupil Premium students. With triple science entry rates
increasing as a result of these policies, teacher shortages remain a potentially limiting factor to this growth, and in particular the lack of physics teachers. That this shortage is greater in schools with intakes of lower attainment (often more likely to have more disadvantaged pupils), increasing the numbers and distribution of physics teachers should be a key goal in ensuring more equitable access to STEM careers across the socioeconomic spectrum.
CONCLUSION
In the context of greater demand for STEM graduates, and a political climate that may lead to limits on the immigration to Britain of highly qualified workers, the need for the education system to increase access to scientific knowledge, training and ultimately careers is an increasingly important one. Much has been done to increase rates of teachers with STEM qualifications, but more needs to be done in order to increase the accessibility of specialist science
[image:5.595.39.379.563.779.2]teachers for all pupils. It has been said that social mobility increases when there is ‘room at the top’, and the expanding, highly-skilled science and technology sector is a prime candidate to offer such room. England’s schools must give pupils from all backgrounds a greater chance of seizing that opportunity.
Figure 7: % of secondary physics, biology and chemistry teachers with a relevant qualification, by region and subject (data from DfE)26
3%
16%
57%
46%
5% 9%
21%
74%
52%
1% PhD Master's PGCE and other
ANNEX –
NOTE ON METHODOLOGY
Subject specialism
In the DfE’s annual School Workforce Census, as here, qualification refers to post-A level qualification and is defined as: Bachelor’s degree or higher, Bachelor of Education, Postgraduate Certificate of Education (PGCE), Certificate of Education, or other qualification (including foundation degrees, non-UK qualifications and higher national diplomas).28 The vast majority of
teachers possess bachelor’s degrees. The School Workforce Census has some limitations in this regard, particularly in the non-collection of Subject Knowledge Enhancement Course participation records. These courses have been taken by many of those teaching physics in particular, and could contribute to a teacher being regarded as a specialist.
With respect to subject relevance, “A teacher’s qualification was deemed as ‘relevant’ to the subject taught if the subject of their qualification… appeared in the list of JACS [Joint Academic Coding
System] codes in the Department’s subject mapping.”29 Under this, a
qualification in pre-clinical medicine is deemed relevant to biology, a qualification in metallurgy to design and technology, and so forth. Some study subjects are relevant to more than one taught subject.30
In this brief, this DfE mapping document has been followed. However, differences in how data has been collected by the DfE and the other research organisations cited here, as well as its analysis, means that data are not strictly comparable between them. While this means that precise trends cannot be compared between graphs, each graph is internally consistent. Further detail on the exact data in each graph is presented in-text.
Data sources
Since 2010, the DfE have been collecting data on the school workforce in England through the School Workforce Census. This provides statistics including teacher numbers, teachers’ salaries, qualifications and absence levels. These are disaggregated by various characteristics, including teachers’ age,
gender and ethnicity. It also tracks the relevance of teachers’ qualifications by subject, using the aforementioned mapping document.
On three occasions a year, the NFER conduct a Teacher Voice Omnibus Survey. The Sutton Trust submitted questions on the theme of teachers’ post-A level qualifications in February, 2015 (n=1,478) and this data is used for this report. For this survey, teachers volunteer to sit on a panel, but are unaware of the questions to be asked. It is ensured that teachers consulted are reflective of the teacher population as a whole, with a representative spread of school types, locations and student cohorts entitled to Free Schools Meals.
Data for the independent sectors is drawn from the 2015 ISC-administered survey of the independent sector, with the ISC’s kind permission. All 1,267 schools holding UK membership of the constituent associations of the ISC were contacted, with responses collected over a period of two months. While this ensures that a high number of responses are received, it also means that
respondents are self-selecting.
Sutton Trust recommendations
1. Further efforts need to be made to ensure that state school teachers have qualifications in the subjects they are teaching.
Evidence, including the Sutton Trust’s report What Makes Great Teaching, shows that the most effective teachers have deep subject knowledge. In the independent sector a higher proportion of teachers have relevant qualifications than in the state; these teachers are also more likely to possess qualifications of a higher academic level.
2. Incentives to address science teaching shortages should be targeted at schools in less advantaged areas.
Schemes like Teach First and Brilliant Club have contributed to teachers with high levels of subject knowledge teaching in disadvantaged areas. To consolidate this, the Government should do more to target teaching incentives in these areas, perhaps trialling this approach in their new Opportunity Areas.
3. In schools with shortages of physics teachers or none at all, local authorities or Multi Academy Trusts (MATs) should encourage teachers from other schools to offer continuous professional development (CPD) courses.
ENDNOTES
1. SCORE. (2011). Subject specialist teaching in the sciences: Definitions, targets and data. London: SCORE.
2 Prime Minister’s Office. (2015, March 11). Major push to get more maths and physics teachers into our classrooms. Retrieved September 8, 2016, from https://www.gov.uk/government/news/major-push-to-get-more-maths-and-physics-teachers-into-our-classrooms.
3 Bawden, A. (2015, September 15). ‘There are just not enough teachers’: Sciences struggle to recruit. The Guardian. Retrieved November 10, 2015, from http://www.theguardian.com/education/2015/sep/15/not-enough-teachers-science-shortage-teaching-jobs; DfE. (2015, July 2). Statistical first release: School workforce in England: November 2014. Retrieved November 10, 2015, from https://www.gov.uk/government/uploads/system/uploads/attachment_data/file/440577/Text_SFR21-2015.pdf.
4 Allen, T. (2015). School sixth forms with no entries for A-level physics: A data report. London: Institute of Physics.
5 SCORE (2011).
6 Education Datalab (2015). Seven things you might not know about our schools. London:Education Datalab.
DfE (2016a). Specialist and non-specialist’ teaching in England: Extent and impact on pupil outcomes. London: Department for Education.
7 Smithers, A., & Robins, P. (2005). Physics in schools and colleges: Teacher deployment and student outcomes. Buckingham: Carmichael Press.
Cawood, K. (2015). The impact of a teacher's degree on their pupils' attainment: an econometric analysis of National Pupil Database and School Workforce Census data in the UK. cited in DfE (2016a).
8 Coe, R. Aloisi, C., Higgins, S., and Elliot Major, L. (2014). What makes great teaching? Review of the underpinning research. London: Sutton Trust.
Hill, H.C., Rowan, B., and Ball, D.L. (2005). Effect of Teachers’ Mathematical Knowledge for Teaching on Student Achievement. American Educational Research Journal, 42:2, pp371-406.
9 Department for Education and Skills. (2003). Subject specialism: Consultation document. London: Department for Education and Skills, p. 3; re. physics teachers, see: Smithers, A., & Robins, P. (2005), p. I;
re. post-16 study, see: Institute of Physics. (2010). Physics and: Teacher numbers – Briefing note. London: Institute of Physics.
10 Relevant’ subjects include qualifications in the subject itself, but also related subjects as defined by the DfE mapping document (see Annex).
11 Education Datalab (2016). Teachers with a physics degree may improve entry rates to GCSE Physics, but don’t appear to affect attainment. Retrieved December 22, 2016, from http://educationdatalab.org.uk/2015/03/teachers-with-a-physics-degree-may-improve-entry-rates-to-gcse-physics-but-dont-appear-to-affect-attainment/
12 Kirby, P. (2016). Leading people 2016: The educational backgrounds of the UK professional elite. London: Sutton Trust.
13 Prime Minister’s Office (2015).
14 For analysis of the primary sector, see: Wellcome Trust. (2014). Primary science: Is it missing out? Recommendations for revising primary science. London: Wellcome Trust.
15 DfE. (2016b). Tables: SFR21/2016. Retrieved October 10, 2016, from https://www.gov.uk/government/uploads/system/uploads/ attachment_data/file/533530/SFR21_2016_Tables.xlsx, Table 11.
16 TES (2017). Teacher training numbers plummet for shortage subjects. Retrieved January 5, 2017 from https://www.tes.com/news/ school-news/breaking-news/teacher-training-numbers-plummet-shortage-subjects
17 DfE (2016c). Initial teacher training: trainee number census. Tables: SFR57/2016. Retrieved December 22, 2016, from https://www. gov.uk/government/statistics/initial-teacher-training-trainee-number-census-2016-to-2017
For previous years see SFR46/2015, SFR48/2014, SFR32/2013 and Trainee Number census-2012 to 2013.
18 UCAS. (2015). UCAS teacher training 2015 end of cycle report data tables. Retrieved October 10, 2016, from https://www.ucas. com/file/68761/download?token=6qBESeDj, Figure 75.
20 SCORE & University of Cumbria. (2010). Report to SCORE – Science teacher education: Special focus on biology. London: SCORE.
21 DfE (2016b). Tables: SFR21/2016.
22 HESA. (2015). HE qualifications obtained by subject of study, level of qualification and class of first degree (Table 16). Retrieved September 7, 2016, from https://www.hesa.ac.uk/file/4096/download?token=fl_oVnFk.
23 SCORE (2011). p. 9.
24 DfE. (2015, November 2). Tables: SFR46/2015. Retrieved October 10, 2016, from https://www.gov.uk/government/uploads/ system/uploads/attachment_data/file/477891/Main_tables_SFR_46_2015_to_2016.xls, Table 2.
25 NFER. (2015, February). Data from Teacher Voice Omnibus Survey.
26 Freedom of Information Request, Department for Education, 2016
27 Allen, R. (2016). Changing the Subject. London: Sutton Trust.
28 DfE. (2015, July 2). Main tables: SFR21/2015: Table 10. Retrieved November 10, 2015, from https://www.gov.uk/government/ uploads/system/uploads/attachment_data/file/440718/Main_tables_SFR21_2015.xlsx.
29 DfE (2010). A profile of teachers in England from the 2010 School Workforce Census. London: DfE. p.8.