Working Paper
A survey of childcare and
work decisions among
Department for Work and Pensions
Working paper No 114
A survey of childcare and
work decisions among families
with children
Ingun Borg and Andrew Stocks
© Crown copyright 2013.
You may re-use this information (not including logos) free of charge in any format or medium, under the terms of the Open Government Licence.
To view this licence, visit http://www.nationalarchives.gov.uk/doc/open-government-licence/ or write to the Information Policy Team, The National Archives, Kew, London TW9 4DU, or email: psi@nationalarchives.gsi.gov.uk.
This document/publication is also available on our website at: http://research.dwp.gov.uk/asd/asd5/rrs-index.asp
Any enquiries regarding this document/publication should be sent to us at:
Central Analysis Division, Department for Work and Pensions, Upper Ground Floor, Steel City House, West Street, Sheffield, S1 2GQ
Specific enquiries on civil society and volunteering policy should be directed to the Cabinet Office at: servicedesk@cabinet-office.gsi.gov.uk or by post to: Service Desk, Cabinet Office, Roseberry Court, St Andrews Business Park, Norwich, Norfolk, NR7 0HS
First published 2013.
ISBN 978 1 909532 13 7
iii
Contents
Contents
Acknowledgements ... iv
The Authors ...v
List of abbreviations... vi
1 Introduction ...1
2 Research objectives ...2
3 Research design ...3
3.1 Timing of survey ...3
3.2 Sample composition ...3
3.3 Respondent characteristics ...3
3.4 Comparability with other survey results ...4
4 Key findings ...5
4.1 Use of childcare to work ...5
4.2 Reasons for childcare arrangements ...5
4.3 Cost of childcare ...5
4.4 Working more – solution to parent’s childcare cost? ...5
4.5 Willingness to use childcare to increase hours worked ...6
4.6 How should Government provide childcare support for families with children? ...6
5 Response tables ...7
iv
Acknowledgements
Acknowledgements
v
The Authors
The Authors
vi
List of abbreviations
DfE Department for Education
DWP Department for Work and Pensions
FT Full-time
PT Part-time
1
Introduction
1 Introduction
In November 2012 the Department for Work and Pensions (DWP) commissioned GfK NOP Social Research to undertake a survey of adults with children under 16 years old to gain insight into the relationship between the type of childcare used by different families and their work patterns. The survey aimed to address a gap in the existing evidence base and so support the broader evidence gathering process of the work of the Government’s childcare commission1.
2
2 Research objectives
The key objectives of the survey were to investigate the:• childcare arrangements that different types of families use to allow them to work, including formal, informal and a mixture of childcare types, and how this differs by the age and size of their family and work patterns2;
• reasons why different families use certain types of childcare provision, and how this differs by the age of children in different families and affects the work decisions of parents;
• affordability of childcare for different family types, and preferences over how they would like to pay for childcare services;
• role of accessible and affordable childcare in supporting parents to enter work or increase their hours, including existing government support for childcare;
• type of further childcare support parents might value most.
2 Examples of informal and formal childcare were provided on the survey questionnaire (see Chapter 6).
3
Research design
3 Research design
The research was carried out through an online survey using members of an established online panel. A questionnaire consisting of 24 closed questions was prepared by DWP with input and advice from GfK NOP3. The online questionnaire was programmed and tested by GfK NOP and signed off by a project executive before being sent out to panellists.
3.1
Timing of survey
The initial round of fieldwork began on 9 November 2012. In total 1,000 parents took part in this round. In order to boost the total sample a second round of fieldwork was commissioned beginning 16 November 2012 with a further 689 parents participating. The combined total sample consisted of 1,689 respondents.
3.2
Sample composition
Survey invites were sent out via email to all ‘active’ panellists with children4. Invites contained a unique link which panellists clicked on to access the survey online. This ensured panellists could only complete the survey once. In total 18,276 invites were issued.
The demographic profile of the achieved sample was controlled by the use of quotas on gender, working status and age of child. The quotas were constructed to achieve a broadly representative sample of families with children in the UK, across these variables. Controls were not able to be used for other characteristics that might be connected with families childcare and work decisions.
3.3
Respondent characteristics
Some of the key characteristics of the respondents are outlined below.
• Almost half (48%) of families had one child, 38 per cent had two children and 15 per cent had three or more children.
• A third (33%) of households in the survey had a youngest child under five years old, almost half (47%) had a youngest child between 5-12 years old, and 20 per cent had a youngest child aged 13 years or older.
• A majority of respondents were in two parent families – 84 per cent were married or co-habiting whilst 16 per cent were lone parents.
• Just over a quarter (26%) of households had one full-time and one part-time worker, 23 per cent had a single full-time worker and one not working, 19 per cent had two full-time earners, five per cent had two part-time workers, five per cent had one part-time worker with one not working and in six per cent of households both adults were out of work5.
3 See Chapter 6.
4 ‘Active’ panellists are defined as people who have participated in a survey in the last six months.
4
When reading the tables, one should be particularly careful interpreting the results for certain family types due to small sample sizes, such as lone parents and families with both adults unemployed. Caution, in particular, is advised interpreting the results for family types where there are less than 100 respondents.
3.4
Comparability with other survey results
A key aim of the survey was to gain insight into how childcare and work decisions interact for different types of families. In this respect it differs from many other surveys on the provision and use of childcare, for example the Department for Education (DfE) Childcare and Early Years survey of parents6, which do not focus solely on childcare for work purposes. Differences in the results between this and similar surveys may also arise due to differences in survey methodology and design. Although care was taken to explain ‘childcare’ and other terms used in the questionnaire, and to control the sample for certain population characteristics, the results should be interpreted in light of the specific questions asked, the survey’s on-line format and respondents’ characteristics.
6 DfE. (2012). Childcare and Early Years Survey of Parents 2010. OSR12-2012:
http://www.education.gov.uk/rsgateway/DB/STR/d001073/index.shtml
The 2011 version of the survey will be published on 31 January 2013 available from: http://www.education.gov.uk/researchandstatistics/statistics
5
Key findings
4 Key findings
The following section outlines some of the key results from the survey. The full results tables can be found in Chapter 5.
4.1
Use of childcare to work
• Just over half of respondents (55%) said they used childcare for work purposes.
• Use was greatest where both parents worked full-time (78%), followed by families where both work part-time (72%), and where one worked full-time and one part-time (68%).
• There appeared to be little difference in the use of childcare by whether the parents were married/ cohabitating or a lone parent.
• The use of childcare increased with household income, with formal childcare arrangements (either on its own or supplementing informal care) being used more as income and household working hours increased.
4.2
Reasons for childcare arrangements
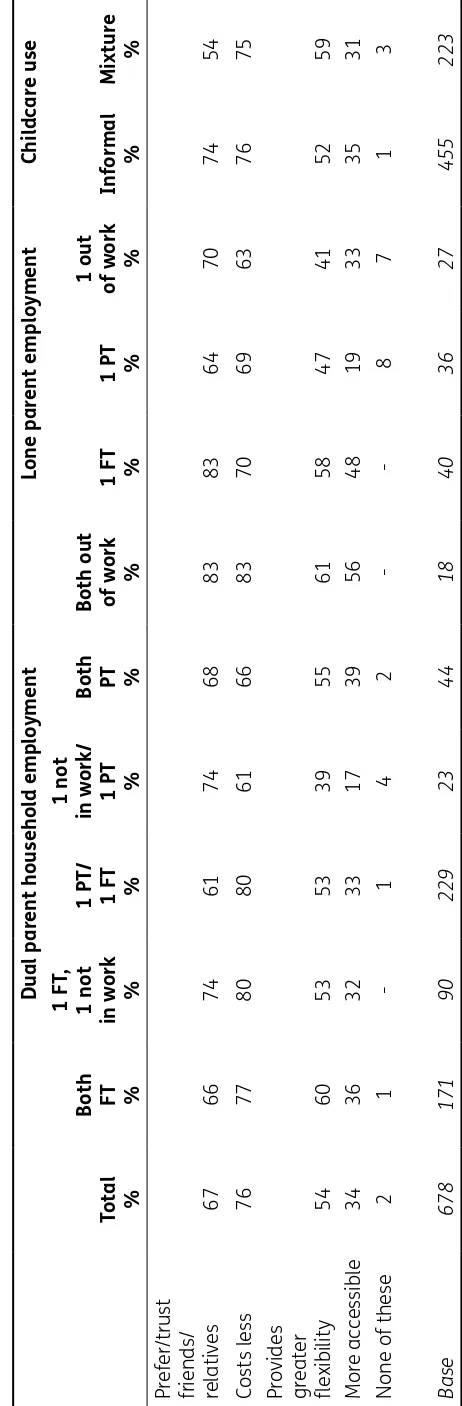
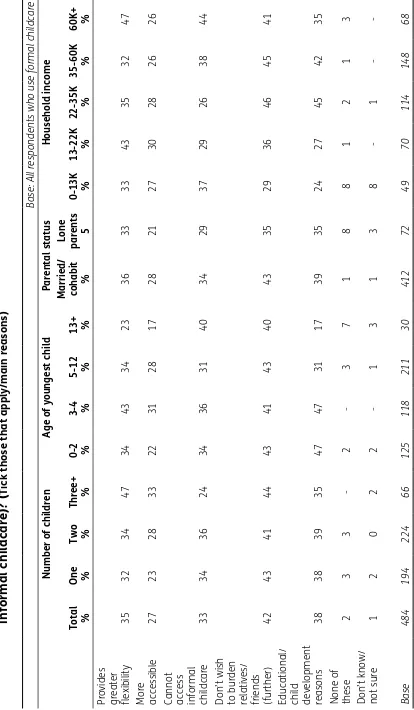
• The biggest reasons for using informal childcare were cost (76%), prefer or trust friends/relatives (67%) and the flexibility informal childcare can provide (54%).
• Not wishing to burden friends or relatives (42%) was the main reason given for using formal childcare, followed by educational reasons (38%), flexibility (35%) and having no access to informal childcare (33%).
4.3
Cost of childcare
• More than twice as many parents that used childcare for work purposes reported difficulty meeting the cost (48%) than those who reported they found it easy or very easy (21%).
4.4
Working more – solution to parent’s childcare cost?
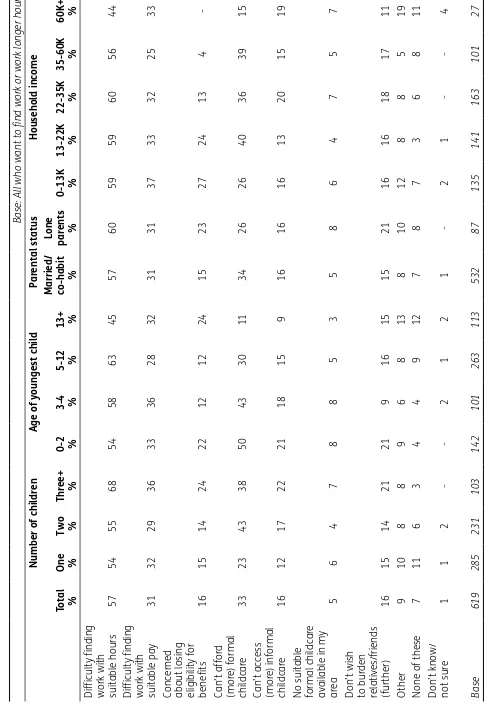
• Amongst families where one or both parents were not already working full-time, 49 per cent said they wanted to find work or work longer hours. This was most common amongst lower income families, with 62 per cent of those earning less than £13,000 a year wanting to increase their hours, and 58 per cent of those earning between £13,000 and £22,000 a year.
• Amongst families reporting that they wanted to work more, the most common reason for not doing so was difficulty finding work with suitable hours (57%), followed by not being able to afford formal childcare (33%) and difficulty finding work with suitable pay (31%). Sixteen per cent said they were not able to access more informal childcare, while five per cent pointed to a lack of suitable formal childcare in the area.
6
Key findings
4.5
Willingness to use childcare to increase hours worked
• In households with one or more parent not working full-time 29 per cent said they were likely to pay for more childcare to enable them to start work or increase their hours if they were paid enough to cover their additional childcare costs.
• Amongst the same households, willingness to use more childcare to enable more work was higher at 48 per cent if the Government were to cover the extra childcare costs.
• Willingness to use more formal childcare to increase hours worked if Government covered the extra cost of childcare was higher in:
– households already using formal childcare (70 per cent);
– couple households where they are attached to the labour market and in some form of employment, for example in 55 per cent of households with one full-time and one part-time parent.
• This willingness appears to increase with household income up to those earning 35-60k per year, of which 54 per cent said they would be willing to use more formal childcare as a means to increase their hours of work if the Government covered the extra cost of childcare
4.6
How should Government provide childcare support for
families with children?
• To help inform future policy development, families were asked a hypothetical question relating to the financial support for childcare they would find most useful. Twelve per cent of respondents thought the Government should not provide any support to help parents meet the cost of childcare. • Amongst those that thought Government should, a slight majority favoured support that families
7
5
Response t
ables
Table 5.1
What type of childc
ar
e, if an
y, do y
ou curr
en
tly use to allo
w y
ou to w
ork? (
Tick the option which applies)
Base: All r
esponden
ts
Number of childr
en
Age of y
oungest child
Par
en
tal st
atus
Household income
Tot
al
%
One %
Tw
o
%
Thr
ee+ % 0-2 % 3-4 % 5-12 % 13+ % Married/ cohabit
%
Lone paren
t
%
0-13K % 13-22K % 22-35K % 35-60K % 60K+ %
Inf
ormal
[image:14.595.79.401.88.795.2]arr
angemen
ts,
e.g. r
elativ
es and
friends
27
27
27
28
30
17
29
24
27
28
22
30
28
27
22
Formal
childc
ar
e,
e.g. childminder, nursery
15
13
18
17
21
35
13
2
15
16
11
16
13
19
27
A mixtur
e
of inf
ormal
and f
ormal
arr
angemen
ts
13
11
17
10
15
19
13
7
14
11
9
8
14
17
16
I/W
e don’t use
childc
ar
e
44
49
38
45
33
28
44
68
44
45
58
46
45
37
35
Base
1,689
803
641
245
341
218
794
336
1,426
263
244
292
425
410
158
8
Table 5.1
Con
tinued
Dual par
en
t household emplo
ymen
t
Lone par
en
t emplo
ymen
t
Tot
al % Both FT % 1 FT/ 1 not in work % 1 PT/ 1 FT % 1 not in work/ 1 PT % Both PT % Both out of w
ork % 1 FT % 1 PT % 1 out of work %
[image:15.595.74.272.82.789.2]Inf
ormal arr
angemen
ts,
e.g. r
elativ
es and f
riends
27
29
19
34
22
34
15
26
39
22
Formal childc
ar
e,
e.g. childminder, nursery
15
26
8
16
14
22
3
26
16
6
A mixtur
e of inf
ormal and
formal arr
angemen
ts
13
23
5
18
5
16
3
16
13
6
I/W
e don’t use childc
ar
e
44
22
69
32
60
28
78
32
33
66
Base
1,689
326
385
444
87
87
97
96
70
97
9
Table 5.2
Which, if an
y, of the f
ollo
wing ar
e r
easons wh
y y
ou use inf
ormal childc
ar
e (r
ather than f
ormal
childc
ar
e)? (
Tick those that apply/main r
easons)
Base: All who use inf
ormal childc
ar
e
Number of childr
en
Age of y
oungest child
Par
en
tal st
atus
Household income
Tot
al
%
One %
Tw
o
%
Thr
ee+ % 0-2 % 3-4 % 5-12 % 13+ % Married/ cohabit
%
Lone paren
t
%
0-13K % 13-22K % 22-35K % 35-60K % 60K+ %
Pr
ef
er/trust
friends/ relativ
es
67
68
65
71
73
65
65
70
66
73
62
67
72
65
70
Costs less
76
76
74
83
81
78
73
76
78
68
71
74
81
79
74
Pr
ovides
gr
eat
er
flexibility
54
51
56
59
60
54
51
56
55
50
49
49
57
59
61
Mor
e accessible
34
35
32
35
38
31
32
37
34
34
36
30
37
32
31
None of these
2
2
2
-
1
-
3
1
1
5
3
2
-
1
2
Base
678
304
281
93
156
80
341
101
575
103
76
111
178
180
61
10
Table 5.2
Con
tinued
Dual par
en
t household emplo
ymen
t
Lone par
en
t emplo
ymen
t
Childc
ar
e use
Tot
al % Both FT % 1 FT, 1 not in work % 1 PT/ 1 FT % 1 not in work/ 1 PT % Both PT % Both out of w
ork % 1 FT % 1 PT % 1 out of w
ork %
Inf
ormal %
Mixtur
e
%
Pr
ef
er/trust
friends/ relativ
es
67
66
74
61
74
68
83
83
64
70
74
54
Costs less
76
77
80
80
61
66
83
70
69
63
76
75
Pr
ovides
gr
eat
er
flexibility
54
60
53
53
39
55
61
58
47
41
52
59
Mor
e
accessible
34
36
32
33
17
39
56
48
19
33
35
31
None of these
2
1
-
1
4
2
-
-
8
7
1
3
Base
678
171
90
229
23
44
18
40
36
27
455
223
11
Table 5.3
Which, if an
y, of the f
ollo
wing ar
e r
easons wh
y y
ou use f
ormal childc
ar
e (r
ather than or along with
inf
ormal childc
ar
e)? (
Tick those that apply/main r
easons)
Base: All r
esponden
ts who use f
ormal childc
ar
e
Number of childr
en
Age of y
oungest child Par en tal st atus Household income Tot al % One % Tw o % Thr ee+ % 0-2 % 3-4 % 5-12 % 13+ % Married/ cohabit %
Lone paren
ts 5 0-13K % 13-22K % 22-35K % 35-60K % 60K+ % Pr ovides gr eat er flexibility 35 32 34 47 34 43 34 23 36 33 33 43 35 32 47 Mor e accessible 27 23 28 33 22 31 28 17 28 21 27 30 28 26 26
Cannot access informal childc
ar e 33 34 36 24 34 36 31 40 34 29 37 29 26 38 44
Don’t wish to bur
den
relativ
es/
friends (further)
42 43 41 44 43 41 43 40 43 35 29 36 46 45 41 Educ ational/
child developmen
t reasons 38 38 39 35 47 47 31 17 39 35 24 27 45 42 35
None of these
12
Table 5.3
Con
tinued
Dual par
en
t household emplo
ymen
t
Lone par
en
t emplo
ymen
t
Childc
ar
e use
Tot
al
%
Both FT % 1 FT, 1 not in work % 1 PT/ 1 FT % 1 not in work/ 1 PT % Both PT % Both out of w
ork % 1 FT % 1 PT % 1 out of work % Formal %
Mixtur
e
%
Pr
ovides
gr
eat
er
flexibility
35
41
34
29
50
45
-
43
25
17
46
23
Mor
e
accessible
27
31
23
25
13
42
17
25
15
17
33
20
Cannot access informal childc
ar
e
33
36
23
36
50
30
-
23
40
33
42
23
Don’t wish to bur
den
relativ
es/
friends (further)
42
45
40
46
19
39
50
30
40
42
34
52
Educ
ational/
child developmen
t
reasons
38
36
53
38
38
33
33
38
30
33
35
41
None of these
2
3
-
1
-
3
-
8
10
8
2
4
Don’t kno
w/
not sur
e
1
-
2
1
-
-
17
3
5
-
0
2
Base
484
160
47
150
16
33
6
40
20
12
261
223
13
Table 5.4
Ho
w easy or difficult do y
ou find it to meet the cost of childc
ar
e? (
Tick on option)
Base: All who use childc
ar
e
Number of childr
en
Age of y
oungest child Par en tal st atus Household income Tot al % One % Tw o % Thr ee+ % 0-2 % 3-4 % 5-12 % 13+ % Married/ co-habit
%
Lone paren
ts % 0-13K % 13-22K % 22-35K % 35-60K % 60K+ % Very easy 10 9 11 13 9 13 10 12 11 7 16 11 10 9 12 Easy 11 13 11 9 10 10 12 12 11 11 9 8 12 13 17
Neither easy nor difficult
30 31 30 28 26 33 33 28 30 32 22 31 28 29 37 Difficult 32 31 33 34 36 31 30 34 32 30 30 31 33 37 24 Very difficult 16 16 15 16 19 13 16 15 15 20 23 18 18 11 11 Base 939 407 398 134 229 156 445 109 794 145 103 157 233 258 103 Dual par en
t household emplo
ymen t Lone par en t emplo ymen t Childc ar e use Tot al % Both FT % 1 FT, 1 not in work 1 PT/ 1 FT % 1 not in work/ 1 PT % Both PT % Both out of w
ork % 1 FT % 1 PT % 1 out of w
ork % Inf ormal % Formal % Mixtur e % Very easy 10 11 12 9 17 14 10 11 4 3 14 7 7 Easy 11 12 8 11 11 19 5 12 13 6 9 14 11
Neither easy nor difficult
14
Table 5.5
Do y
ou or y
our par
tner w
an
t to find w
ork or w
ork longer hours? (
Tick one option)
Base: All who w
ork f
ew
er than 35 hours per w
eek or whose partner w
orks less than 35 hours per w
eek
Number of childr
en
Age of y
oungest child
Par
en
tal st
atus
Household income
Tot
al
%
One %
Tw
o
%
Thr
ee+ % 0-2 % 3-4 % 5-12 % 13+ % Married/ co-habit
%
Lone paren
ts
%
0-13K % 13-22K % 22-35K % 35-60K % 60K+ %
Yes
49
50
47
51
54
60
45
45
48
52
62
58
49
38
36
No
51
50
53
49
46
40
55
55
52
48
38
42
51
62
64
Base
1,267
575
491
201
264
167
586
250
1,100
167
218
242
334
266
76
Dual par
en
t household emplo
ymen
t
Lone par
en
t emplo
ymen
t
Childc
ar
e use
Tot
al
%
Both FT % 1 FT, 1 not in w
ork % 1 PT/ 1 FT % 1 not in work/ 1 PT % Both PT % Both out of work % 1 FT % 1 PT % 1 out of w
ork %
Inf
ormal % Formal %
Mixtur
e
%
None %
Yes
49
-
48
43
56
59
59
-
43
59
54
57
52
43
No
51
-
52
57
44
41
41
-
57
41
46
43
48
57
Base
1,267
0
385
444
87
87
97
0
70
97
335
152
132
648
15
Table 5.6
Wh
y do y
ou/y
our par
tner not curr
en
tly w
ork or w
ork par
t time? (
Tick those that apply/main r
easons)
Base: All who w
an
t to find w
ork or w
ork longer hours
Number of childr
en
Age of y
oungest child Par en tal st atus Household income Tot al % One % Tw o % Thr ee+ % 0-2 % 3-4 % 5-12 % 13+ % Married/ co-habit
%
Lone paren
[image:22.595.67.554.89.793.2]ts % 0-13K % 13-22K % 22-35K % 35-60K % 60K+ %
Difficulty finding work with suit
able hours 57 54 55 68 54 58 63 45 57 60 59 59 60 56 44
Difficulty finding work with suit
able pa y 31 32 29 36 33 36 28 32 31 31 37 33 32 25 33
Concerned about losing eligibility f
or benefits 16 15 14 24 22 12 12 24 15 23 27 24 13 4 - Can’t aff or d (mor e) f ormal childc ar e 33 23 43 38 50 43 30 11 34 26 26 40 36 39 15
Can’t access (mor
e) inf ormal childc ar e 16 12 17 22 21 18 15 9 16 16 16 13 20 15 19 No suit able formal childc ar e av
ailable in m
y ar ea 5 6 4 7 8 8 5 3 5 8 6 4 7 5 7
Don’t wish to bur
den relativ es/f riends (further) 16 15 14 21 21 9 16 15 15 21 16 16 18 17 11 Other 9 10 8 8 9 6 8 13 8 10 12 8 8 5 19
None of these
16
Table 5.6
Con
tinued
Dual par ent household emplo
ymen t Lone par en t emplo ymen t Childc ar e use Tot al % Both FT % 1 FT, 1 not in work % 1 PT/ 1 FT % 1 not in work/ 1 PT % Both PT % Both out of work % 1 FT % 1 PT % 1 out of work %
[image:23.595.72.546.73.803.2]Inf ormal % Formal % Mixtur e % None %
Difficulty finding work with suit
able hours 57 - 63 55 53 49 51 - 57 61 58 54 59 57
Difficulty finding work with suit
able pa y 31 - 24 26 39 47 51 - 17 39 29 37 43 28
Concerned about losing eligibility f
or benefits 16 - 14 7 22 27 32 - 13 28 19 13 19 15 Can’t aff or d (mor e) f ormal childc ar e 33 - 35 39 27 33 19 - 33 23 35 40 52 25
Can’t access (mor
e) inf ormal childc ar e 16 - 19 19 8 10 7 - 13 18 13 14 30 15 No suit able formal childc ar e av
ailable in m
y ar ea 5 - 7 5 6 6 - - 10 7 5 10 6 4
Don’t wish to bur
den relativ es/f riends (further) 16 - 15 18 10 12 16 - 30 16 26 9 22 10 Other 9 - 10 3 12 4 23 - 3 14 5 5 3 14
None of these
17
Table 5.7
W
ould y
ou/y
our par
tner be willing to pa
y f
or mor
e childc
ar
e to enable y
ou to st
ar
t w
ork or incr
ease
your hours if y
ou could find w
ork which paid enough to co
ver y
our additional childc
ar
e cost?
(
Tick one option)
Base: All who do not ha
ve tw
o f
ull-time w
ork
ers in the household
Number of childr
en
Age of y
oungest child Par en tal st atus Household income Tot al % One % Tw o % Thr ee+ % 0-2 % 3-4 % 5-12 % 13+ % Married/ co-habit
%
Lone paren
ts % 0-13K % 13-22K % 22-35K % 35-60K % 60K+ % Very lik ely to pa y f or mor e childc ar e 10 9 9 14 12 14 10 5 10 8 9 11 12 10 8 Lik
ely to pa
18
Table 5.7
Con
tinued
Dual par
en
t household emplo
ymen
t
Lone par
en
t emplo
ymen
t
Childc
ar
e use
Tot
al % Both FT % 1 FT, 1 not in work % 1 PT/ 1 FT % 1 not in work/ 1 PT % Both PT % Both out of work % 1 FT % 1 PT % 1 out of w
ork %
Inf
ormal % Formal %
Mixtur
e
%
[image:25.595.71.373.74.794.2]None %
Very lik
ely to
pa
y f
or mor
e
childc
ar
e
10
-
10
10
11
15
5
-
9
7
13
13
17
6
Lik
ely to pa
y f
or
mor
e childc
ar
e
19
-
19
20
16
24
13
-
19
21
20
34
33
12
Neither lik
ely
nor unlik
ely to
pa
y f
or mor
e
childc
ar
e
27
-
24
29
18
26
33
-
29
27
28
22
31
26
Unlik
ely to
pa
y f
or mor
e
childc
ar
e
13
-
12
16
14
11
9
-
10
6
16
18
9
10
Very unlik
ely to
pa
y f
or mor
e
childc
ar
e
31
-
35
24
40
23
39
-
34
39
22
12
10
45
Base
1,267
0
385
444
87
87
97
0
70
97
335
152
132
648
19
Table 5.8
Ho
w easy or difficult do y
ou think it w
ould be f
or y
ou or y
our par
tner to find suit
able w
ork which paid
enough to co
ver the extr
a cost of childc
ar
e? (
Tick one option)
Base: All who do not ha
ve tw
o f
ull-time w
ork
ers in the household
Number of childr
en
Age of y
oungest child Par en tal st atus Household income Tot al % One % Tw o % Thr ee+ % 0-2 % 3-4 % 5-12 % 13+ % Married/ co-habit
%
Lone paren
ts % 0-13K % 13-22K % 22-35K % 35-60K % 60K+ % Very easy 4 5 2 2 2 5 4 4 4 1 3 4 2 5 12 Easy 7 7 7 8 8 8 7 5 7 7 6 5 7 8 17
Neither easy nor difficult
22 22 25 15 21 25 23 22 23 18 24 19 21 21 25 Difficult 33 34 33 30 32 31 33 35 33 35 28 31 34 40 30 Very difficult 34 32 33 44 37 31 34 34 33 39 39 41 37 26 16 Base 1,267 575 491 201 264 167 586 250 1,100 167 218 242 334 266 76 Dual par en
t household emplo
ymen t Lone par en t emplo ymen t Childc ar e use Tot al %
Both FT % 1 FT, 1 not in w
ork % 1 PT/ 1 FT % 1 not in work/ 1 PT % Both PT % Both out of work % 1 FT % 1 PT % 1 out of w
ork % Inf ormal % Formal % Mixtur e % None % Very easy 4 - 3 3 6 10 1 - 1 1 5 4 4 3 Easy 7 - 4 10 6 14 2 - 9 5 7 16 10 4
Neither easy nor difficult
20
Table 5.9
Ho
w lik
ely w
ould y
ou and y
our par
tner be to use mor
e childc
ar
e to enable y
ou to st
ar
t w
ork or incr
ease
your hours if the additional cost of childc
ar
e w
as co
ver
ed b
y the Go
vernmen
t? (
Tick one option)
Base: All who do not ha
ve tw
o f
ull-time w
ork
ers in the household
Number of childr
en
Age of y
oungest child Par en tal st atus Household income Tot al % One % Tw o % Thr ee+ % 0-2 % 3-4 % 5-12 % 13+ % Married/ co-habit
%
Lone paren
ts % 0-13K % 13-22K % 22-35K % 35-60K % 60K+ % Very lik ely
to use mor
e childc ar e 21 19 22 27 30 31 19 12 21 22 20 23 24 21 22 Lik
ely to use
mor e childc ar e 27 25 29 30 34 31 27 16 28 19 23 26 27 33 25 Neither lik ely nor unlik ely
to use mor
e childc ar e 26 26 28 20 22 25 27 28 25 31 28 28 24 21 29 Unlik
ely to use
mor e childc ar e 7 8 6 6 5 5 8 10 7 9 6 5 6 9 9 Very unlik ely
to use mor
21
Table 5.9
Con
tinued
Dual par
en
t household emplo
ymen
t
Lone par
en
t emplo
ymen
t
Childc
ar
e use
Tot
al
%
Both FT % 1 FT, 1 not in w
ork % 1 PT/ 1 FT % 1 not in work/ 1 PT % Both PT % Both out of work % 1 FT % 1 PT % 1 out of w
ork %
Inf
ormal % Formal %
Mixtur
e
%
None %
Very lik
ely
to use mor
e
childc
ar
e
21
-
23
23
18
18
10
-
21
22
27
33
30
14
Lik
ely to use
mor
e childc
ar
e
27
-
26
32
24
31
22
-
21
18
31
37
42
19
Neither lik
ely
nor unlik
ely
to use mor
e
childc
ar
e
26
-
26
23
26
29
31
-
30
32
22
21
22
30
Unlik
ely to use
mor
e childc
ar
e
7
-
5
9
7
5
6
-
13
6
8
5
4
8
Very unlik
ely
to use mor
e
childc
ar
e
19
-
20
14
24
17
31
-
14
23
11
5
2
29
Base
1,267
0
385
444
87
87
97
0
70
97
335
152
132
648
22
Table 5.10
Wh
y do y
ou/y
our par
tner not w
an
t to w
ork or incr
ease y
our hours? (
Tick those that apply/main r
easons)
Base: All who do not w
an
t to find w
ork or w
ork longer hours
Number of childr
en
Age of y
oungest child Par en tal st atus Household income Tot al % One % Tw o % Thr ee+ % 0-2 % 3-4 % 5-12 % 13+ % Married/ co-habit
%
Lone paren
ts % 0-13K % 13-22K % 22-35K % 35-60K % 60K+ %
No need – w
e
manage on the mone
y w e ha ve 39 43 38 33 34 41 40 43 42 18 16 30 43 47 67
Difficulty finding work with suit
able hours 24 20 27 30 31 29 23 18 24 26 29 31 19 27 4
Difficulty finding work with suit
able pa y 19 19 16 26 20 18 20 16 18 26 19 26 16 21 10
Concerned about losing eligibility f
or benefits 7 6 7 10 13 6 6 5 6 16 20 13 5 1 2 Can’t aff or d (mor e) formal childc ar e 18 14 21 23 31 26 17 7 18 21 20 15 18 22 8
Can’t access (mor
e) inf ormal childc ar e 6 5 8 7 9 9 6 4 6 8 4 7 6 9 4 No suit able f ormal childc ar e a vailable in m y ar ea 4 6 3 2 5 - 4 4 3 9 6 5 4 2 2
Don’t wish to bur
den r elativ es/ friends (f urther) 15 17 13 17 21 15 15 12 15 18 16 21 16 16 6 Other 13 12 14 13 16 14 13 12 13 16 14 13 15 12 12
None of these
23
Table 5.10
Con
tinued
Dual par ent household emplo
ymen t Lone par en t emplo ymen t Childc ar e use Tot al % Both FT % 1 FT, 1 not in work % 1 PT/ 1 FT %
1
not
in
w
ork/ 1 PT % Both PT % Both out of work % 1 FT % 1 PT % 1 out of w
ork % Inf ormal % Formal % Mixtur e % None %
No need – w
e
manage on the mone
y w e ha ve 39 - 46 42 45 50 23 - 25 10 40 31 37 41
Difficulty finding work with suit
able hours 24 - 24 24 29 31 8 - 28 25 27 29 27 21
Difficulty finding work with suit
able pa y 19 - 19 19 16 14 5 - 30 23 18 25 17 18
Concerned about losing eligibility f
or benefits 7 - 7 4 3 6 10 - 13 20 10 6 5 6 Can’t aff or d (mor e) formal childc ar e 18 - 20 20 11 14 5 - 20 23 22 32 19 14
Can’t access (mor
e) inf ormal childc ar e 6 - 6 8 5 3 - - 10 5 8 2 11 6 No suit able f ormal childc ar e a vailable in m y ar ea 4 - 3 4 3 - 3 - 8 10 4 - 6 4
Don’t wish to bur
den r elativ es/ friends (f urther) 15 - 16 15 18 14 5 - 23 13 32 3 17 10 Other 13 - 13 11 13 3 28 - 13 20 12 17 11 14
None of these
24
Table 5.11
Do y
ou curr
en
tly r
eceiv
e an
y of the f
ollo
wing? (
Tick those that apply)
Base: All
Number of childr
en
Age of y
oungest child Par en tal st atus Household income Tot al % One % Tw o % Thr ee+ % 0-2 % 3-4 % 5-12 % 13+ % Married/ co-habit
%
Lone paren
ts % 0-13K % 13-22K % 22-35K % 35-60K % 60K+ % Fr ee early educ ation for childr en
aged 3 and 4
9 5 10 15 13 36 3 0 9 5 12 8 8 9 9 Childc ar e elemen t of the W orking Tax Cr edit 18 16 18 26 19 27 18 13 17 25 27 29 17 11 6 Fr ee early educ ation for tw o-y ear-olds 3 2 2 6 6 7 1 1 3 3 5 4 2 1 2 Emplo yer childc ar e vouchers 6 4 9 7 12 12 4 2 7 3 2 2 4 10 17
None of these
25
Table 5.11
Con
tinued
Dual par
en
t household emplo
ymen
t
Lone par
en
t emplo
ymen
t
Childc
ar
e use
Tot
al % Both FT % 1 FT, 1 not in work % 1 PT/ 1 FT % 1 not in work/ 1 PT % Both PT % Both out of work % 1 FT % 1 PT % 1 out of w
ork %
Inf
ormal % Formal %
Mixtur
e
%
None %
Fr
ee early
educ
ation
for childr
en
aged 3 and 4
9
12
7
9
8
18
6
4
4
6
7
23
12
4
Childc
ar
e
elemen
t of
the W
orking
Tax Cr
edit
18
15
16
16
23
30
12
29
37
11
15
30
31
12
Fr
ee early
educ
ation
for tw
o-y
ear-olds
3
2
2
2
2
10
4
-
1
6
4
5
4
1
Emplo
yer
childc
ar
e
vouchers
6
15
3
7
1
2
1
5
3
1
3
20
13
1
None of these
67
63
72
69
68
46
75
65
54
69
71
36
49
81
Don’t kno
w/
not sur
e
3
2
3
2
1
3
5
3
3
8
3
2
3
3
Base
1,689
326
385
444
87
87
97
96
70
97
455
261
223
750
26
Table 5.12
Di
d
yo
u
or
y
ou
r p
ar
tn
er
c
ha
ng
e
th
e
nu
m
be
r o
f h
ou
rs
y
ou
w
or
ke
d
be
ca
us
e
yo
u
re
ce
iv
ed
th
is
e
nt
itl
em
en
t?
(
Tick one option)
Base: All who ha
ve r
eceiv
ed some f
orm or help with their childc
ar
e
Number of childr
en
Age of y
oungest child Par en tal st atus Household income Tot al % One % Tw o % Thr ee+ % 0-2 % 3-4 % 5-12 % 13+ % Married/ co-habit
%
Lone paren
ts % 0-13K % 13-22K % 22-35K % 35-60K % 60K+ % Incr eased hours 16 18 16 15 14 18 17 16 17 13 18 20 13 19 19
No change in hours
81 79 83 82 83 80 81 84 81 83 78 77 85 81 79 Decr eased hours 2 3 1 2 3 3 2 - 2 4 4 3 2 - 2 Base 511 203 211 97 133 137 191 50 428 83 97 116 116 105 43 Dual par en
t household emplo
ymen t Lone par en t emplo ymen t Childc ar e use Tot al %
Both FT % 1 FT, 1 not in w
ork % 1 PT/ 1 FT % 1 not in work/ 1 PT % Both PT % Both out of work % 1 FT % 1 PT % 1 out of w
ork % Inf ormal % Formal % Mixtur e % None % Incr eased hours 16 22 9 16 19 25 16 19 7 14 24 16 21 6
No change in hours
27
Table 5.13
As y
ou ma
y alr
eady kno
w, the Go
vernmen
t w
an
ts to mak
e it easier f
or par
en
ts to st
ar
t w
orking or
incr
ease the hours that the
y w
ork and the
y r
ecognise that finding aff
or
dable childc
ar
e w
ould be
impor
tan
t f
or that to happen. Which of the f
ollo
wing options w
ould be of most use to y
ou?
(
Tick one option)
Base: All
Number of childr
en
Age of y
oungest child Par en tal st atus Household income Tot al % One % Tw o % Thr ee+ % 0-2 % 3-4 % 5-12 % 13+ % Married/ co-habit
%
Lone paren
ts % 0-13K % 13-22K % 22-35K % 35-60K % 60K+ % Dir ec t financial
support in the form of a t
ax or
benefit cr
edit
that f
amilies
could use as the
y wish 42 38 43 50 44 40 41 42 41 44 39 48 41 40 41
Financial support earmark
ed for childc ar e only r edeemed thr ough
nurseries, childminders etc
35 37 36 29 41 44 32 31 35 36 34 34 36 39 40
None of the abo
ve – I
don’t think the Governmen
t
should help par
en
ts meet
the cost of childc
28
Table 5.13
Con
tinued
Dual par
en
t household emplo
ymen
t
Lone par
en
t emplo
ymen
t
Childc
ar
e use
Tot
al
%
Both FT % 1 FT, 1 not in work % 1 PT/ 1 FT % 1 not in work/ 1 PT % Both PT % Both out of work % 1 FT % 1 PT % 1 out of w
ork %
Inf
ormal % Formal %
Mixtur
e
%
None %
Dir
ec
t financial
support in the form
of
a
tax
or
benefit cr
edit
that f
amilies
could use as the
y wish
42
41
40
40
44
47
43
44
51
40
49
36
41
39
Financial support earmark
ed
for childc
ar
e
only r
edeemed
thr
ough
nurseries, childminders etc
35
39
33
38
28
37
23
35
36
36
30
54
45
29
None of the abo
ve – I
don’t think the Governmen
t
should help par
en
ts meet
the cost of childc
ar
e
12
13
12
13
10
9
11
13
7
6
11
7
9
14
Don’t kno
w/not
sur
e
11
6
15
9
18
7
23
8
6
18
9
3
5
17
Base
1,689
326
385
444
87
87
97
96
70
97
455
261
223
750
29
Table 5.14
Ho
w ar
e y
ou char
ged f
or y
our f
ormal childc
ar
e? (
Tick the option that applies)
Base: All r
esponden
ts who use f
ormal childc
ar
e
Number of childr
en
Age of y
oungest child Par en tal st atus Household income Tot al % One % Tw o % Thr ee+ % 0-2 % 3-4 % 5-12 % 13+ % Married/ co-habit
%
Lone paren
ts % 0-13K % 13-22K % 22-35K % 35-60K % 60K+ % Per hour 31 28 33 32 23 31 33 43 30 33 20 27 38 30 34
Per half da
y 13 12 14 17 16 14 12 10 14 13 16 17 11 12 18 Per da y 22 22 20 29 25 21 22 10 23 18 18 33 19 22 18 Per w eek 14 18 13 5 10 14 16 20 13 18 27 9 16 11 12 Per c alendar mon th 16 15 18 14 24 14 15 7 16 17 8 11 12 22 16 Don’t kno w/ not sur e 4 5 2 5 2 6 2 10 4 1 10 3 4 3 3 Base 484 194 224 66 125 118 211 30 412 72 49 70 114 148 68 Dual par en
t household emplo
ymen t Lone par en t emplo ymen t Tot al %
Both FT % 1 FT, 1 not in work % 1 PT/ 1 FT % 1 not in work/ 1 PT % Both PT % Both out of w
ork % 1 FT % 1 PT % 1 out of w
ork % Per hour 31 29 38 31 25 24 17 45 20 17
Per half da
30
Table 5.15
Ho
w w
ould y
ou pr
ef
er to pa
y f
or childc
ar
e? (
Tick the option which applies)
Base: All
Number of childr
en
Age of y
oungest child
Par
en
tal st
atus
Household income
Tot
al % One %
Tw
o
%
Thr
ee+ % 0-2 % 3-4 % 5-12 % 13+ % Married/ co-habit
%
Lone paren
ts
%
0-13K % 13-22K % 22-35K % 35-60K % 60K+ %
Per hour
21
20
23
22
22
25
23
14
21
22
16
23
23
24
25
Per half da
y
8
7
8
9
11
8
7
6
8
8
10
9
7
8
8
Per w
eek
20
20
20
20
19
26
18
20
20
19
22
21
19
20
16
Per c
alendar
mon
th
15
15
16
16
21
14
14
12
16
14
10
12
14
20
23
Not applic
able –
I don’t in
tend
to use f
ormal
childc
ar
e
28
31
26
27
18
17
30
43
28
31
35
31
30
20
26
Don’t kno
w/
not sur
e
7
7
7
6
9
11
7
5
7
6
7
5
7
9
1
Base
1,689
803
641
245
341
218
794
336
1,426
263
244
292
425
410
158
31
Table 5.15
Con
tinued
Dual par
en
t household emplo
ymen
t
Lone par
en
t emplo
ymen
t
Childc
ar
e use
Tot
al
%
Both FT % 1 FT, 1 not in work % 1 PT/ 1 FT % 1 not in work/ 1 PT % Both PT % Both out of work % 1 FT % 1 PT % 1 out of work %
Inf
ormal % Formal %
Mixtur
e
%
None %
Per hour
21
26
20
24
15
20
7
25
26
15
21
28
32
16
Per half da
y
8
7
8
7
8
17
5
5
11
8
10
9
12
5
Per w
eek
20
21
19
20
17
16
21
19
14
24
14
24
27
20
Per c
alendar
mon
th
15
21
15
16
9
16
6
24
9
7
10
26
18
14
Not applic
able –
I don’t in
tend
to use f
ormal
childc
ar
e
28
17
32
25
45
25
49
21
34
38
39
1
0
40
Don’t kno
w/
not sur
e
7
8
6
8
6
6
11
6
6
7
5
12
11
5
Base
1,689
326
385
444
87
87
97
96
70
97
455
261
223
750
32
6 Questionnaire
Childcare and Work Decisions Among Families with Children
Questionnaire
We are conducting a short survey of parents about childcare arrangements on behalf of the Department for Work and Pensions (DWP). Your views are important and will help the government design better policies that meet people’s needs, so we very much hope you will take part. We would really value your opinions.
The survey should take no more than 5 minutes to complete, depending on your answers.
Demographic/Family characteristics
QA – Firstly, are you?Male Female
Q1 – Are there any children under 16 in your household? Yes GO TO Q2
No CLOSE INTERVIEW
Q2 – How many children under 16 are there in your household? One
Two Three Four Five+
Q3 – How old are the children under 16 in your household?
Age of child
0-2 3-4 5-12 13+
Child 1 Child 2 Child 3 Child 4 Child 5
Q5– Are you …?
Married/in a civil partnership Living with partner
Single Widowed Separated Divorced
33
Employment status/Working hours
Q6 – And are you …?Working as an employee Self-employed
Unemployed and seeking work Full time education/training Sick/disabled
Caring for a sick, elderly or disabled person Looking after the home or family
Retired Other
If Working (CODES 1 OR 2 AT Q6)
Q7– How many hours per week do you usually work? 0-10
11-16 17-24 25-34 35+
IF MARRIED/LIVING WITH PARTNER Q8 – Is your partner …?
Working as an employee Self-employed
Unemployed and seeking work Full time education/training Sick/disabled
Caring for a sick, elderly or disabled person Looking after the home or family
Retired Other
IF PARTNER IS WORKING (CODES 1 OR 2 AT Q8)
Q9 – How many hours per week does your partner usually work? 0-10
11-16 17-24 25-34 35+
34
Childcare use
The next section is about childcare that you may use to look after your child(ren). By ‘childcare’ we mean care carried out by anyone other than yourself [or your partner] on a regular basis to allow you to work.
Q10 – What type of childcare, if any, do you currently use to allow you to work? Informal arrangements e.g. relatives and friends
Formal childcare e.g. childminder, nursery, before or after school club A mixture of informal and formal arrangements
I/We don’t use childcare
ASK ALL WHO MAKE USE OF INFORMAL CHILDCARE (CODE 1 AND 3 AT Q10)
Q11 – Which, if any, of the following are reasons why you use informal childcare (rather than formal childcare)? (Tick all that apply/main reasons)
Prefer/trust friends/relatives Costs less
Provides greater flexibility More accessible
None of these Don’t know
ASK ALL WHO USE FORMAL CHILDCARE (CODE 2 and 3 AT Q10)
Q12 – Which, if any, of the following are reasons why you use formal childcare (rather than or along with informal childcare)? (Tick all that apply/main reasons)
Provides greater flexibility More accessible
Cannot access informal childcare
Don’t wish to burden relatives/friends (further) Educational/child development reasons None of these
Don’t know
Q13 – How easy or difficult do you find it to meet the cost of childcare? Very easy
Easy
Neither easy nor difficult Difficult
Very difficult
ASK ALL WHO USE FORMAL CHILDCARE (CODE 2 and 3) Q14 – How are you charged for your formal childcare? Per hour
Per half day Per day Per week
Per calendar month Don’t know
35
ASK ALL
Q15 – How would you prefer to pay for childcare? Per hour
Per half day Per week
Per calendar month
Not applicable – I don’t intend to use formal childcare Don’t know
ASK ALL WHO WORK FEWER THAN 35+ HOURS PER WEEK (<>CODE 5 AT Q7) OR WHOSE PARTNER WORKS FEWER THAN 35+ HOURS (<>CODE 5 AT Q9)
Q16 – Do you or your partner want to find work or work longer hours? Yes
No
ASK ALL WHO WANT TO FIND WORK OR WORK LONGER HOURS (CODE 1 AT Q16) Q17 – Why do you/your partner not currently work or work part-time?
(Tick those that apply/main reasons) Difficulty finding work with suitable hours Difficulty finding work with suitable pay Concerned about losing eligibility for benefits
Can’t afford (more) formal childcare e.g. childminder, nursery, before or after school club Can’t access (more) informal childcare e.g. relatives and friends
No suitable formal childcare available in my area Don’t wish to burden relatives/friends (further) Other
None of these Don’t know
ASK ALL WHO DO NOT HAVE 2 FULL-TIME WORKERS IN THE HOUSEHOLD (ALL EXCEPT CODE 5 AT Q7 AND Q9)
Q18 – Would you/your partner be willing to pay for more childcare to enable you to start work or increase your hours if you could find work which paid enough to cover your additional childcare cost? Very likely to pay for more childcare
Likely to pay for more childcare
Neither likely nor unlikely to pay for more childcare Unlikely to pay for more childcare
Very unlikely to pay for more childcare
Q19 – How easy or difficult do you think it would be for you or your partner to find suitable work which paid enough to cover the extra cost of childcare?
Very easy Easy
Neither easy nor difficult Difficult
Very difficult
36
Q20 – How likely would you and your partner be to use more childcare to enable you to start work or increase your hours if the additional cost of childcare was covered by the Government?
Very likely to use more childcare Likely to use more childcare
Neither likely nor unlikely to use more childcare Unlikely to use more childcare
Very unlikely to use more childcare
ASK ALL WHO DO NOT WANT TO FIND WORK OR WORK LONGER HOURS (CODE 2 AT Q16)
Q21 – Why do you/your partner not want to work or increase your hours? (Tick those that apply/ main reasons)
No need – we manage on the money we currently have Difficulty finding work with suitable hours
Difficulty finding work with suitable pay Concerned about losing eligibility for benefits
Cannot afford (more) formal childcare e.g. childminder, nursery, before or after school club Cannot access informal childcare e.g. relatives and friends
No suitable formal childcare available in my area Don’t wish to burden relatives/friends (further) Other
None of these Don’t know
Government supported childcare
Q22 –Do you currently receive any of the following? (All that apply)
Entitlement to 15 hours of free early education for children aged 3 and 4 years old Childcare element of the Working Tax Credit
Free early education for 2 year olds (available in some areas) Employer childcare vouchers
None of these Don’t know
ASK ALL WHO CODE 1-4 AT Q22
Q23 – Did you or your partner change the number of hours you worked b