1
Quantitative
programme of
research for adult
English and maths
Longitudinal survey of adult learners
waves 1 and 2
February 2018
Sally Panayiotou, Sarah Hingley, Kate Boulden, George
Kyriakopoulos, Eleni Romanou – Kantar Public
Richard Dorsett, Jake Anders, Lucy Stokes, Martin
Weale – NIESR
2
Contents
Contents 2
List of figures 6
List of tables 9
Executive Summary 12
Background and Aims 12
Findings 12
Understanding the different profiles of adult learners 12
What happened to learners’ skills? 14
What benefits did learners perceive? 15
Chapter 1 Introduction 17
Aims of the research 18
Policy context 18
Methodology 20
Assessment instrument design and analysis 20
Wave 1 21
Wave 2 22
Weighting 23
Chapter 2 Profile of learners 24
Summary 24
Overview 24
English learners 24
Maths learners 24
Demographic characteristics of learners who started on English courses 25
Age and gender 25
Ethnicity and first language 27
Previous qualifications in English 28
Main economic activity 29
Internet access and usage 30
3
Age and gender 31
Ethnicity and first language 33
Previous qualifications in maths 34
Main economic activity 35
Internet access and usage 35
Chapter 3 Experience of courses 38
Summary 38
Issues which got in the way of learning when young 39
English learners' previous experiences of learning 39
Maths learners' previous experiences of learning 40
Reasons for starting an English course 41
Reasons for starting a maths course 43
Course structure 45
English course structure 45
Maths course structure 47
Course completion rates and reasons for non-completion 49
Course completion amongst English learners 49
Course completion amongst maths learners 50
Participation in other courses since leaving school 51
English learners' participation in other courses 51
Maths learners' participation in other courses 51
Factors affecting studies during course 51
Factors affecting English learners' studies 51
Factors affecting maths learners' studies 52
Extent to which course helped skills 53
Extent to which course helped English learners' skills 53 Extent to which course helped maths learners' skills 54
Attainment of qualification related to course 54
4
Summary 55
Assessments used in the longitudinal survey 57
Item Response Theory - an explanation 57
Changes in reading performance amongst learners who attended English courses 58 Changes in reading performance by demographic characteristics of learners 60 Changes in reading performance by course characteristics 63 Changes in performance by perceived abilities and attitudes towards English 63 Changes in writing performance amongst learners who attended English courses 64 Changes in writing performance by demographic characteristics of learners 66
Changes in performance by course characteristics 68
Changes in reading and writing performance amongst learners who attended English
courses 69
Changes in maths performance amongst learners who attended maths courses 70 Changes in maths performance by demographic characteristics of learners 71 Changes in maths performance by course characteristics 73
Chapter 5 Learners’ perceptions of their abilities 74
Summary 74
English course participants’ perception of their English skills 75
Self-ratings at the start of the course 75
Changes in self-ratings after course ended 79
Maths course participants’ perception of their numeracy and English skills 85
Self-ratings at the start of the course 86
Changes in self-ratings after course ended 88
Perceptions of ICT skills 90
English learners’ self-rating of ICT skills at the start of the course 90 Maths learners’ self-rating of ICT skills at the start of the course 91 English learners’ changes in self-ratings of ICT skills after the course ended 92 Maths learners’ changes in self-ratings of ICT skills after the course ended 93 Chapter 6 Learners’ attitudes towards English and maths 95
Summary 95
5
Attitudes held at the start of their course 96
Changes in attitudes after course ended 98
Maths course participants' attitudes towards maths 99
Attitudes held at the start of their course 99
Changes in attitudes after course ended 101
Chapter 7 Other outcomes for learners 103
Summary 103
Changes in happiness levels 104
Changes in English learners' happiness levels 104
Changes in maths learners' happiness levels 106
Extent to which course helped family 106
Extent to which course helped family amongst English learners 107 Extent to which course helped family amongst maths learners 110
Extent to which course helped learners at work 112
Extent to which course helped English learners at work 113 Extent to which course helped maths learners at work 114
Extent to which course helped personal confidence 116
Extent to which course helped personal confidence amongst maths learners 117
Chapter 8 E-learner profile 119
English learners 119
Maths learners 119
Chapter 9 Conclusions 122
Appendix 1: Using learner assessments to measure skills gain 124
Background 124
The need for an advanced measurement approach 124
Equating and linking 125
Assumptions and limitations 126
Selected results 127
Measurement properties of the tests 127
6
List of figures
Figure 2.1 Age and gender of English course participants 26 Figure 2.2 Age and gender of English course participants, by course level 26 Figure 2.3 Ethnicity of learners attending English courses, overall and by course level 27 Figure 2.4 First language of learners attending English courses, overall and by course
level 27
Figure 2.5 Previous English qualifications held relative to course level 28 Figure 2.6 Main economic activity of learners attending English courses, overall and by
course level 29
Figure 2.7 Frequency of carrying out IT tasks amongst English learners 30
Figure 2.8 Age and gender of maths course participants 31
Figure 2.9 Age and gender of maths course participants, by course level 32 Figure 2.10 Ethnicity of learners attending maths courses, overall and by course level 33 Figure 2.11 First language of learners attending maths courses, overall and by course
level 34
Figure 2.12 Previous maths qualifications held relative to course level 35 Figure 2.13 Main economic activity of learners attending maths courses, overall and by
course level 35
Figure 2.14 Frequency of carrying out IT tasks amongst maths learners 36 Figure 3.1 Reasons English learners started an English course 41
Figure 3.2 Reasons for starting an English course 42
Figure 3.3 Reasons maths learners started a maths course 43
Figure 3.4 Reasons for starting a maths course 44
7
Figure 3.8 Difficulties faced during course amongst maths learners 52 Figure 5.1 How good at reading (self-perception) at start of course, overall and by English
course level 76
Figure 5.2 How good at writing (self-perception) at start of course, overall and by English
course level 76
Figure 5.3: How good at speaking English (self-perception) at start of course, overall and
by English course level 77
Figure 5.4 Perceived abilities of learners, by whether had concerns about grammar,
spelling and punctuation 78
Figure 5.5 Change in perceived reading ability of English learners, by whether enjoyed reading, found it easy to read, and had difficulty filling in forms at the start of the course 82 Figure 5.6 How good at working with numbers in daily life (self-perception) at start of
course, overall and by maths course level 86
Figure 5.7 How good at reading (self-perception) at start of course, overall and by maths
course level 87
Figure 5.8 How good at speaking English (self-perception) at start of course, overall and
by maths course level 87
Figure 5.9 How good at using computers (self-perception) at start of course, overall and by
English course level 91
Figure 5.10 How good at using computers (self-perception) at start of course, overall and
by maths course level 92
Figure 6.1 Positive attitudes towards English held by English learners 96 Figure 6.2 English learners' concerns regarding their use of English 97
Figure 6.3 Shifts in attitudes amongst English learners 98
Figure 6.4 Positive attitudes towards maths held by maths learners 99 Figure 6.5 Maths learners' concerns regarding maths and numerical problems 100
Figure 6.6 Shifts in attitudes amongst maths learners 101
8
Figure 7.2 Extent to which course helped relationship with family amongst English
learners, by course level 108
Figure 7.3 Frequency of reading with children and helping children with homework
amongst English learners 109
Figure 7.4 Effect of course on family amongst maths learners 110 Figure 7.5 Frequency of reading with children and helping children with homework
amongst maths learners 112
Figure 7.6 Extent to which course helped English learners at work 113 Figure 7.7 Extent to which course helped maths learners at work 114 Figure 7.8 Extent to which course helped on own self confidence, by course level 116 Figure 7.9 Extent to which course helped own self confidence by course level 117 Figure A1.1 Equating and linking design for maths tests 125 Figure A1.2 Boxplot of learners’ estimated abilities in maths wave 1 129 Figure A1.3 Count of persons and items against logit (ability/difficulty) scale in maths Entry
9
List of tables
Table 3.1 Issues which got in the way of learning when young amongst English learners 39 Table 3.2 Issues which got in the way of learning when young amongst maths learners 40 Table 3.3 Analysis of learner hours amongst English learners based on ILR data 45 Table 3.4 Hours of homework per week completed by English learners – overall and by
course level 46
Table 4.1 Mean change in English reading IRT score between waves 1 and 2, by course
level 59
Table 4.2 Proportion of learners whose performance in English reading skills progressed
or did not progress, by course level 60
Table 4.3 Proportion of learners whose performance in English reading progressed or did
not progress, by age 60
Table 4.4 Proportion of learners whose performance in English reading progressed or did
not progress, by gender 61
Table 4.5 Proportion of learners whose performance in English progressed or did not
progress, by first language 61
Table 4.6 Proportion of learners whose performance in English progressed or did not
progress, by main economic activity 62
Table 4.7 Mean change in English writing score between waves 1 and 2, by course level65 Table 4.8 Proportion of learners whose performance in writing progressed or did not
progress, by course level 65
Table 4.9 Proportion of learners whose performance in writing progressed or did not
progress, by age 66
Table 4.10 Proportion of learners whose performance in writing progressed or did not
progress, by gender 66
Table 4.11 Proportion of learners whose performance in English progressed or did not
progress, by first language 67
Table 4.12 Proportion of learners whose performance in writing progressed or did not
10
Table 4.13 Proportion of learners who showed progress in reading and writing, by course
level 69
Table 4.14 Mean change in maths IRT score between waves 1 and 2, by course level 70 Table 4.15 Proportion of learners whose performance in maths progressed or did not
progress, by course level 71
Table 4.16 Proportion of learners whose performance in maths progressed or did not
progress, by age 71
Table 4.17 Proportion of learners whose performance in maths progressed or did not
progress, by gender 72
Table 4.18 Proportion of learners whose performance in maths progressed or did not
progress, by first language 72
Table 4.19 Proportion of learners whose performance in maths progressed or did not
progress, by main economic activity 73
Table 5.1 Change in perceived reading ability of English learners between the start and
end of the course – overall and by course level 80
Table 5.2 Change in perceived reading ability of English learners, by whether showed
progress in their performance in the reading assessment 80
Table 5.3 Change in perceived writing ability of English learners between the start and end
of the course – overall and by course level 83
Table 5.4 Change in perceived writing ability of English learners, by whether showed
progress in their performance in the writing assessment 84
Table 5.5 Change in perceived speaking ability of maths learners between the start and
end of the course – overall and by course level 90
Table 5.6 Change in perceived ability to use computers of English learners between the
start and end of the course – overall and by age 93
Table 5.7 Change in perceived ICT abilities of maths learners between the start and end of
the course – overall and by course level 94
Table 7.1 Change in happiness levels between start and end of course for English learners
– overall and by first language 105
Table 7.2 Change in happiness levels between start and end of course for maths learners
11
Table 7.3 Whether course helped family amongst English learners – by perception of
whether course helped to improve skills 109
Table 7.4 Whether course helped family amongst maths learners – by perception of
whether course helped to improve skills 111
Table 7.5 Extent to which course helped English learners at work – by perception of
whether course helped to improve skills 114
Table 7.6 Extent to which course helped maths learners at work – by perception of
whether course helped to improve skills 115
12
Executive Summary
Background and Aims
This report covers the first 2 waves of the longitudinal survey of adult learners, which is part of a larger study, the programme of research for adult English and maths.
The development of adult English and maths skills is one of the fundamentals of current further education policy, and is seen as an important factor in improving employment opportunities. All adults in England are currently entitled to free training to enable them to improve their basic literacy and numeracy skills to English and maths GCSE / Level 2.1In
addition, in October 2015, the Conservative government commissioned a programme of work to reform maths and English Functional Skills qualifications, to ensure they are rigorous and suit the needs of employers today.
This research aims to provide a better understanding of learners’ experiences of adult English and maths courses in terms of skills gain, confidence and other life circumstances such as employment. In this longitudinal survey we interviewed a cohort of learners on courses from Entry Level 1 to Level 2 at the start and end of their course. They were also asked to complete a skills assessment at each stage.
The longitudinal survey of adult learners final research report, published separately alongside this interim update, includes the findings from a further survey conducted one year after learners’ courses ended, allowing us to understand what happens to learners in the year following their course.
Findings
Understanding the different profiles of adult learners
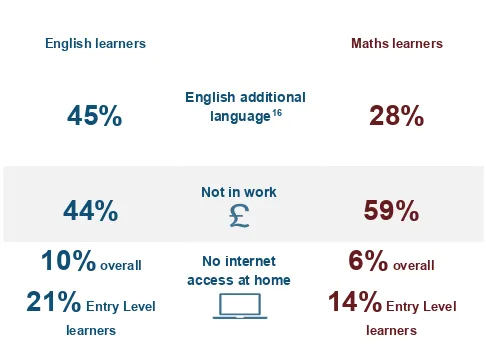
Learners tended to be younger, and there was a greater proportion of females than males. Many learners did not have English as a first language.
• Over three-fifths of learners on maths (64%) and English (63%) courses were under 35
• Three-fifths of learners were female (59% of learners on English courses, and 60%
of learners on maths courses)
1
13
• 40% of learners on English courses and 28% of learners on maths courses and did
not speak English as their first language2
• These proportions were even higher for Entry Level courses (47% of Entry Level
English learners and 40% of maths)3
Many learners attending adult education courses have had to deal with difficult life circumstances which negatively affected their earlier achievement in education. Courses therefore play a role in re-engaging learners in education.
• Overall, 42% of English learners and 45% of maths learners experienced difficulties that got in the way of their learning when they were younger. These circumstances ranged from physical and mental disability through to difficulties with their family life or frequent changes in school
• 47% of learners on English courses believed that ‘poor English skills had held me
back from getting on in life’. This was particularly prevalent amongst learners who were not in employment due to illness or disability (64%) and those lacking formal qualifications (60%). It was also more common amongst older learners (56% of learners on English courses aged 55 or over)
Underlining the strong correlation between adult learning and a desire to improve
employment circumstances, many learners said their reason for attending the course was related to work. At the end of their course, many learners felt their course had helped with aspects of their work life.
• 44% of learners on English courses and 59% of learners on maths courses were not currently in work at the start of their course
• 27% of learners on Entry Level maths and English courses started the course to help find work; while 25% of Entry Level English learners and 21% of Entry Level maths learners started the course to help get a better job
• Amongst learners who were in work at the end of their course a large proportion agreed that: ‘the course helped with my confidence at work’ (82% of English
learners and 72% of maths learners); and that ‘the course helped with my ability to do my job’ (76% of English learners and 67% of maths learners)
2 The sample included 176 learners who were on English for Speakers of Other Languages (ESOL) courses
(9% of the English learner sample). These learners have been excluded from the 40% overall profile. When including these learners, 45% of all English learners were non-native English speakers.
3 This excludes learners on ESOL courses - the proportion is 53% of English learners when ESOL courses
14
What happened to learners’ skills?
In this report we identify the proportion of learners whose skills level increased (defined as having made progress) between the 2 survey waves, as this is the expected direction of skills change. The final report uses multivariate techniques for a greater understanding of changes in skills, drawing on the data gathered for all 3 waves.
When interpreting these findings an important consideration is the reasons why learners took their course. We should not assume that all learners were aiming to improve their skills. It is possible some learners will have been seeking a qualification at their existing skills level, for example to help them find work or meet the requirements for a more advanced course. It is also not possible to identify the incidence of learners who were potentially taking a course at an inappropriate level for their skills.
• Three-tenths (30%) of English learners took their English course to improve their everyday reading and writing skills, while a quarter (25%) of maths learners took their maths course to improve their ability to work with numbers
• For other learners the main reason was work-related or a stepping stone to further qualifications
These comparisons should also be considered indicative for methodological reasons. The timing of the survey necessitated a different methodology at wave 1 compared to wave 2.4
Variations in performance may also indicate a regression to the mean - the phenomenon whereby random variations in measured scores disappear when re-measured. Essentially, in a real life test situation people can have a bad day or a good day, which means there is a random element to their test score on any day. 5
• Overall, there was an increase in English skill levels for around half of English learners (52% for reading and 51% for writing) and two-thirds (66%) of maths learners
• Progress was more widespread amongst learners attending higher level courses,
particularly in maths. A third (33%) of learners on Entry Level maths courses
demonstrated progress in their maths skills, compared with nearly three-quarters of
4 Wave 1 was conducted in colleges via pen and paper, while wave 2 was conducted in-home using
Computer Aided Personal Interviewing with an interviewer present.
5 Some individuals may be identified as having shown a decline, however it is important to bear in mind that
15
learners on higher levels (72% of learners on Level 1 and 74% of learners on Level 2 courses)6
• Male learners who attended English courses were much more likely to show an identifiable improvement in their reading skills than female learners (62% of males improved, compared with 45% of females)
• This gender skew was not, however, observed in the writing or maths assessments, where progression rates were similar for both men and women
• Learners who said they felt ‘nervous when I have to take an English test’ or who ‘get anxious during maths tests’ were less likely to show progress than other learners in the reading and maths assessments.
What benefits did learners perceive?
The vast majority of learners felt their course helped to improve their skills. However, there was a large proportion of learners who felt the course improved their skills ‘a lot’ but did not demonstrate progress in the assessments. This raises questions over the extent to which there may be a difference between perceptions of skills gain and measurable progress; and the wider skills that learners gained during their course.7
• 96% of English learners and 93% of maths learners agreed ‘the course helped with my skills.’ The majority of learners felt their course helped them to improve their skills ‘a lot’ (66% of English learners and 62% of maths learners)
• Around half of English learners who felt the course improved their skills ‘a lot’
demonstrated progress in the reading assessment (53%), and a similar proportion in the writing assessment (51%)
• Three-fifths (62%) of maths learners who felt the course improved their skills ‘a lot’
demonstrated progress in the maths assessment
• Amongst English learners the proportion rating their writing skills as ‘fairly good’ or ‘very good’ rose from 69% at the start of the course to 76% at the end. The
equivalent proportion for speaking English rose from 86% to 93%
• The proportion of learners on English courses rating their reading skills as ‘very good’ rose from 34% to 43%
6 The equivalent figures for English courses were: 44% Entry Level , 46% Level 1, and 61% Level 2
(progress in reading); 52% Entry Level, 30% Level 1, and 70% Level 2 (progress in writing).
7 It should be highlighted that in this specific question the word ‘skills’ was open to interpretation, and it did
16
• There were similar changes for learners on maths courses. The proportion rating
their maths skills as ‘fairly good’ or ‘very good’ rose from 83% to 87% at the end of their course, with the proportion rating their maths skills as ‘very good’ increasing from 27% to 37%
• However, there were also some negative findings in terms of perceptions of skills. Learners were asked whether they agreed with a series of statements relating to their feelings about maths or English. These included statements such as ‘I worry about making grammar mistakes’, ‘I find it easy to write to somebody I know’ and ‘I worry about my ability to solve maths problems’ (see Chapter 6). Although the proportion of learners expressing a positive shift was larger for every statement, between 20% and 30% of learners showed a negative shift in their answers to these statements between the start and the end of their course
• Two-thirds of English learners (67%) reported that their course had helped improve the degree of interest that the wider family had in learning and 58% said it had helped relationships with their partner or family. The equivalent proportions of learners on maths courses were 62% and 50% respectively
• Learners also tended to report higher levels of happiness at the end of their courses
- 43% of English learners and 50% of maths learners gave a higher happiness rating at the end of their courses than they gave at the start
These findings are consistent with an evaluation of learners who started on Skills for Life-funded English and maths courses in 2002 or 2003, which identified the positive effect of courses on learners’ perceptions of their skills and confidence during (and beyond) their course.8
Next steps
The third wave of the longitudinal survey explores learners’ longer term outcomes. It investigates whether learners improved their employment outcomes and if, and how, learners were motivated to continue their learning journey. In the Final Report, published alongside this interim assessment of waves 1 and 2, we explore how skills developed in the year after learners’ courses by repeating the assessments used in the first 2
interviews.
8 Evaluation of the impact of Skills for Life learning: longitudinal survey of adult learners on college-based
17
Chapter 1 Introduction
This report covers the first 2 waves of the longitudinal survey of adult learners, which make up part of a larger programme of work - the programme of research for adult English and maths. In addition to this longitudinal survey, the full research programme incorporates a Randomised Controlled Trial, qualitative research into the implementation of adult learning in colleges, and research on courses run by local authorities. All learners included in the programme of research for adult English and maths were aged 19 or above and attending Skills for Life-funded (publically-funded) English or maths courses between Entry Level 1 and Level 2.
This research was commissioned by the Department for Business, Innovation and Skills (BIS) and aims to provide a better understanding of the way in which adult learners’ skills develop and/or decline over time. This aids understanding of the effectiveness of adult skills provision and enables evidence-based policy decisions on the future development of the sector. The outputs are being published by the Department for Education, as during machinery of government changes in early 2017, responsibility for skills analysis moved to the Department for Education.
To accomplish this complex research project, a consortium of organisations led by Kantar Public (formerly TNS BMRB) worked together on the design and implementation of its various elements. The longitudinal survey of adult learners was conducted by Kantar Public using assessment tools designed by AlphaPlus, and with support from Work and Learning Institute (formerly NIACE) in the recruitment of colleges. The analysis of the longitudinal assessment data was conducted by NIESR, and Professor Steve Reder9
provided input into the questionnaire design and analysis.
The 2 waves of longitudinal data that are currently available provide an overview of the extent to which learners progressed between the start (wave 1) and the end (wave 2) of their English or maths course. It also explores aspects such as the profile of learners who attend these courses, the level of confidence they have in their skills, and the barriers to education that they may have faced in their earlier lives. The next stage of the longitudinal survey (wave 3) involved interviewing the learners a year after their course finished, to understand what happens to their skills and their life circumstances in the longer term.
9 Professor Steve Reder is on the faculty at Portland State University (PSU) where he specialises in adult
18
Aims of the research
There were 4 main aims for the programme of research for adult English and maths. These were to:
1. Test different models of delivery for adult basic English and maths provision and assess which is most effective for which group of learners
2. Understand skills gain and atrophy over time
3. Understand the economic and social effects of participation in Skills for Life courses 4. Develop rigorous and valid psychometric test instruments for use in research
The first of these aims is addressed by both the longitudinal survey of adult learners and the RCT. The longitudinal survey explores the level and length of courses, and whether learners from a variety of backgrounds are affected in different ways by their courses. The RCT explores whether the rate of skills gain differs between more traditional classroom-based learning and classes that make extensive use of information technology.
The second aim is also addressed, to some extent, by both the longitudinal survey of adult learners and RCT. The RCT involves measuring skill levels at both the start and the end of courses, giving a measure of skills gain (but not atrophy). The longitudinal research
includes a third stage of interviewing, in which learners are contacted a year after the completion of their course. This means it is possible not only to understand how skills may have improved between the start and the end of the course, but to see what happens in the longer term.
The third aim is primarily addressed by the longitudinal survey of adult learners and will be explored in the final report.
The fourth aim was addressed by AlphaPlus, who designed the assessments that were used in both the longitudinal survey and the RCT.
Policy context
The history of the adult skills sector is long and complex. There have been significant changes in policy focus over the past 3 decades and responsibility for the sector has fallen under the remit of several different government departments. As such, we concentrate on the recent policy developments here.10
10 A more detailed summary of historical changes to the sector can be found in the following publication from
19
Under the Coalition Government of 2010-2015, there was a strong focus on the development of adult skills in the context of improving employment opportunities. In particular, there was a desire to continue developing the uptake and implementation of apprenticeships, whose renaissance began with the introduction of Modern
Apprenticeships in 1994. Underpinning this desire to help people back to work was
recognition of the fundamental importance of English and maths skills. In November 2010, the Coalition Government published its Skills for Sustainable Growth strategy document, which stated that:11
“Literacy and numeracy skills enable people to function in society, progress into vocational learning and employment, and operate more productively in work. But millions of adults in England lack even basic reading, writing and mathematical skills. We believe this resulted from an unacceptable failure of the education system and that it is therefore only right to give them a second chance to acquire those skills.”
“We will therefore continue to fully fund literacy and numeracy provision for those who need it, whether in the workplace or in the community, but to maximise
economic and personal returns we will review the way basic skills are delivered and take steps to ensure this training fully equips individuals and employers with the functional literacy and numeracy skills they need. This reformed programme will move away from targets to focus on equipping individuals with the skills and
qualifications they need to get a job, progress in work and play a full part in society. We recognise the importance of the quality of teaching and learning, access for those most in need, and skills which support progression, employability and improved productivity.”
To address this need to maximise returns, a consultation was undertaken and the outcomes were published in New Challenges, New Chances (December 2011).12 This
report highlighted an intention to improve the quality of apprenticeships:
“…ensuring that providers support apprentices to achieve Level 2 in English and maths wherever possible.”
Other important actions were to:
“Prioritise young adults who lack English and maths skills, and those adults not in employment.”
11https://www.gov.uk/government/publications/skills-for-sustainable-growth-strategy-document
12
20
“Fund GCSE English and maths qualifications [for adult learners] from September 2012.”
“…increase its focus on the quality of teaching, learning and assessment in inspection. Paying particular attention to how well teaching develops English and maths skills.”
“Undertake a new research, development and evaluation programme from 2012.”
The Longitudinal Survey of Adult Learners described in this report is part of the wider effort to address this final action.
More recently, the Conservative manifesto outlined some of the ambitions of the current government in terms of adult skills.13 Once again, there is a strong emphasis on the
importance of apprenticeships and employability, stating that:
“Over the next five years we will deliver three million more [apprenticeships] and ensure they deliver the skills employers need.”
There is also an intention to:
“…replace lower-level classroom-based Further Education courses with high quality apprenticeships that combine training with experience of work and a wage.”
As such, the future policy priorities for the adult skills sector remain keenly centred on improving the employment prospects of learners. English and maths skills are integral to this goal.
Methodology
This section briefly overviews the research methods used in this study. A more detailed research methodology is included in the longitudinal survey technical report.
Assessment instrument design and analysis
The assessments used in all the interviews were designed by AlphaPlus, who undertake performance analysis of assessment for UK awarding organisations, DfE and Ofqual. The first stage of their development involved the design of a large bank of questions which were then trialled with learners to assess their validity. Following the trialling phase, any unreliable questions were removed. Questions were designed to cover the full range of course levels involved in the survey - Entry Levels 1 to 3 and Levels 1 to 2.
21
AlphaPlus then drew upon the bank of validated questions to create a separate
assessment for each of the 10 different types of class involved in the survey (5 levels in each of the 2 subjects). Each version was designed to be manageable and engaging for learners on a course of a given level as well as being appropriate for measuring progress over the course timescale. Therefore, each of the assessments contained questions at a range of levels, ensuring that those with higher skills were challenged by some questions while accepting that those with lower skills would find some questions too difficult.
The assessments were designed to be suitable for administration via pen and paper as well as via computer-based delivery to ensure compatibility across different learner environments and the wave 1 and waves 2 and 3 survey methodologies.
Learners in wave 1 completed the version of the assessment which was designed to be suitable for learners starting out on a course at a given level. These same learners in wave 2 then took a version of the assessment which was one level higher to take into account the effect that the course was likely to have had on their skills. Bridging questions were included in the questionnaire variants to allow AlphaPlus to calibrate results across waves and determine whether progress had been made.
AlphaPlus used Item Response Theory (IRT) when analysing the results to derive a measure of performance across all of the different assessment versions. This process is described in more detail in chapter 4 and a full description of the statistical methods is included in the technical report.
Wave 1
The first wave of the survey was conducted using pen and paper interviewing (PAPI). Colleges were recruited to take part in the survey by Kantar Public’s telephone
interviewing team prior to the start of the autumn term. Details about the expected number of adult learners in English and maths were also collected at this stage, allowing Kantar Public to identify how many questionnaires at each level to send to the college. Fieldwork took place in the autumn 2013 and spring 2014 terms.
Face to face interviewers delivered printed versions of the questionnaires to the colleges and briefed a nominated member of staff on how to administer the questionnaires. Tutors were told they could help learners complete the first section of the questionnaire (which included demographics and attitudinal questions) if needed, but the assessment section needed to be the learner’s own work. Colleges were asked to administer the
22
A boost sample of learners attending e-learning classes (i.e. classes where the learning is primarily software guided rather than teacher-led) was also included. Learners were contacted through learndirect centres and in total 236 of these learners were interviewed. The process for sampling these learners is discussed in the accompanying technical report. The findings for these learners are included in the results discussed throughout the report. Chapter 8 compares these learners with learners who were sampled through colleges.
Learners were asked about their willingness to participate in later stages of the survey and were given a £5 incentive as a thank you for their involvement in the first wave. Overall 70% of learners agreed to be re-contacted in wave 2.
On completion, questionnaires were returned to Kantar Public, where the demographic and attitudinal survey responses were digitally scanned and converted into a usable data format. The assessment sections were sent to AlphaPlus for marking by their team of specialists.
Wave 2
The second wave of the survey was conducted using Computer Assisted Personal Interviewing (CAPI). Kantar Public’s face to face interviewers visited learners in their
homes, as close as possible to the end date of their courses (for the majority of the sample this was at the end of the summer 2014 term). In addition to the sample of wave 1
participants who had agreed to be re-contacted, a boost sample of learners taken from the Individualised Learner Record (ILR) was included. This was to create a large enough sample size for reliable analysis of any changes in skill levels between waves 2 and 3. Where appropriate this report analyses data based: on the total sample of learners at wave 1; the total sample of learners at wave 2; or, on the sample of learners who completed a survey at both wave 1 and wave 2.
Respondents completed the assessment section of the interview, observing the same guidelines as were applied in wave 1 - primarily that their answers had to be all their own work. The only help that interviewers were allowed to give to respondents related to the use of the computer, for example explaining how to use the mouse or how to move from one question to the next. If the respondent was unable to input their own answers due to a disability, then the interviewer was permitted to act as a scribe.
23
Weighting
The data from wave 1 were weighted to make it representative of the adult learning sector as a whole in terms of age, gender, region and the level of the course. Separate weights were applied for English and maths.
The wave 2 data were additionally weighted to take account of any non-response bias, i.e. correcting for the fact that certain types of respondent may have been less likely to agree to be re-contacted in wave 2.
24
Chapter 2 Profile of learners
Summary
This chapter describes the profile of learners included in this research. The majority of data is self-reported by learners in the survey, however, where indicated, the data shown are drawn from the Individualised Learner Record.14
Overview
15
14 The process of matching data from the ILR to our survey data is documented in the accompanying
technical report.
15 Note that percentages are rounded to the nearest whole number (figures are rounded up from .5, and
rounded down below this) and do not always add to 100% due to rounding.
English learners
Maths learners
63%
Aged <35
64%
37%
Aged 35+
36%
41%
Male
40%
59%
Female
60%
55%
English first
25
44%
Not in work
59%
10%
overallNo internet
access at home
6%
overall21%
Entry Levellearners
14%
Entry Level learners
Demographic characteristics of learners who started on
English courses
[image:25.595.54.540.65.411.2]Age and gender
Figure 2.1 shows the overall age profile of English learners, while Figure 2.2 shows the age profile of men and of women who attended each level of course. Note that there were only 12 learners in the sample aged 65 or over (the oldest learner being 78).
Learners starting on English courses were predominantly under the age of 35 (63%), although Entry Level learners were, on average, older than learners on higher courses. The mean age of learners was as follows:
• Entry level = 36
• Level 1 = 32
• Level 2 = 31
Men under the age of 25 were particularly likely to attend Level 1 or Level 2 courses.
16 The sample included 176 learners who were on ESOL courses (9% of the English learner sample).
English learners Maths learners
26
Figure 2.1 Age and gender of English course participants
Base: Wave 1 learners who attended any English course and reported their age and gender (1911) Note: those who refused to give an age have been removed from the base
Figure 2.2 Age and gender of English course participants, by course level
Base: Wave 1 learners who attended: Entry Level 1-3 English course (men: 339; women: 460); Level 1 English course (men: 176; women: 388); Level 2 English course (men: 165; women: 383) Note: those who refused to give an age have been removed from the bases
17% 11% 7% 5% 2% 16% 19% 12% 8% 3% Female Male 35-44 45-54 55 or over
25-34 24 or under
34% 22% 17% 8% 21% 30% 22% 20% 6% Female Male Level 2 Entry Level Level 1
24 or under 25-34 35-44 45-54 55 or over
53% 24% 14% 8% 1% 31% 34% 22% 9% 4%
24 or under 25-34 35-44 45-54 55 or over
27
Ethnicity and first language
The proportion of Black or Minority Ethnic (BME) learners on English courses was much higher than the general population of working age adults in England (39% compared with 15%).17 Figure 2.3 shows how the proportion of BME learners decreases with course level.
Figure 2.3 Ethnicity of learners attending English courses, overall and by course level
Base: All wave 1 learners who gave their ethnicity and attended: Any English course (1899); Entry Level 1-3 English course (786); Level 1 English course (570); Level 2 English course (543)
Figure 2.4 breaks down learners’ first language by course level. Fifty-five per cent of all learners spoke English as their first language.18
Figure 2.4 First language of learners attending English courses, overall and by course level
Base: All wave 1 learners who reported their first language and attended: Any English course (1981); Entry Level 1-3 English course (839); Level 1 English course (589); Level 2 English course (553)
17 Ethnic profile data from Census 2011 http://www.nomisweb.co.uk
18 The sample included 176 learners who were on ESOL courses (9% of the English learner sample). 61% 68% 59% 55% 16% 14% 17% 19% 15% 13% 16% 17% 3% 2% 3% 3% 5% 4% 5% 6% All learners Level 2 Level 1 Entry Level
White Black Asian Mixed Other
55% 65% 52% 47% 45% 35% 48% 53% All learners Level 2 Level 1 Entry Level
28
Previous qualifications in English
Seventy-two per cent of English learners held a previous qualification in English. This was more likely amongst Level 2 course participants (85%) than Level 1 learners (74%) or Entry Level learners (55%).
Figure 2.5 shows the proportion of learners at each level who had a previous English qualification, indicating whether the course they were attending was more basic,
equivalent to or more advanced than the qualification they had attained. Note that this is based on self-reported survey data as it was not possible to match the ILR data across the sample.
It is also important to note that in the survey Entry Levels 1 and 2 were grouped together. Therefore it isn’t possible to identify whether the learner may have, for example, been studying on an Entry Level 2 course with a previous qualification at Entry Level 1.
Figure 2.5 Previous English qualifications held relative to course level
Base: All wave 1 learners who reported a previous English qualification and attended: Any English course (1828); Entry Level 1-3 English course (771); Level 1 English course (529); Level 2 English course (528)
English course at higher level or same level as prior attainment
Entry Level Level 1 Level 2
15% 12% 12%
5% 7%
2%
40% 17%
13%
39% 65% 73%
29
The majority of Level 2 learners (73%) and Level 1 learners (63%) already had an English qualification below the level of course they were attending. A substantial minority of
learners at these levels (13% of Level 2 learners and 17% of Level 1 learners) reported that they held a qualification at the same level as the course they were assigned to. When looking at the matched ILR data many English learners appeared to be on a modular course. It may therefore be the case that their previous qualification was part of the same course.19 A small minority in each group (2% and 7% respectively) held a qualification that
was more advanced that the course they were assigned to.20
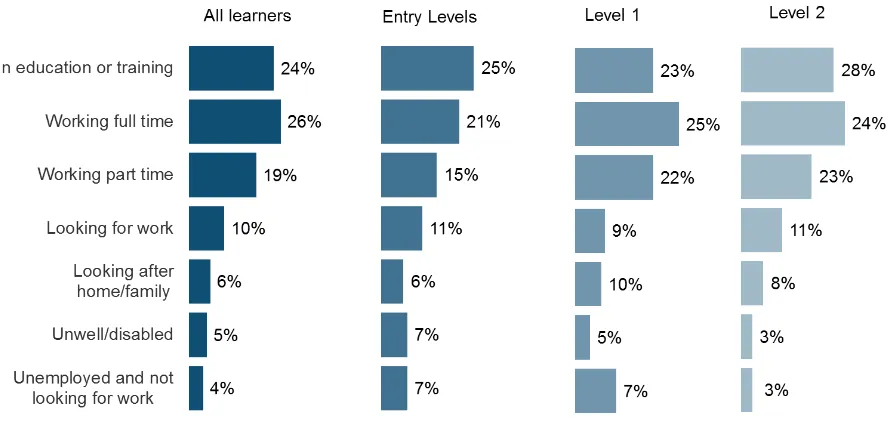
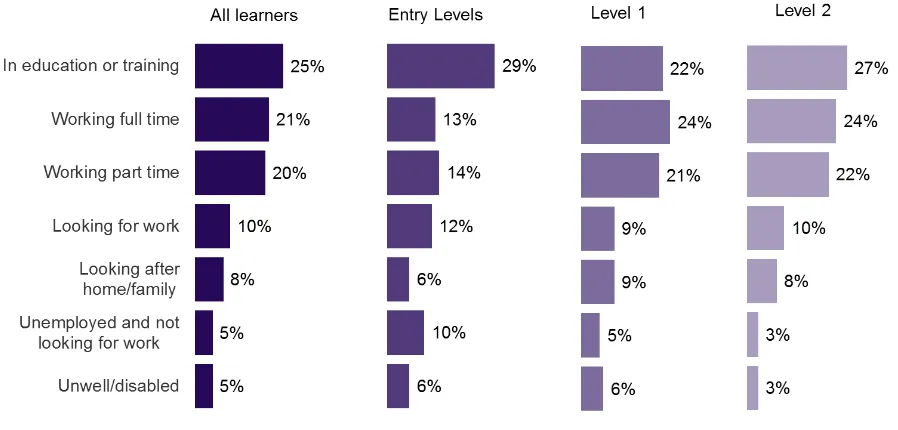
Main economic activity
[image:29.595.75.522.335.549.2]Over two in five English learners were in employment at the beginning of their course (44%). This is broken down by course level in Figure 2.6.
Figure 2.6 Main economic activity of learners attending English courses, overall and by course level
Base: All wave 1 learners who reported their main economic activity and attended: Any English course (1641); Entry Level 1-3 English course (691); Level 1 English course (4487); Level 2 English course (463)
19 This was not asked in the questionnaire so it is not possible to confirm this.
20 It is worth noting that although 40% of Entry Level course participants already possessed an Entry Level
30
Internet access and usage
Overall, 90% of learners had internet access from a computer or tablet (at home, work, library, college, or at a friend's or relative's house) at the start of their English course. However, access levels varied considerably for learners attending different levels of course, ranging from 79% of Entry Level course participants to almost universal access (96%) amongst Level 2 course participants.
The frequency with which English learners carried out various IT tasks is shown in Figure 2.7. While online discussions were undertaken by similar proportions of learners at each course level, and with a broadly similar degree of regularity, the prevalence and frequency of all other activities differed between learners attending different course levels. Entry Level course participants were more likely than other learners to never undertake these activities at all: this low level of activity was apparent even when discounting learners who did not have internet access. Level 2 course participants were not only more likely than others to perform most of these activities, but to do so daily.
Figure 2.7 Frequency of carrying out IT tasks amongst English learners
31
Demographic characteristics of learners who started on maths
courses
Age and gender
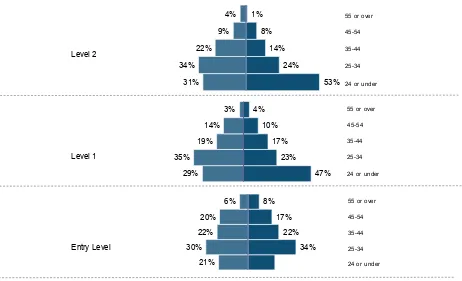
Figure 2.8 shows the overall age profile of maths learners, while Figure 2.9 shows the age profile of men and of women who attended each level of course.
As was the case with learners starting on English courses, the majority of learners starting on maths courses were under the age of 35 (64%). The mean age of learners was as follows:
• Entry level = 33
• Level 1 = 32
• Level 2 = 31
Male learners, particularly those attending Entry Level and Level 1 courses, were disproportionately likely to be under the age of 25.
Figure 2.8 Age and gender of maths course participants
Base: Wave 1 learners who attended any maths course and reported their age and gender (1697) Note: those who refused to give an age have been removed from the base
17% 11% 6% 3% 3%
19% 17%
14% 8%
2%
Female Male
32
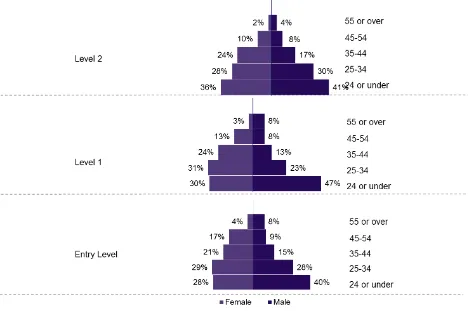
Figure 2.9 Age and gender of maths course participants, by course level
33
Ethnicity and first language
As was the case with the English learners, BME groups were over-represented amongst the maths learners (32%) relative to the general population of England (15%).21 The
proportion of BME learners was lower in more advanced courses (Figure 2.10).
Figure 2.10 Ethnicity of learners attending maths courses, overall and by course level
Base: All wave 1 learners who gave their ethnicity and attended: any maths course (1696); Entry Level 1-3 maths course (623); Level 1 maths course (554); Level 2 maths course (519)
21 Ethnic profile data from Census 2011 http://www.nomisweb.co.uk
68%
78%
66%
53%
14%
9%
16%
16%
12%
8%
11%
20%
3%
2%
3%
4% 4%
2%
3%
7% All learners
Level 2
Level 1
Entry Level
34
Figure 2.11 breaks down learners’ first language by course level. Almost 3 in 10 maths course participants (28%) spoke a language other than English as their first language.
Figure 2.11 First language of learners attending maths courses, overall and by course level
Base: All wave 1 learners who reported their first language and attended: any maths course (1768); Entry Level 1-3 maths course (660); Level 1 maths course (574); Level 2 maths course (534)
Previous qualifications in maths
Over four-fifths of maths learners (82%) held a previous qualification in maths. This was true of relatively fewer Entry Level learners (68%, compared with 83% of Level 1 and 87% of Level 2 learners).
Figure 2.12 shows the proportion of learners at each level who had a previous maths qualification, indicating whether the course they were attending was more basic, equivalent to or more advanced than the qualification they had attained.
As for English learners, when interpreting these data it should be noted that in the survey learners did not distinguish between being on an Entry Level 1 or an Entry Level 2 course. This means it is not possible to identify whether the learner may have, for example, been studying on an Entry Level 2 course with a previous qualification at Entry Level 1.
Similarly, for learners matched to the ILR, there appears to be a notable proportion on a modular course, and it is possible that a previous qualification could have been gained as part of the same course.
72%
79%
71%
60%
28%
21%
29%
40% All learners
Level 2
Level 1
Entry Level
35
Figure 2.12 Previous maths qualifications held relative to course level
Base: All wave 1 learners who reported a previous maths qualification and attended: any maths course (1449); Entry Level 1-3 maths course (503); Level 1 maths course (475); Level 2 maths course (471)
Main economic activity
As shown in Figure 2.13, the proportion of learners not in employment was particularly high amongst Entry Level course participants (73%).
Figure 2.13 Main economic activity of learners attending maths courses, overall and by course level
Base: All wave 1 learners who reported their main economic activity and attended: any maths course (1403); Entry Level 1-3 maths course (514); Level 1 maths course (471); Level 2 maths course (418)
Internet access and usage
The majority of maths learners (94%) had access to the internet from a computer or tablet at the start of the course, whether at work, home, in a library or college, or a relative's or
Level 1 Level 2
15% 11% 6%
17% 6% 1%
41% 32% 11%
28% 51% 82%
Unspecified/refused Course level lower Course same level Course level higher
Maths course at higher level or same level as prior attainment
36
friend's home. While access was almost universal amongst Level 2 course participants (97%), only 86% of Entry Level course participants had access.
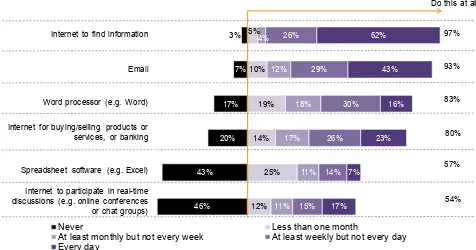
[image:36.595.55.531.249.499.2]In general, maths learners were more likely than English learners to use the internet for various activities. However, the general pattern of usage was similar between the 2 groups of learners, with internet searches and email the most common activities, and far fewer learners using spreadsheet applications or undertaking online discussions. The prevalence of each activity, and frequency with which it was carried out, is shown in Figure 2.14.
Figure 2.14 Frequency of carrying out IT tasks amongst maths learners
Base: Wave 1 learners who answered the question and attended a maths course (c.1600) Note: those who refused to answer or said ‘don’t know’ have been removed from the base
Entry Level, Level 1 and Level 2 course participants were as likely to use spreadsheet software and participate in real-time online discussions as each other. However, Entry Level course participants were less likely than learners on more advanced courses to perform the remaining activities. This was true even when learners who did not have internet access were discounted.
46% 43% 20% 17% 7% 3% 12% 25% 14% 19% 10% 5% 11% 11% 17% 18% 12% 4% 15% 14% 26% 30% 29% 26% 17% 7% 23% 16% 43% 62%
Never Less than one month
At least monthly but not every week At least weekly but not every day Every day
Internet to find information
Email Word processor (e.g. Word) Internet for buying/selling products or
services, or banking Spreadsheet software (e.g. Excel) Internet to participate in real-time discussions (e.g. online conferences or chat groups)
37
38
Chapter 3 Experience of courses
Summary
This chapter explores learners’ motivations for undertaking training in basic English and maths and experiences of the courses, including the degree to which learners perceived their course helped them to improve their skills.
• 42% of English learners; and 45% of maths learners experienced issues which got
in the way of their learning when they were younger
• The most widely reported issues were a ‘learning disability’ (18% of English
learners; 18% of maths learners), followed by ‘difficult family circumstances’ (16% of English learners; 15% of maths learners)
• 32% of English learners; and 41% of maths learners (who gave at least one reason)
started their course as a ‘stepping stone to other training / qualifications’
• Three-tenths (30%) of English learners wanted to ‘improve their everyday reading and writing skills’; and 25% of maths learners sought to ‘improve their ability to work with numbers’
• Employment-related reasons were also common, with around a fifth of English learners and maths learners hoping the qualification would ‘help them find work’ (23% of English learners; and 21% of maths learners who gave at least one
reason), or help them ‘get a better job’ (22% of English learners; and 20% of maths learners who gave at least one reason)
• English learners did an average of 4.2 hours; and maths learners 3.8 hours of
homework per week. Amongst both English and maths learners, the reported amount of time spent doing homework increased with course level. However, 13% of English learners overall (9% on Level 2 courses); and 16% of maths learners overall (12% on Level 2) reported doing no homework
• 7% of English learners; and 9% of maths learners withdrew from the course before its end.22 The most common reason was ‘personal, domestic, or illness’ (43%
English learners; 33% maths learners). A tenth of maths learners (9%) who withdrew before the course end ‘couldn’t cope academically’
39
Issues which got in the way of learning when young
English learners' previous experiences of learning
Over two-fifths of English learners (42%) experienced issues which got in the way of their learning when they were young. Entry Level learners were more likely to say that they had issues which got in the way of their learning (48%) than Level 2 learners (38%). Table 3.1 shows the various issues reported by learners who attended an English course.
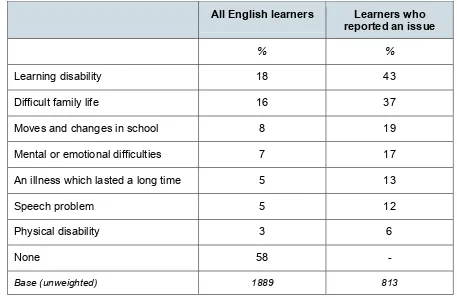
[image:39.595.67.524.308.605.2]As might be expected, learners who were not in employment because they were unwell or disabled were most likely to report that there were issues affecting their learning when they were young (85%).
Table 3.1 Issues which got in the way of learning when young amongst English learners23
All English learners Learners who
reported an issue
% %
Learning disability 18 43
Difficult family life 16 37
Moves and changes in school 8 19
Mental or emotional difficulties 7 17
An illness which lasted a long time 5 13
Speech problem 5 12
Physical disability 3 6
None 58 -
Base (unweighted) 1889 813
23 Note that learners were provided with a list of issues in the survey questionnaire from which they selected
40
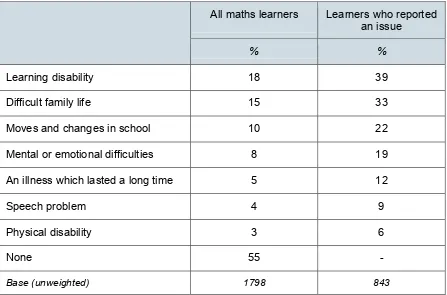
Maths learners' previous experiences of learning
Compared to English learners, a similar proportion of maths learners (45%) reported that there were issues which got in the way of their learning when they were younger. Again, this proportion was particularly high amongst learners who were not in employment because they were unwell or disabled (80%).
[image:40.595.75.522.288.583.2]The likelihood of having experienced difficulties decreases with course level: 53% of Entry Level learners reported experiencing issues which got in the way of their learning, 49% of Level 1 learners and 37% of Level 2 learners. Table 3.2 shows the issues which got in the way of learners’ education.
Table 3.2 Issues which got in the way of learning when young amongst maths learners24
All maths learners Learners who reported an issue
% %
Learning disability 18 39
Difficult family life 15 33
Moves and changes in school 10 22
Mental or emotional difficulties 8 19
An illness which lasted a long time 5 12
Speech problem 4 9
Physical disability 3 6
None 55 -
Base (unweighted) 1798 843
Male maths learners were more likely (28%) than female learners (12%) to say that a learning disability got in the way of their learning. Department for Education statistical analysis does show that boys are more likely to be identified as having Special
Educational Needs than girls.25 Conversely, more female learners (21%) than male
learners (11%) said a difficult family life got in the way of their learning.
24 Note that learners were provided with a list of issues in the survey questionnaire from which they selected
all relevant issues. Therefore, for example, having a learning disability has necessarily not been independently assessed.
41
Reasons for starting an English course
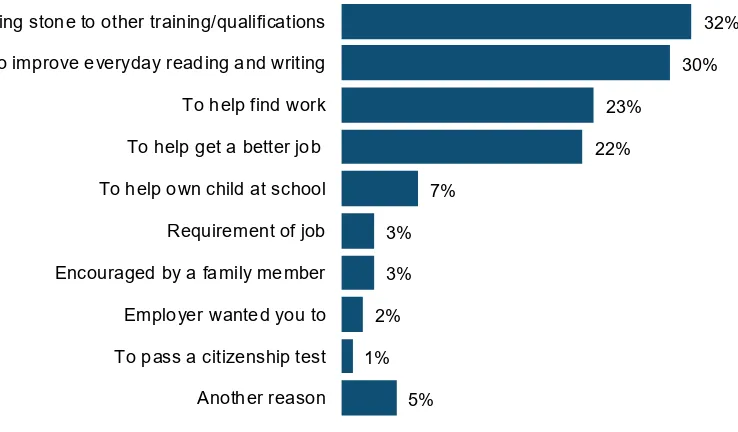
[image:41.595.121.490.187.403.2]The reasons offered by English learners for starting a course tended to be related to self-improvement and employability, as shown in Figure 3.1.
Figure 3.1 Reasons English learners started an English course
Base:All wave 1 learners who attended an English course and gave at least one reason (1981)
Figure 3.2 shows the change of priorities through the course levels. Entry Level learners were particularly interested in improving their everyday reading and writing (40%) and, in contrast to learners at Level 1 and Level 2, placed greater emphasis on work-related reasons such as to help find work. As we observed in the previous chapter, Entry Level learners were less likely to be in employment (29%) than those attending more advanced courses (40% of Level 1 and 38% of Level 2). In contrast, Level 2 learners were
particularly likely to view the course as a stepping stone towards further qualifications (45%). Learners on Level 1 courses show a balance between these priorities.
32% 30% 23%
22% 7%
3% 3% 2% 1%
5% Stepping stone to other training/qualifications
To improve everyday reading and writing To help find work To help get a better job To help own child at school
42
Figure 3.2 Reasons for starting an English course
Base: Wave 1 learners who attended an English course and gave at least one reason (1981) Note: multiple responses allowed
Almost 1 in 6 English learners who had a child under the age of 16 living with them said they were taking a course to help their child at school (16%, equivalent to 7% of all
learners). Learners with children who felt that their ‘poor reading writing and speaking skills have held [them] back from getting on in life’ were more likely than those who did not feel this way to say they were attending a course to help their child at school (18%, compared with 12% of learners who disagreed with this statement), demonstrating a desire to assist their children to do better in life.
3% 2% 1% 3% 1% 8% 25% 27% 40% 19% 4% 1% 2% 3% 3% 7% 22% 24% 31% 32% 7% 1% 3% 3% 5% 7% 19% 19% 21% 45% Another Reason To pass a citizenship test Employer wanted you to Encouraged by a family member Requirement of job To help own child at school To help get a better job To help find work To improve everyday reading and writing Stepping stone to other training/ qualifications
43
Reasons for starting a maths course
As for English learners, a notable proportion of maths learners saw the course as a
stepping stone to other training or qualifications (41% overall). This is shown in Figure 3.3, and was particularly common amongst Level 2 learners (48%), as seen in Figure 3.4.
Figure 3.3 Reasons maths learners started a maths course
Base: Wave 1 learners who attended a maths course and gave at least one reason (1845)
Entry Level course participants were less likely to be employed (27%) than learners attending more advanced courses (45% of Level 1 and 46% of Level 2 course
participants), and were more likely to be taking the course (27%, compared with 22% of Level 1 and 17% of Level 2 learners).
41% 25%
21% 20% 8%
2% 2% 1%
6%
Stepping stone to other training/qualifications To improve ability to work with numbers To help find work To help get a better job To help own child at school
44
Figure 3.4 Reasons for starting a maths course
Base: Wave 1 learners who attended a maths course and gave at least one reason (1743) Note: multiple responses allowed
Learners who believed their ability to work with numbers when they needed to in daily life was 'below average' or 'poor' were more likely to say they were taking the course to improve their skills (35%, compared with 23% of other learners).
6% 1% 1% 1%
10%
21% 27%
31% 32%
5% 1%
3% 2%
9%
21% 22%
27%
40%
7% 2%
3% 3% 5%
19% 17%
19%
48%
Another Reason Employer wanted you to Encouraged by a family member Requirement of job To help own child at school To help get a better job To help find work To improve ability to work with numbers Stepping stone to other training/
qualifications
45
Course structure
English course structure
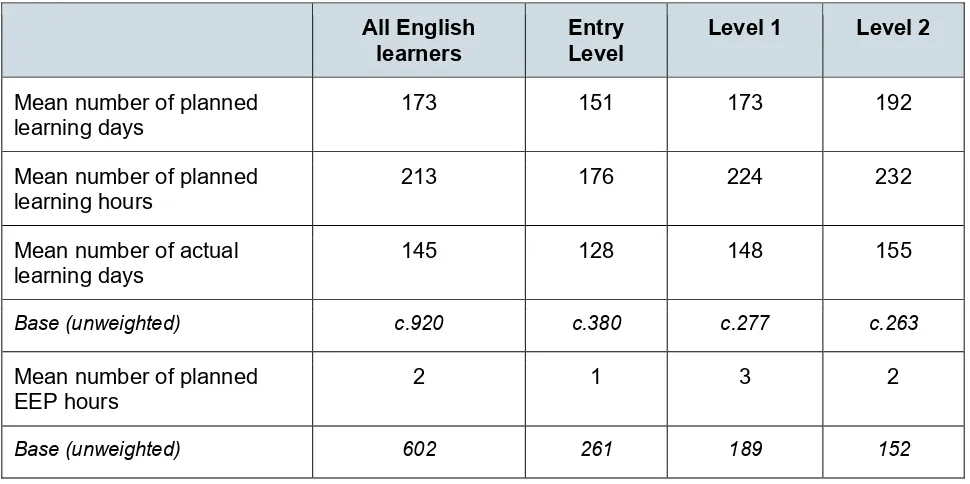
Number of learning hoursILR data was matched to survey data where a match was possible and the learner had agreed that their survey responses could be linked to administrative data.26 Table 3.3
below outlines the average number of planned learning days and hours, actual learning days and employability, enrichment and pastoral hours (EEP hours). Across all English learners, the average course lasted approximately 7 months or 173 learning days . There were no significant differences between course levels.
The mean number of planned learning hours was 213 hours, which approximately
[image:45.595.56.541.386.628.2]translates to 30 days based on a 7 hour working day. Entry Level courses tended to have a lower number of planned learning hours (151 on average, compared with 173 hours for Level 1 learners and 192 hours for Level 2 learners).
Table 3.3 Analysis of learner hours amongst English learners based on ILR data
All English
learners Entry Level Level 1 Level 2
Mean number of planned
learning days 173 151 173 192
Mean number of planned
learning hours 213 176 224 232
Mean number of actual
learning days 145 128 148 155
Base (unweighted) c.920 c.380 c.277 c.263
Mean number of planned
EEP hours 2 1 3 2
Base (unweighted) 602 261 189 152
46 Homework
Table 3.4 shows the number of hours of homework completed per week by learners
undertaking an English course. Thirteen per cent reported that they did no homework, with Level 2 learners less likely (9%) than Entry Level learners (14%) or Level 1 learners (15%) to report doing no homework. Conversely, around a fifth (22%) of all learners said they did 6 hours or more on average per week. Overall the mean amount of homework per week was 4.2 hours, although learners on Level 2 courses reported spending more time on homework than those on Entry Level courses. There were no significant differences
[image:46.595.57.541.276.494.2]between the amount of homework and attainment of qualification at the end of the course.
Table 3.4 Hours of homework per week completed by English learners – overall and by course level
All English
learners Entry Level Level 1 Level 2
% % % %
No homework 13 14 15 9
1 to 3 hours 49 49 50 48
4 to 5 hours 16 15 16 18
6 hours and more 22 21 19 25
Mean number of hours 4.2 3.9 4.0 4.8
47
Maths course structure
Course length and hours
As for English learners, analysis was conducted using administrative data from the ILR to look at average learning hours and course length. Table 3.5 shows the course length and hours for maths learners. Across all maths learners, the average number of days was 206, with no significant difference across course levels.
[image:47.595.53.542.315.556.2]The average number of planned learning hours was 217, which is approximately 31 working days based on a 7 hour day. Level 1 learners had the lowest number of learning hours on average (189 hours) compared with Entry Level learners (205 hours) and Level 2 learners (250 hours).
Table 3.5 Analysis of learner hours amongst maths learners based on ILR data
All maths
learners Entry Level Level 1 Level 2
Mean number of planned
learning days 206 198 200 216
Mean number of planned
learning hours 217 205 189 250
Mean number of actual
learning days 159 151 146 176
Base (unweighted) c.775 c.276 c.242 c.257
Mean number of planned
EEP hours 8 9 5 9
48 Homework
[image:48.595.58.540.270.479.2]Approximately 1 in 6 maths learners (16%) reported that they did no homework while on their course, although the majority of maths learners reported completing an average of between 1 and 3 hours of homework each week. There were no significant differences between amount of homework and attainment of qualification at the end of the course. Overall, the mean number of hours of homework each week was 3.8 hours. However, the number of hours spent on homework increased with course level, as shown in Table 3.6 below.
Table 3.6 Hours of homework per week completed by maths learners – overall and by course level All maths learners