Research Report DFE-RR230
Evaluation of Children’s
Centres in England
(ECCE)
Strand 1: First Survey of
Children’s Centre Leaders in the
Most Deprived Areas
E.Tanner, M.Agur, D. Hussey (NatCen
Social Research) & J.Hall with
P.Sammons, K.Sylva, T.Smith,
Content
U
Acknowledgements
U...5
U
Executive summary
U...6
U
Children’s CentresU... 6
U
The EvaluationU... 6
U
Aims and scope of Strand 1U... 6
U
Key findingsU... 7
U
1
U UIntroduction
U...11
U
1.1U UBackground to the evaluationU... 11
U
1.2U UAims and scope of Strand 1U... 12
U
1.3U UMethodologyU... 12
U
1.3.1U USamplingU... 12
U
Sampling frame and eligibility criteriaU... 13
U
Sampling for managers’ surveyU... 13
U
1.3.2U UQuestionnaire developmentU... 16
U
1.3.3U UModeU... 17
U
1.3.4U UProcedureU... 18
U
1.3.5U UResponseU... 19
U
1.4U UReport outlineU... 19
U
1.4.1U UTable conventionsU... 20
U
1.4.2U UIndicative estimates for confidence intervalsU... 20
U
2
U UGovernance, Management and Location
U...21
U
2.1U UKey findingsU... 21
U
2.2U UManagement and governance arrangementsU... 22
U
2.2.1U UAdvisory boardsU... 25
U
2.3U ULocationU... 27
U
2.4U UHistoryU... 30
U
3
U UChildren’s Centre Staff
U...31
U
3.1U UKey findingsU... 31
U
3.2U UNumber of staffU... 32
U
3.3U UStaff salariesU... 34
U
3.4U UStaff qualificationsU... 35
U
4
U UService Provision
U...38
U
4.1U UKey FindingsU... 38
U
4.2U UTypes of servicesU... 39
U
4.3U UNumber of staff delivering each type of serviceU... 43
U
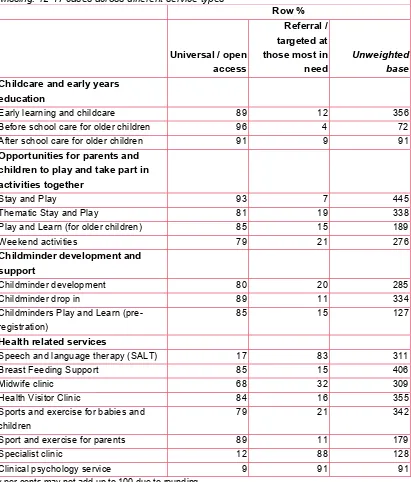
4.4U UWhether services were open access or by referralU... 45
U
[image:3.595.77.498.96.757.2]U
5
U UUsers and Evaluation
U...56
U
5.1U UKey FindingsU... 56
U
5.2U UPublicity methods and perceived effectivenessU... 57
U
5.3U UNumber of usersU... 58
U
5.4U USelf-evaluationU... 60
U
6
U UFinance
U...62
U
6.1U UKey findingsU... 62
U
6.2U UIncomeU... 63
U
6.3U UExpenditureU... 66
U
6.4U UCutsU...68
U
Appendix A
U UPossible typologies of provision
U...70
U
A.1 IntroductionU... 70
U
A.2 The Possibility of Underlying TypologiesU... 70
U
A.3 The ECCE Sub-Samples and Changing Characteristics of Sure Start Children’s CentresU... 77
U
A.4 Systematic Variations in the Reducing ECCE SampleU... 78
U
A.5 Summary and ConclusionsU... 80
U
Appendix B
U UFurther analysis to support Appendix A
U...81
U
Appendix C
U UAdvance letter
U...83
U
Appendix D
U UQualifications Helpsheet
U...85
U
Tables
Table 1.1 Sample broken down by lead organisation...14
Table 1.2 Questionnaire topics...16
Table 1.3 Typical 95% Confidence Interval examples for the children’s centre survey of leaders ...20
Table 2.1 Number of children’s centres managed by the leader ...22
Table 2.2 Organisations that manage the children’s centre ...22
Table 2.3 Type of educational institution that manage the children’s centre ...23
Table 2.4 Whether the managing organisation was selected as a result of a local authority commissioning process ...23
Table 2.5 Support received from the local authority ...24
Table 2.6 Whether the children’s centre amalgamated with another children’s centre in the last year ...24
Table 2.7 Whether the children’s centre had an advisory board ...25
Table 2.8 Advisory board set-up and arrangements ...25
Table 2.9 Interest groups represented on the advisory boards ...26
Table 2.10 Bodies to whom the advisory board reported ...26
Table 2.11 Bodies to whom the children’s centre leaders reported...27
Table 2.12 Deprivation level of area served by the children’s centre ...27
Table 2.13 Site arrangements of children’s centres ...28
Table 2.14 Locations of main site of children’s centres...28
Table 2.15 Services located in or close to the children’s centre...29
Table 2.16 Arrangements from which children’s centres developed ...30
Table 3.1 Proportion (%) of all staff within different categories ...32
Table 3.2 Number of staff at children’s centre...33
Table 3.3 Proportion (%) of staff employed by children’s centre within each annual salary category ...34
Table 3.4 Annual salary of staff employed children’s centre ...34
Table 3.5 Proportion (%) of staff employed by children’s centre within category of highest qualification level (relevant to post) ...35
Table 3.6 Highest qualification level (relevant to post) of staff employed by children’s centre ...35
Table 3.7 Qualifications of children’s centre leaders ...36
Table 3.8 Qualifications of staff employed by the children’s centre...37
Table 4.1 Whether children’s centres provided services directly or helped gain access ...39
Table 4.2 Types of services offered by the children’s centres...40
Table 4.3 Types of services offered by the children’s centres (continued)...41
Table 4.4 Types of sessions offered in early learning and childcare services...42
Table 4.5 Number of paid staff working in each type of service ...43
Table 4.6 Proportion (%) of all paid staff within different categories by type of service...44
Table 4.7 Proportion (%) of all paid staff within different categories by type of service (continued) ...45
Table 4.8 Open access or by referral – Childcare and early learning and health related services ...46
Table 4.9 Open access or by referral –Employment, adult education and family support related and other services...47
Table 4.10 Number of users in a month – Childcare and early education and health related services ...48
Table 4.11 Number of users in a month – Health, employment and benefits related services...49
Table 4.12 Evidence-based programmes which were delivered as part of the children’s centres ...51
Table 4.13 Target groups for children’s centre services...52
Table 4.14 Whether centres mentioned working with different organisations ...53
Table 4.15 Nature of the relationship between children’s centres and other organisations...54
Table 4.16 Ways in which different organisations were involved with the children’s centres ...55
Table 5.1 Methods of raising awareness used by children’s centres and perceived effectiveness ...57
Table 5.2 Number of families using children’s centre services in last 3 months...58
Table 5.3 Number of families using children’s centre services in last 3 months (by five categories)...58
Table 5.4 Percentage of children’s centre users with English as an Additional Language...58
Table 5.5 Percentage of children’s centre users with English as an Additional Language (by five categories) ...59
Table 5.6 Percentage of children’s centre users from an ethnic minority background ...59
Table 5.7 Percentage of children’s centre users from an ethnic minority background (by five categories) ...59
Table 5.8 Percentage of children’s centre users in last month using only childcare and early years services ...59
Table 5.9 Methods used to assess progress and performance of children’s centre...60
Table 5.10 Type of feedback sought from parents ...60
Table 6.8 Average capital expenditure per financial year (£) ...67
Table 6.9 Expenditure on employment costs and goods, materials and services in 2010-11 tax year (£) .67 Table 6.10 Amount spent in rent in 2010-11 tax year (£) ...67
Table 6.11 Whether rent was discounted or subsidised...67
Table 6.12 Whether children’s centre had to make cuts to services in 2010-11 ...68
42B
Acknowledgements
At NatCen Social Research we would like to thank in particular the following colleagues: Ruth Maisey for overall management of the ECCE project, Peyman Damestani and Alessio Fiacco for designing and maintaining the web and telephone survey instruments and Chris Massett and Sonia Shirvington for coordinating the team of telephone interviewers.
We are also grateful to members of the ECCE research team for their comments on the questionnaire and the report: Gillian Paull, Nicola Briggs and Matthew Bell at Frontier Economics and Jenny Good at the University of Oxford.
43B
Executive summary
This report is the first output from the Evaluation of Children’s Centres in England (ECCE), a six year study commissioned by the Department for Children Schools and Families (now the Department for Education) and undertaken by NatCen Social Research, the University of Oxford and Frontier Economics.
44B
Children’s Centres
Children's centres are intended to be one of the main vehicles for ensuring that integrated and good quality family services are located in accessible places and are welcoming to all. They aim to support young children and their families, particularly the most disadvantaged, to reduce inequalities in child development and school readiness. The mechanism for achieving this is through supporting children’s personal, social and emotional development, improving parenting aspirations and skills, providing access to good early education, and addressing family health and life chances.
45B
The Evaluation
The aim of ECCE is to provide an in-depth understanding of children’s centre services, including their effectiveness in relation to different management and delivery approaches and the cost of delivering different types of services. The key elements of the evaluation are outlined below.
• Strand 1: Survey of children’s centre leaders
• Strand 2: Survey of families using children’s centres
• Strand 3: Investigation of children’s centres’ service delivery, multiagency working and reach
• Strand 4: Impact analysis
• Strand 5: Cost benefit analysis
46B
Aims and scope of Strand 1
The aim of Strand 1 is to profile children’s centres in the most disadvantaged areas, providing estimates on different aspects of provision with which to select centres for subsequent stages of the evaluation and to explore different models of provision. The profile covers all key aspects of provision including management, staff, services, users and finance and involves close to 500 children’s centres, representative of all Phase 1 and 2 centres in the most disadvantaged areas.
47B
Key findings
Governance and management
• Fifty-eight per cent of leaders reported that they managed one centre; the remainder managed two or more centres and a minority (7%) managed more than four.
• The local authority was the lead organisation for the majority of children’s centres. Eighty-one per cent of centres were led by the local authority, schools or both. • Most centres (95%) had an advisory board which, in the majority of cases, met
once a term or once a quarter. The advisory boards represented a wide range of organisations.
Location
• Most centres (97%) had a main site. One third of these centres had a single central location; the remainder either had satellite sites that were part of the children’s centre or made regular use of other venues.
• A wide range of services were located in or close to the children’s centres, supporting the idea of children’s centres as being located in accessible places. The most frequently cited services were schools (90%), centre-based childcare and early learning (89%), a park or playground (88%) and health centre (88%).
History
• Half of the children’s centres in deprived areas had developed from Sure Start Local Programmes. Centres also frequently developed from community centres, Neighbourhood Nurseries and local authority maintained nursery schools. For 27 per cent of children’s centres, the centre was completely new.
Staff
• Over half of all the staff delivering services were employed by the children’s centre (29% full-time and 25% part-time). Staff employed by other organisations comprised 28 per cent and volunteers made up 18 per cent of staff.
• The average annual salary of staff was £15,001 - £20,000. The salaries were fairly normally distributed with a slight skew to the higher end. Three per cent of staff were paid over £40,000.
• Half of the staff (50%) were qualified to NVQ level 3 or equivalent, based on qualifications that were relevant to their post. Thirty-one per cent were qualified at a higher level and 11 per cent were qualified at a lower level. A minority (7%) had no qualifications relevant to their post.
• Professional qualifications most frequently held by staff other than the leader were Qualified Teacher Status (at least one staff member in 77% of centres), Early Years Foundation Degree (in 57% of centres), Early Years Professional Status (in 49% of centres) and Social Work (in 30% of centres).
Service provision
• Across different service types, children’s centres were more likely to provide services directly than help users gain access through sign-posting and referral. • Forty-six different types of services and programmes were offered by the centres. • The most frequently cited service was ‘Stay and Play’. Other services mentioned
by over 80 per cent of the leaders were home based services (99%), parent and family support classes or groups (93%), breast feeding support (91%), adult learning programmes (87%), parent forum (86%), evidence based parenting programmes (84%), health visitor clinic (82%) and early learning and childcare (82%).
• Among the centres providing early learning and childcare, the majority provided ‘full-time’ sessions (78%). Thirty-seven per cent offered part day sessions of less than four hours and 29 per cent offered longer part day session of four hours or more. A minority (9%) offered sessions outside of normal working hours.
• Children’s centres services were more often open to all rather than requiring referral. Services more likely to require referral were those offering specialist support, targeted at specific groups, and evidence based programmes.
• Services with the highest number of users were early learning and childcare services, and ‘stay and play’ programmes (average of 98 users in both cases). The services with the lowest numbers of users were employment and benefits advice, advice and information services and adult education.
• Forty-seven per cent of centres offered at least one evidence-based programme from those shortlisted in the Graham Allen review on early intervention. The most common programmes were ‘Incredible Years’, ‘Triple P’ and ‘Family Nurse Partnership’. A further 41 per cent mentioned other kinds of programmes and 12 per cent of centres did not offer any evidence-based programmes.
• The user groups regarded as a high priority by most centre leaders were workless households (96%), children between the ages of one and five (95%), new-borns and babies under 12 months (94%), children with special educational needs and lone parents (93%), teenage and young parents and expectant parents (92%) and fathers (90%).
Publicity
Users
• The average number of users of services in the previous three months was 337 with some centres reporting up to 4,000.
• Approximately one fifth (21%) of the service users spoke English as an additional language, and just over a quarter (27%) were from an ethnic minority background. • Twenty-eight per cent of the children’s centre users in the last month used only the
childcare and early years services.
Feedback and evaluation
• All leaders referred to obtaining feedback from parents to monitor progress and performance. Most centres also used a range of other methods for self-evaluation. • Outcomes for disadvantaged families were most often monitored through
assessing service usage and carrying out informal observational assessments.
Finance
• Children’s centres received resources from a variety of organisations with the local authority being the main provider (99% of centres). Centres were also supported by the NHS (35%), child development services (29%) and local charities and third sector organisations (each 24%).
• The local authority provided funding in all cases, but also provided staff, venues and materials to over half of the children’s centres. Most of the other organisations mentioned mainly provided staff.
• In terms of annual revenue, the local authority provided an average amount of close to £300K in 2010-11 and up to £3m for some children’s centres. Charging fees brought in an average revenue of close to £50k and partner agencies provided on average approximately £17k.
• The local authority was the sole funder for 37 per cent of centres. In most other cases, local authority funding was combined with funding from partner agencies and/or fees.
• The largest area of expenditure was employment costs. In 2010-11, children’s centres spent on average close to £300K on employment costs and a little under £100K on goods, materials and services.
Cuts
• The majority (60%) of leaders reported that no cuts had been made in 2010-11. Forty per cent reported that cuts had been made, reflecting the economic climate and budget reductions affecting local authority services more widely. No data was collected on the amount by which centre budgets had been reduced.
leader managed. This analysis will be extended further as more data are gathered through subsequent stages of the evaluation.
Summary and next stages of the evaluation
The survey provided a ‘snapshot’ of service provision in children’s centres in deprived areas in the summer/autumn of 2011. This report shows the changing environment in which children’s centres operate with 40 per cent experiencing recent cuts in services or staffing (in line with cuts to public services more generally), and many leaders managing two or more centres instead of one. The follow-up survey, due to be carried out in 2013, will monitor any changes in provision over the next two years.
1
0BIntroduction
1.1
6BBackground to the evaluation
This report is the first output from the Evaluation of Children’s Centres in England (ECCE), a six year study commissioned by the Department for Children Schools and Families (now the Department for Education) and undertaken by NatCen Social Research, the University of Oxford and Frontier Economics.
Children’s centres are intended to be one of the main vehicles for ensuring that integrated and good quality family services are located in accessible places and are welcoming to all. They aim to support young children and their families, particularly the most disadvantaged, to reduce inequalities in child development and school readiness, ‘narrowing the gap’ in children’s outcomes between rich and poor. The mechanism for achieving this is through supporting children’s personal, social and emotional development, improving parenting aspirations and skills, providing access to good early education, and addressing family health and life chances.
The aim of ECCE is to provide an in-depth understanding of children’s centre services, including their effectiveness in relation to different management and delivery approaches and the cost of delivering different types of services. The key elements of the evaluation are outlined below.
• Strand 1: Survey of children’s centre leaders
• Strand 2: Survey of families using children’s centres. Families from approximately 120 of the centres interviewed for Strand 1 will be interviewed for the first time when their child is 9-18 months old and will be asked about service use, family circumstances, health and well-being. Families will be interviewed again when their children are two and three years old, creating a profile of children’s development over time.
• Strand 3: Investigation of children’s centres’ service delivery, multiagency working and reach. The research team will visit the 120 children's centres for three full days to find out more about the services on offer. These visits will assess:
• the range of activities and services centres deliver; • leadership;
• evidence-based practice; • parenting support services; and • partnership working.
old and later when they are five years old?”. This question will initially be explored by examining the information generated on provision and use of services. An additional stage of the impact research will use children’s Foundation Stage Profile results to assess the effect of children’s centres on school readiness at age five.
• Strand 5: Cost benefit analysis. Lastly, the research team will conduct economic case studies in 24 children’s centres which will ask about the costs of delivering different services. This information will be combined with data from other elements of the evaluation to assess the effectiveness and benefits of children’s centres in relation to cost.
1.2
7BAims and scope of Strand 1
The aim of Strand 1 is to profile children’s centres in the most disadvantaged areas, providing estimates on different aspects of provision with which to select centres for subsequent stages of the evaluation and to explore different models of provision. The profile covers all key aspects of provision including management, staff, services, users and finance and involves close to 500 children’s centres, representative of all Phase 1 and 2 centresF
1 F
in the most disadvantaged areas. The follow-up survey, due to be carried out in 2013, will monitor any changes in provision.
There are two reasons for focusing on children’s centres in the most disadvantaged areas: first, because this is where the greatest policy interest lies; and second, because it is in these areas that we would expect the needs of families to be greatest and consequently for children’s centres to have the greatest impact. The estimates in this report therefore apply to a particular subset of children’s centres in deprived areas rather than all children’s centres.
1.3
8BMethodology
1.3.1
34BSampling
ECCE is based on a nested design whereby the children’s centres participating in Strands 2 to 5 are sampled from the centres that responded to the initial survey of leaders (Strand 1). In summary, the approach was as follows:
• We selected a random stratified sample of 850 centres for the centre managers’ survey from the list of those eligible.
• From the responding sample, we then selected a sub-sample of 300 centres and invited them to recruit their users for the evaluation. The stratification variables were: lead organisation, whether the centre had made cuts to services in 2010-11 and whether the centre offered at least one Evidence Based Programme. All health led centres that responded to the Strand 1 survey were included.
• We selected a sub-sample of 120 centres (plus 30 held in reserve) from the centres that successfully recruited users for the evaluation for subsequent stages of the evaluation.
Figure 1.1 provides a graphical illustration of the ECCE sampling strategy. The following section describes the sampling process for Strand 1 in more detail.
48B
Sampling frame and eligibility criteria
The sample frame for ECCE was a database of children’s centres maintained by Together for Children at the time of sampling (and later passed to EC Harris). To be eligible for the evaluation, children’s centres had to meet the following criteria:
• Phase 1 or 2 centres
• Located in the 30 per cent most deprived areasF 2
• Designated for 2 years by the start of fieldwork
• Implemented the Full Core Offer of services at least 3 months before the start of fieldwork
Applying these criteria to the 3,629 children’s centres in the database resulted in 1,721 eligible children’s centres in 2011. (Note that all centres that met the first two criteria also met the third and fourth.)
We conducted a scoping study, cognitive pilot and dress rehearsal pilot during the design stages of the evaluation that took place in 2010. These centres were not included in the sampling frame for the main surveys in 2011. (A total of 76 centres were used in piloting; 73 of these were theoretically eligible for fieldwork and therefore excluded from the sampling frame). The final sample frame therefore comprised 1,648 centres.
49B
Sampling for managers’ survey
We sampled a total of 850 children’s centres for the Strand 1 survey. The sample was stratified by:
• Lead organisation • Catchment size quintile • Urban or rural
• Catchment number
Within each stratum of lead organisation, we over-sampled larger centres relative to smaller centres for two reasons. First, to make the sampling more efficient by sampling centres in proportion to size and enabling us to sample equal numbers in the larger centres at the second stage. Secondly, to make sure we had enough large centres to provide a sample of users of sufficient size. As we did not have information on the number of parents (as a measure of size), the size of the catchment area was used as a proxy. We created quintiles of catchment area size within each of the five main strata, and children’s centres were further stratified into five sub-strata using these quintiles.
We weighted centres in the largest quintile so that they had a three times greater chance of selection than those in the smallest quintile, with an equal step-increase in probability between successive strata (i.e. weights were 1, 1.5, 2, 2.5 and 3). Sampling was then carried out in proportion to these weights, with sampling fractions calculated to produce the numbers in the table above.
Table 1.1 Sample broken down by lead organisation
Lead organisation (according to the TfC database)
Eligible centres Excluding pilot
Sampled
No information/ Unclear 112 108 54
Private/ Voluntary/ Independent (PVI)I 251 240 121
Local authority 914 873 440
Primary Care Trust (PCT) 43 42 42
Nursery/ School/ College 401 385 193
Sub-sample
59% eligibility rate
Sub-sample
Sub-sample
1,648 eligible children’s centres post piloting
850 issued for children’s centre manager survey
504 achieved & eligible from children’s centre manager
300 issued for user sampling
167 achieved & eligible from user sampling
A core 120 that form the basis of strands 2, 3 & 4
56% eligibility rate
10,187 users issued for user survey
5,717 users achieved from user survey 21 achieved but quite incomplete
5 achieved too late*
14 achieved but too small 8 achieved too late
1,721 eligible children’s centres nationally
73 children’s centres used for piloting
8 extras for strands 2, 3, 4 & 5 22 extras for strands 3 & 5
12 form basis of strand 5
U
To be eligible:U Phase 1 or 2 centre; in a 30% most deprived area; designated for min. 2 years before fieldwork; running Full Core Offer for 3+ months before fieldwork
U
Stratified by:U Lead Organisation; Catchment size quintile; Urban/rural; Catchment number
U
Stratified by:U Lead Organisation; 2010/11 cuts to children’s services; Runs 1+ EBP
[image:17.595.26.563.115.711.2]+ selected all 28 NHS led centres (either solely or in combination)
1.3.2
35BQuestionnaire development
We developed the questionnaire in Blaise, a software programme for computer assisted interviewing (CAI) techniques, covering the following topics.
Section Topics included
Management & governance Number of centres led by manager Lead organisation
Advisory board
Site arrangements & location Area deprivation
Previous arrangements from which centres developed
Staff Number of staff: full-time, part-time, voluntary.
Staff salaries
Staff and leader qualifications
Services Services provided directly or through sign-posting/referral.
Where services were provided
Whether services are universal or targeted Evidence based programmes
Target groups
Relationships with organisations
Users and ongoing evaluation Publicity methods and perceived effectiveness Number of users in different categories Self-evaluation and Ofsted inspections
Finance Income: amount from different sources, value of assets
Expenditure: set-up costs, ongoing expenditure, capital expenditure
Recent cuts to services
We developed the questionnaire in collaboration with the ECCE team and DfE and tested through pilots conducted both before and after the redesign of the project in early 2011.
• We carried out a cognitive pilot in November 2009 with approximately 10 children’s centre managers to test whether the questions were understood in the way they were intended and assess whether respondents were able to answer the questions.
• We carried out a pilot in February/March 2010 with an issued sample of 50 children’s centres. Eighteen full or partial responses were achieved. Respondents raised concerns over the length of the questionnaire and in particular the length of the section asking about services. Respondents also reported difficulty in answering the finance questions. Following the pilot, we reduced the length of the questionnaire considerably.
• Following the redesign of the project in 2011, we carried out user testing with a small number of children’s centre managers focusing on the design of the web
survey instrument. We took on board the comments arising from testing by the ECCE team and DfE.
We asked children’s centre leaders to provide detailed information throughout the questionnaire, including numbers of service users, staff qualifications and financial information. We asked respondents to be as accurate as possible, but encouraged them to provide estimates where the actual figures were not known. This should be borne in mind when interpreting the data.
1.3.3
36BMode
We delivered the questionnaire by means of a sequential mixed methods survey, leading with self-completion on the internet and then offering an interviewer-administered option by telephone for non-respondents and to follow-up on unanswered questions. The rationale for offering more than one approach was to maximise:
• cost-effectiveness. Web surveys are relatively cheap to administer.
• population coverage, recognising that not all the respondents may have easy access to the internet to complete the web survey, but all would have access to a telephone.
• the response rate. Web surveys (like postal surveys) generally have lower levels of response than interviewer administered modes.
• flexibility in completion. In many ways a web survey approach was best suited to the nature of the questions, many of which required respondents to find the information from data records or colleagues. Telephone is also a flexible option, with the interviewers able to make appointments at different times of the day and across different days of the week to suit the respondent.
The same Blaise programme was used by both the web survey and the telephone survey, ensuring that the same questions were asked with both modes and facilitating the production of one dataset. The respondent’s progress in completing the web survey (i.e., whether or not they had logged in and if so, the extent of completion) was automatically monitored so that when contact was made by telephone interviewers, the introductory text was tailored to the respondent’s level of activity on the survey. The interviewer then completed the survey using the same web instrument that was available to the respondent. The questions were designed so that they could be delivered orally as well as visually, with the interviewer briefing focusing on the questions that were less well suited to the telephone.
Overall, 65 per cent of the productive cases were completed fully by web survey and 35 per cent were completed either partially or fully over the telephone (in most cases fully). The cases completed fully by web with no prompting from an interviewer had a significantly higher rate of item non-response. Of the 50 questions asked of all respondents, those responding fully by web answered an average of 34 questions compared to 49 questions for those responding by telephone.
We carried out checks to assess whether responses were related to mode on key variables. Mode was not related to the number of centres managed by the respondent, cuts to services, or the amount of funding from different sources. Where responses were related to mode it seems more likely that the characteristics of the centres influenced the mode of response rather than mode affecting the answers given. Assuming this is the case, centres with an advisory board, with satellite sites or use of other venues were more likely to respond by telephone. Centres led by the local authority, with one central location for service delivery or smaller in terms of the number of users were more likely to respond by web.
1.3.4
37BProcedure
Fieldwork took place between mid July and the end of September 2011. The following procedure was followed for launching the web and telephone survey.
• Advance letters (Appendix A) containing the password for accessing the web survey were sent out by post to all 850 children’s centre leaders on July 11th along with supporting documents (Appendices B and C).
• The web survey went live on July 12th.
• Emails were sent out to all leaders (excluding the password for data security reasons) on July 13th.
• Further emails were sent on July 15th in cases where the initial email had bounced and an alternative was found.
• Reminders were sent out on July 25th and 26th by email where the addresses appeared correct and by post for the remainder.
• Telephone fieldwork began on August 1st.
We made cases available to the telephone interviewers if the children’s centre leader had: • Not yet started the web survey
• Started but not completed the web survey
• Indicated they had completed all they could but had left some key questions unanswered.
The role of the telephone interviewers was to:
• Respond to questions about the web survey
• Check whether the leader was willing to complete the survey online • Offer to help them complete the survey by means of telephone interview.
1.3.5
38BResponse
The final response rate was 60 per cent (509 surveys out of an issued sample of 850). Achieving this response rate proved to be challenging for the following reasons:
• Incorrect or out of date contact details on the database of children’s centres. • The length of the questionnaire.
• Complexity of certain questions, particularly those relating to finance. • Leaders absent during the summer holiday period.
In response, the following strategies were put in place:
• Extension of the fieldwork period by one month.
• Additional telephone interviewers and encouraging completion by phone. • Launching a shorter version for those unwilling to complete the full survey.
In total, 9 per cent (44 of the 509 respondents) completed the shorter version of the survey.F
3
For the 509 cases on whom this report is based, the extent of item non-response varied throughout the questionnaire. Overall, the completion rate was lowest for the questions that children’s centres could not easily answer including the qualifications of staff, the number of users in different categories and income and expenditure. Based on the comments of children’s centre leaders, the difficulties faced were partly due to the structure of children’s centres, particularly where centres had amalgamated or where resources were shared across centres.
1.4
9BReport outline
The remaining chapters of this report provide summary statistics on each topic of the questionnaire. Appendix 1 presents exploratory analysis to investigate whether children’s centres can be grouped into different types.
1.4.1
39BTable conventions
• Throughout the report, percentages based on fewer than 50 cases are enclosed in square brackets, and should be interpreted with caution.
• All percentages and means are weighted, and the unweighted base population is shown in each table.
• Percentages are rounded up or down to whole numbers and therefore may not always sum to 100.
• Where more than one answer could apply, this is indicated under the table. • Percentages less than 0.5 (but greater than 0) are shown as ‘*’.
1.4.2
40BIndicative estimates for confidence intervals
Confidence intervals are a measure of precision, indicating the range around the survey estimates within which the true population value is likely to fall. A 95 per cent confidence interval is constructed in such a way that 95 times out of 100 it captures the true population value within the upper and lower limits.
X
Table 1.3X shows the confidence intervals expected for estimates based on different sample sizes for the survey of children’s centre leaders. The estimates take into account the complex sample design and are based on a typical design effect of 1.3.F
4
For example, an estimate of 30 per cent where the base is n=500, has a confidence interval of + or - 4.6%, hence the true value is within the range of 25.4 to 34.6 per cent.
Table 1.3 Typical 95% Confidence Interval examples for the children’s centre survey of leaders
Survey estimate
Sample size 10% or 90% 30% or 70% 50%
100 6.7 10.2 11.2
200 4.7 7.2 7.9
300 3.9 5.9 6.5
400 3.4 5.1 5.6
500 3.0 4.6 5.0
Figures are based on a typical design effect of 1.3
2
1BGovernance, Management and
Location
This chapter focuses on the characteristics of governance and management of children’s centres. It also explores the accessibility and location of the children’s centres and the arrangements from which they developed.
2.1
10BKey findings
• Fifty-eight per cent of leaders reported that they managed one centre; the remainder managed two or more centres and a minority (7%) managed more than four.
• The local authority was the lead organisation for the majority of children’s centres. 81 per cent of centres were led by the local authority, schools or both.
• Most centres (95%) had an advisory board which, in the majority of cases, met once a term or once a quarter. The advisory boards represented a wide range of organisations.
• Most centres (97%) had a main site. One third of these centres had a single central location; the remainder either had satellite sites that were part of the children’s centre or made regular use of other venues.
• A wide range of services were located in or close to the children’s centre, supporting the idea of children’s centres as being located in accessible places. The most frequently cited services were schools (90%), centre-based childcare and early learning (89%), a park or playground (88%) and health centre (88%). • Half of the children’s centres in deprived areas had developed from Sure Start
2.2
11BManagement and governance arrangements
The management and governance arrangements of children’s centres were extremely varied. A little over half of the leaders who responded to the survey (58%) reported that they managed one centre; the remainder managed two or more centres and a minority (7%) managed more than four (XTable 2.1X).
Table 2.1 Number of children’s centres managed by the leader
Base: Responding sample (509). Missing cases: 2.
Number of children’s centres Column %
One 58
Two 21
Three 10
Four 5
More than four 7
Unweighted base 507
The local authority (LA) was the main lead organisation of children’s centres (69 %) (XTable 2.2X). Maintained nurseries, schools, Academies and colleges, mentioned by 18 per cent, could also be considered to fall under the ‘local authority’ and 81 per cent mentioned the local authority, schools or both. The range of other organisations leading children’s centres reflected the diversity of provision, including third sector organisations, health-led providers and private providers. The majority of centres (87%) were led by one organisation and the remainder led by up to four organisations.
Table 2.2 Organisations that manage the children’s centre
Base: Responding sample (509). Missing cases: 2.
Type of organisation Column %
Local authority 69
Maintained nursery, school, Academy or college 18
National charity or voluntary organisation 9
Local charity, voluntary or community organisation 9
NHS organisations 4
Private or independent providers 3
Social enterprise or mutual 2
Unweighted base 507
X
Table 2.3X shows the breakdown of the types of educational institutions that managed children’s centres. There was a fairly even split between maintained primary schools and maintained nursery schools with a minority led by other types of schools and colleges.
Table 2.3 Type of educational institution that manage the children’s centre
Base: Centres that mentioned a maintained nursery, school, Academy or college as their lead organisation (98).
Missing cases: 2.
Type of educational institute Column %
Maintained primary school 49
Maintained nursery school 46
Further education college 2
Academy 1
Other educational institute 3
Unweighted base 96
For just over half of the children’s centres that were led by an organisation other than the local authority, the lead organisation was selected as a result of a local authority commissioning process (XTable 2.4X).
Table 2.4 Whether the managing organisation was selected as a result of a local authority commissioning process
Base: Centres that were not managed by the local authority as their lead organisation (228). Missing cases: 22.
Response Column %
Yes 56
No 44
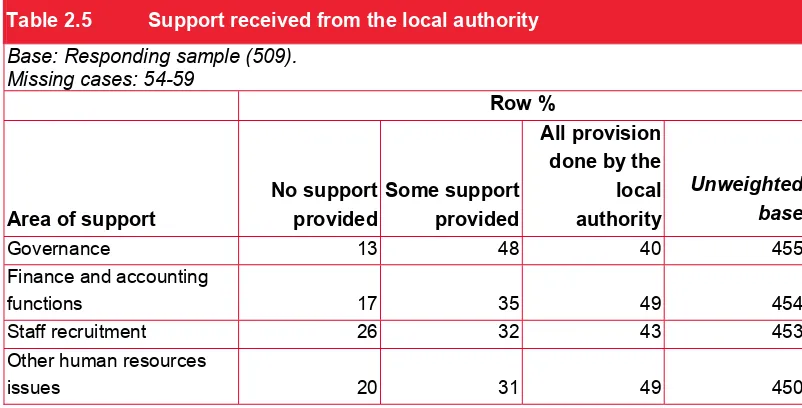
For the majority of children’s centres in deprived areas, the local authority provided support across a range of areas (XTable 2.5X). In terms of governance, the local authority provided some support to 48 per cent of centres and took full responsibility in a further 40 per cent of centres. In the areas of finance and human resource issues (other than recruitment), the local authority carried out all provision for nearly half of the children’s centres (49% in each case).
[image:26.595.95.496.263.467.2]Clearly there was considerable overlap between these four areas in which the local authority provided support. A minority of leaders (7% of the responding sample) reported that their centres did not receive support from the local authority in any of the above areas.
Table 2.5 Support received from the local authority
Base: Responding sample (509). Missing cases: 54-59
Row %
Area of support
No support provided
Some support provided
All provision done by the local authority
Unweighted base
Governance 13 48 40 455
Finance and accounting
functions 17 35 49 454
Staff recruitment 26 32 43 453
Other human resources
issues 20 31 49 450
A small minority of leaders reported that their children’s centre had amalgamated with another during the last year (XTable 2.6X). The follow-up survey will also include this question to monitor any change over time.
Table 2.6 Whether the children’s centre amalgamated with another children’s centre in the last year
Base: Responding sample (509). Missing cases: 1.
Response Column %
Yes 6
No 94
2.2.1
41BAdvisory boards
Most of the leaders (95%) reported that their children’s centre had an advisory board to assist with governance (XTable 2.7X). Subsequent questions about the advisory report were asked of this subsample.
Table 2.7 Whether the children’s centre had an advisory board
Base: Responding sample (509). Missing cases: 49.
Response Column %
Yes 95
No 5
Unweighted base 460
For most of the centres, the advisory board had been in place for at least one year (XTable 2.8X). Most advisory boards met either once a quarter (46%) or once a term (39%). A minority (7%) met much more frequently – once a month. The majority of leaders (60%) reported that the advisory board for their centre worked with just one children’s centre. Of the remainder, 35 per cent oversaw a cluster or linked group of children’s centres.
Table 2.8 Advisory board set-up and arrangements
Base: Centres that had an advisory board (435). Missing cases: 1.
How long the advisory board has been in place Column %
Less than a year 13
Between one and two years 29
More than two years 59
Unweighted base 435
How often the advisory board meets
Once a month 7
Once a term 39
Once every quarter 46
Once every six months 1
Other 8
Unweighted base 434
How the advisory board operates
The advisory board oversees the one children’s centre
only 60
The advisory board oversees a cluster/linked group of
children’s centres 35
The advisory board oversees the children’s centre and
another organisation 3
The interest groups represented on the advisory boards were numerous and diverse. Over 90 per cent of respondents mentioned parents and children’s centre staff. Other representatives spanned health, education, local authority, childcare providers, third sector and private organisations and many others.
Table 2.9 Interest groups represented on the advisory boards
Base: Centres that had an advisory board (435). Missing cases: 2.
Groups on advisory board Column %
Parents/expectant parents 94
Children’s Centre staff 93
Health professionals 89
Educational institutions 87
Local authority 74
Other local professionals or practitioners 63
Local charities, voluntary or community organisations 63
Private providers 54
Childminder representatives 52
Jobcentre Plus 48
Social care services 47
Local and/or parish councillors 41
Child development services 41
National charities or voluntary organisations 36
Other representatives 30
Police or Youth Justice system 25
Child and Adolescent Mental Health Services 6
Drug and Alcohol teams 4
Unweighted base 433
Percentages do not add up to 100 as more than one answer could apply.
Table 2.10 Bodies to whom the advisory board reported
Base: Centres that had an advisory board (435). Missing cases: 4.
Bodies to whom the board reported Column %
Local authority co-ordinator 43
Children’s centre leader 41
School governing body 27
Head of the lead organisation 16
Executive committee / board of directors 6
Health organisation 2
Other 7
Unweighted base 431
For the minority of centres that did not have an advisory board, the centre leader most frequently reported to a school governing body or a local authority coordinator (XTable 2.11X).
Table 2.11 Bodies to whom the children’s centre leaders reported
Base: Centres that did not have an advisory board (25). Missing cases: 0.
Bodies to whom the leaders reported Column %
School governing body [74]
Local authority co-ordinator [43]
Executive committee / board of directors [15]
Head of the lead organisation [9]
Health organisation [3]
Other [7]
Unweighted base 25
Percentages do not add up to 100 as more than one answer could apply.
2.3
12BLocation
As explained above (Section X1.3.1X), all the children’s centres sampled for Strand 1 were categorised on the Together for Children (TfC) database as serving families within the 30 per cent most deprived areas. A question was asked in the survey to check the perception of the leaders and nine per cent reported that their centre did not serve a deprived area. This discrepancy may reflect changes in the catchment area since the TfC database was compiled or may be due to different understandings of the catchment area.
Table 2.12 Deprivation level of area served by the children’s centre
Base: Responding sample (509). Missing cases: 6.
Deprivation level Column %
30% most deprived area 91
70% least deprived area 9
Nearly all the children’s centres (97%) had a main site, defined as the place at which most of the services were delivered, where the leader was based and the address for enquiries and mail (XTable 2.13X). Just over one third (34%) of the centres had a single central location; the remainder either had satellite sites that were part of the children’s centre or made regular use of other venues.
Table 2.13 Site arrangements of children’s centres
Base: Responding sample (509). Missing cases: 4.
Site arrangements Column %
Main site: with other regular venues that are not part of the children’s centre
34
Main site: services are delivered from a single, central location
32
Main site: with one or more satellite sites that are part of the children’s centre
31
Main site: with satellite sites and other venues 2
No main site: services are delivered from a range of different locations
1
Unweighted base 505
Approximately one-third (31%) of the centres that had a main site identified this as a building for the children’s centre sole use. Other main sites were frequently located in educational institutions; schools or colleges (mostly primary schools) (36%) or on the site of a nursery (19%).
Table 2.14 Locations of main site of children’s centres
Base: Centres that operated from a main site (495). Missing cases: 41.
Locations of children’s centres Column %
School or college site 36
Building for the children’s centre sole use 31
Nursery site 19
Community centre 4
Integrated location with other community services 4
Library 2
Surgery, health centre or walk in centre 1
Church hall or another faith venue 1
Other (Academy, mobile location, hospital) 2
Children’s centres are intended to be located in accessible places and easy access to other services that would often be used by families provides an indication of this (XTable 2.15X). We asked leaders to select which other services were located either in or close to the children’s centre, defined as within pram-pushing distance or a 15-20 minute walk. The most frequently cited services were schools (90%), centre-based childcare and early learning (89%), a park or playground (88%) and health centre (88%). A wide range of other services were also mentioned by a sizeable proportion of leaders.
Table 2.15 Services located in or close to the children’s centre
Base: Responding sample (509). Missing cases: 47.
Type of service Column %
School, Academy or college 90
Centre-based childcare or early learning for under 5s 89
Park or playground 88
Surgery, health centre or walk-in centre 88
Playgroup 80
Library 76
Community centre 67
Child development services 52
Other family services 51
Other children’s centres 49
Jobcentre Plus office 41
Social care office 28
Hospital 21
Polyclinic 3
None of the above 1
Unweighted base 462
2.4
13BHistory
Half of the children’s centres in deprived areas had developed from Sure Start Local Programmes (XTable 2.16X). Other arrangements commonly cited were community centres (coded post-hoc from ‘other’ open responses), Neighbourhood Nurseries and local authority maintained nursery schools. For 27 per cent of children’s centres, the centre was completely new.
Table 2.16 Arrangements from which children’s centres developed
Base: Responding sample (509). Missing cases: 47.
Type of arrangement Column %
Sure Start Local Programme (SSLP) 50
Community centre 29
Neighbourhood Nursery (NN) 14
Local authority maintained nursery school 13
Integrated centre 9
Local authority family centre or day nursery 8
Voluntary sector family centre or day nursery 6
Early Excellence Centre (EEC) 6
PCT / health centre 4
Nursery class in a primary school 3
None of these: the children’s centre was completely new 27
Unweighted base 462
3
2BChildren’s Centre Staff
This chapter reports on three aspects of staffing at children’s centres in deprived areas – the number of staff, salaries and qualifications.
3.1
14BKey findings
• Over half of all the staff delivering services were employed by the children’s centre (29% full-time and 25% part-time). Staff employed by other organisations comprised 28 per cent and volunteers made up 18 per cent of staff.
• The average annual salary of staff was £15,001 - £20,000. The salaries were fairly normally distributed with a slight skew to the higher end. Three per cent of staff were paid over £40,000.
• Half of the staff (50%) were qualified to NVQ level 3 or equivalent, based on qualifications that were relevant to their post. Thirty-one per cent were qualified at a higher level and 11 per cent were qualified at a lower level. A minority (7%) had no qualifications relevant to their post.
• Sixty-three per cent of leaders had achieved the National Professional
Qualification for Integrated Centre Leadership (NPQICL) and a further 10 per cent were working towards it. Other achieved professional qualifications included Qualified Teacher Status (27%), Social Work (15%) and the Early Years Foundation Degree (15%).
3.2
15BNumber of staff
The survey asked for the number of staff in six categories: those employed by the children’s centre, those working at the children’s centre and employed by other organisations and volunteers (full-time and part-time in each case). The following tables present the number of staff in different ways but the key finding in both cases is that on average, the highest proportion of staff were employed by the children’s centre, with smaller proportions employed by other organisations and offering their services as volunteers.
X
Table 3.1X shows the distribution of all staff working in the participating children’s centres across the different categories. Over half of all the staff delivering services were employed by the children’s centre (29% full-time and 25% part-time). Staff employed by other organisations comprised 28 per cent and volunteers made up 18 per cent of staff. Staff employed by the children’s centre were more likely to work full-time than part-time, whereas the opposite was true for those employed by other organisations and particularly for volunteers.
The children’s centre leaders reported a total of 13,859 staff members across the responding centres, an average of 27 per children’s centre.
Table 3.1 Proportion (%) of all staff within different categories
Base: Total staff employed by CC in responding CC (509). Missing cases (CC): 5.
Categories of staff Column %
Staff employed by CC full-time 29
Staff employed by CC part-time 25
Staff employed by other organisations full-time 11
Staff employed by other organisations part-time 17
Full-time volunteers 1
Part-time volunteers 17
X
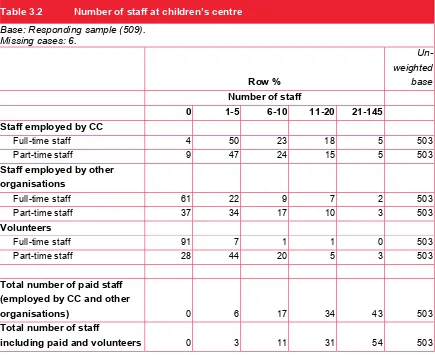
Table 3.2X provides more detail about the number of staff in each category. Half the children’s centres had between one and five full-time staff employed by the children’s centre and a similar proportion had the same number of part-time staff (47%). The highest number of staff employed by children’s centres was 41 for full-time staff and 43 for part-time staff.
On average, children’s centres had fewer staff employed by other organisations. Over half the centres had no full-time staff in this category and 37 per cent of centres had no part-time staff employed by other organisations. Overall, children’s centres had more part-part-time staff than full-time staff employed by other organisations. The contrast between full-time and part-time was even stronger for volunteers. The majority of centres (72%) had some part-time volunteers compared to 9 per cent of centres having full-time volunteers. XTable 3.2X also shows the number of paid staff and the number of all staff including volunteers.
Table 3.2 Number of staff at children’s centre
Base: Responding sample (509). Missing cases: 6.
Row %
Un-weighted
base Number of staff
0 1-5 6-10 11-20 21-145
Staff employed by CC
Full-time staff 4 50 23 18 5 503
Part-time staff 9 47 24 15 5 503
Staff employed by other organisations
Full-time staff 61 22 9 7 2 503
Part-time staff 37 34 17 10 3 503
Volunteers
Full-time staff 91 7 1 1 0 503
Part-time staff 28 44 20 5 3 503
Total number of paid staff (employed by CC and other
organisations) 0 6 17 34 43 503
Total number of staff
3.3
16BStaff salaries
X
Table 3.3X shows the distribution of staff across the salary groups with proportions calculated based on the total number of staff for whom centre leaders have provided salary information (6,748, which is substantially lower than the total number of staff reported in XTable 3.1X). The average annual salary was £15,001 - £20,000. The salaries were fairly normally distributed with a slight skew to the higher end. Three per cent of staff were paid over £40,000.
Table 3.3 Proportion (%) of staff employed by children’s centre within each annual salary category
Base: Total staff employed by CC in responding CC (502). Missing cases (CC): 30.
Salary groups Column %
Up to £5,000 5
£5,001-£10,000 11
£10,001-£15,000 18
£15,001-£20,000 30
£20,001-£25,000 18
£25,001-£30,000 8
£30,001-£40,000 7
Over £40,000 3
Total staff across CC for whom salary information
provided (unweighted) 6748
[image:36.595.79.524.538.748.2]X
Table 3.4X provides more detail on the number of staff paid at different levels. One quarter of centres had upwards of six staff paid 15,001 - £20,000. At the extremes, 21 per cent of centres had staff paid at the lowest level and 28 per cent of centres had between one and five staff paid over £40,000.
Table 3.4 Annual salary of staff employed children’s centre
Base: Total staff employed by CC in responding CC (502). Missing cases (CC): 30.
Row %
Unweighted base Number of staff
Salary groups 0 1-5 6-10 11-50
Up to £5,000 79 17 4 * 472
£5,001-£10,000 59 32 7 2 472
£10,001-£15,000 34 53 9 5 472
£15,001-£20,000 19 56 14 11 472
£20,001-£25,000 26 64 9 2 472
£25,001-£30,000 45 52 2 * 472
£30,001-£40,000 37 63 * * 472
3.4
17BStaff qualifications
[image:37.595.81.519.574.790.2]We asked centre leaders to indicate the highest qualification levels of the staff employed by the children’s centre (taking into account qualifications relevant to their post at the children’s centre). Half of the staff (50%) were qualified to NVQ level 3 or equivalent (XTable 3.5X). Thirty-one per cent were qualified at a higher level and 11 per cent were qualified at a lower level. A minority (7%) had no qualifications relevant to their post. These calculations are based on the total number of staff for whom qualifications (or lack thereof) were reported.
Table 3.5 Proportion (%) of staff employed by children’s centre within category of highest qualification level (relevant to post)
Base: Total staff employed by CC in responding CC (502). Missing cases (CC): 75.
Highest qualification level Column %
No relevant qualification 7
NVQ1 or equivalent 2
NVQ2 or equivalent 9
NVQ3 or equivalent 50
NVQ4 or equivalent 8
NVQ5 or equivalent 6
NVQ6 or equivalent 9
Above NVQ6 or equivalent 8
Total staff across children’s centres for whom
qualification information provided (unweighted) 6056
The concentration of staff at NVQ level 3 is also demonstrated in XTable 3.6X. Also worthy of note is that nearly two-thirds of centres (65%) had some staff employed at the highest level – above NVQ level 6 or equivalent. This would include relevant Masters degrees (e.g., in early years or social work) and the PGCE teacher qualification.
Table 3.6 Highest qualification level (relevant to post) of staff employed by children’s centre
Base: Total staff employed by CC in responding CC (502). Missing cases (CC): 75.
Row %
Unweighted base Number of staff
Highest qualification
level 0 1-5 6-10 11-50
No relevant qualification 69 27 2 1 427
NVQ1 or equivalent 87 12 1 * 427
NVQ2 or equivalent 51 44 4 1 427
Focusing on professional qualifications, 63 per cent of children’s centre leaders had achieved the National Professional Qualification for Integrated Centre Leadership (NPQICL) and a further 10 per cent were working towards it (XTable 3.7X). Other qualification types were reported by a much lower proportion of leaders: 27 per cent were qualified teachers, 15 per cent had a social work qualification and 15 per cent held the Early Years Foundation Degree.
Table 3.7 Qualifications of children’s centre leaders
Base: Responding sample (509). Missing cases: 31
Row %
Un-weighted
base
Qualification Achieved
Working towards
Neither / Don’t know
National Professional Qualification for
Integrated Centre Leadership (NPQICL) 63 10 27 478
Qualified Teacher Status (QTS) 27 1 72 478
Social Work / Social Care (eg DipSW) 15 1 84 478
Health visitor 4 * 95 478
Midwife 3 0 97 478
NHS Manager 2 0 98 478
Other health related qualification 10 * 90 478
Early Years Professional Status (EYPS) 11 5 85 478
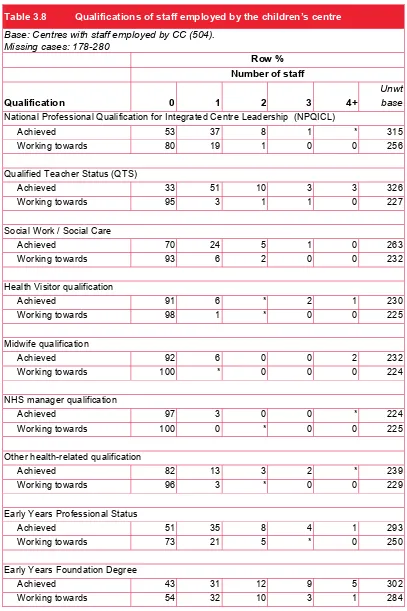
Children’s centre leaders were less able to provide this level of detail about the qualifications of their staff as shown by the large amount of missing data for XTable 3.8X. The qualifications most frequently held by staff other than the leader were Qualified Teacher Status (at least one staff member in 77% of centres), Early Years Foundation Degree (in 57% of centres), Early Years Professional Status (in 49% of centres) and Social Work (in 30% of centres).
Table 3.8 Qualifications of staff employed by the children’s centre
Base: Centres with staff employed by CC (504). Missing cases: 178-280
Row % Number of staff
Qualification 0 1 2 3 4+
Unwt base
National Professional Qualification for Integrated Centre Leadership (NPQICL)
Achieved 53 37 8 1 * 315
Working towards 80 19 1 0 0 256
Qualified Teacher Status (QTS)
Achieved 33 51 10 3 3 326
Working towards 95 3 1 1 0 227
Social Work / Social Care
Achieved 70 24 5 1 0 263
Working towards 93 6 2 0 0 232
Health Visitor qualification
Achieved 91 6 * 2 1 230
Working towards 98 1 * 0 0 225
Midwife qualification
Achieved 92 6 0 0 2 232
Working towards 100 * 0 0 0 224
NHS manager qualification
Achieved 97 3 0 0 * 224
Working towards 100 0 * 0 0 225
Other health-related qualification
Achieved 82 13 3 2 * 239
Working towards 96 3 * 0 0 229
Early Years Professional Status
4
3BService Provision
This chapter presents the descriptive findings about the different types of services and specific programmes that were provided by the children’s centres. It also presents findings about the types of relationship the children’s centres had with other organisations relating to the provision of the different services.
4.1
18BKey Findings
• Across different service types, children’s centres were more likely to provide services directly than help users gain access through sign-posting and referral. • Forty-six different types of services and programmes were offered by the centres. • The most frequently cited service was ‘Stay and Play’. Other services mentioned
by over 80 per cent of the leaders were home based services (99%), parent and family support classes or groups (93%), breast feeding support (91%), adult learning programmes (87%), parent forum (86%), evidence based parenting programmes (84%), health visitor clinic (82%) and early learning and childcare (82%).
• Among the centres providing early learning and childcare, the majority provided ‘full-time’ sessions (78%). Thirty-seven per cent offered part day sessions of less than four hours and 29 per cent offered longer part day session of four hours or more. A minority (9%) offered sessions outside of normal working hours.
• Children’s centres services were more often open to all rather than requiring referral. Services more likely to require referral were those offering specialist support, targeted at specific groups, and evidence based programmes.
• Services with the highest number of users were early learning and childcare services, and ‘stay and play’ programmes (average of 98 users in both cases). The services with the lowest numbers of users were employment and benefits advice, advice and information services and adult education.
• Forty-seven per cent of centres offered at least one evidence-based programme from those shortlisted in the Graham Allen report on early intervention. The most common programmes were ‘Incredible Years’, ‘Triple P’ and ‘Family Nurse Partnership’. A further 41 per cent mentioned other kinds of programmes and 12 per cent of centres did not offer any evidence-based programmes.
4.2
19BTypes of services
This section of the questionnaire was aimed at gathering information about the range of provision offered by the children’s centres in order to inform later stages of the evaluation. The different types of services were represented under 11 headings (XTable 4.1X).
X
Table 4.1X shows the balance between centres providing services directly, helping users gain access to services or both. For the majority of the service types, centres were more likely to provide them directly. The exception was ‘before or after school care for older children’, where centres were more likely to help users gain access to these services than to provide them directly. For all service types, there were some centres that both provided the service directly and helped users gain access.
Table 4.1 Whether children’s centres provided services directly or helped gain access
Base: Responding sample (509).
Row %
Type of service
Provided directly only
Helped gain access only
Provided directly and helped gain
access Neither
Early learning and childcare 56 25 18 1
Before/after school care for older children
18 62 4 17
Opportunities for parents and children to play and take part in activities together
83 1 16 *
Childminder development and support 64 21 13 1
Health related services 53 25 22 *
Employment and benefits services or advice
43 38 19 *
Other advice and information services 43 35 22 0
Adult education for parents 54 18 28 *
Family and parenting support 72 4 24 0
Outreach or home based programmes 77 3 20 *
Other 57 3 7 33
The children’s centres offered a wide range of services and programmes. XTable 4.2X and
X
Table 4.3X present the list of services mentioned by the leaders. In total, children’s centres offered 46 different types of services and programmes. As would be expected given the aims of children’s centres, services targeted at parents and children of younger age (birth to five) were more common compared to services and programmes targeted at children of older ages (over five years old).
The most frequently cited service which was mentioned by all the responding leaders was