MORPHOMETRIC ANALYSIS OF HISTOARCHITECTURAL CHANGES IN CHOLECYSTITIS
DISSERTATION
SUBMITTED TO THE TAMILNADU DR.M.G.R. MEDICAL UNIVERSITY
CHENNAI
In partial fulfillment of the requirements for the degree of
M.D. (PATHOLOGY) BRANCH – III
DEPARTMENT OF PATHOLOGY
TIRUNELVELI MEDICAL COLLEGE HOSPITAL TIRUNELVELI – 627011
CERTIFICATE
This is to certify that the dissertation titled “MORPHOMETRIC
ANALYSIS OF HISTOARCHITECTURAL CHANGES IN
CHOLECYSTITIS” is a bonafide work done by Dr.R.PRIYADARSHINI,
Department of Pathology, Tirunelveli Medical College, Tirunelveli – 627011,
during her post graduate degree course from 2014 to 2017. This work has not
formed the basis for previous award of any degree.
Prof. Dr. K. SITHY ATHIYA MUNAVARAH, MD.,
Dean,
CERTIFICATE
I hereby certify that this dissertation entitled “MORPHOMETRIC
ANALYSIS OF HISTOARCHITECTURAL CHANGES IN
CHOLECYSTITIS” is arecord of work done by Dr.R.PRIYADARSHINI,
Department of Pathology, Tirunelveli Medical College & Hospital, Tirunelveli, in
partial fulfilment of university rules and regulations for the award of M.D.
DEGREE in PATHOLOGY BRANCH III,under my guidance and
supervisionduring the academic period from 2014 to 2017.
Prof. Dr.K. SHANTARAMAN,MD.,
Professor and Head,
Tirunelveli Medical College Tirunelveli-627011.
Prof. Dr. S. VASUKI,MD.,
DECLARATION
I solemnly declare that the dissertation titled “MORPHOMETRIC
ANALYSIS OF HISTOARCHITECTURAL CHANGES IN
CHOLECYSTITIS” was done by me at Tirunelveli Medical College, Tirunelveli
– 627011, during the period of 2014 to2017 under the guidance and supervision of
Prof. S. VASUKI.MD, to be submitted toThe Tamil Nadu Dr. M.G.R. Medical
University towards thepartial fulfilment of requirements for the award of MD
DEGREE in PATHOLOGY BRANCH-III.
Place : Tirunelveli Date :
Dr.R.PRIYADARSHINI,
ACKNOWLEDGEMENT
This thesis owes its existence to the help, support and inspiration of several
people. First, I thank Professor Dr. K. SITHY ATHIA MUNAVARAH, M.D.
Dean, Tirunelveli Medical College, for having permitted me to conduct the study
and use the hospital resources in the study.
I would like to express my sincere and heartfelt gratitude to Professor Dr.
SHANTARAMAN. K. MD, Professor and Head, Department of Pathology, for
his guidance, inspiration and suggestions for the development of this thesis
context.
I would like to express my special appreciation and thanks to my mentor
Professor Dr. S. VASUKI.M.D., and Professors DR. SWAMINATHAN.K.
M.D., DR.SURESH DURAI. J. M.D., DR. ARASI RAJESH.M.D., Department
of Pathology, for guiding me during the period of study.
I am extremely thankful to Professor DR. A.SELVAMURUGAN,
Professor and Head,Department of Forensic Medicinefor supporting me
academically and professionally during the period of study.
I also thank all the lab technicians especially Mrs. Veeralakshmi for their
valued assistance and my fellow postgraduates for their cooperation which
enormously helped me in the study.
Finally, but by no means least, my deepest gratitude goes to my husband
Dr. N. KARTHIKEYAN, mom and dad for their unflagging love and
ABBREVIATIONS
GB – Gall bladder
EHBD – Extra hepatic bile duct
IHBD – Intra hepatic bile duct
CBD – Common bile duct
LMW – Low Molecular weight keratin
EMA – Epithelial Membrane Antigen
CEA – Carcino Embryonic Antigen
R.A sinus – Rokitansky Aschoff sinus
DM – Diabetes Mellitus
Ca(HUCB)2 – Calcium monohydrogen bilirubinate
HPE – Histopathological Examination
MALT – Mucosa Associated Lymphoid Tissue
CLL – Chronic Lymphocytic Leukemia
SLL – Small Lymphocytic Lymphoma
IgG 4 – Immunoglobulin G 4
HMG- COA - 3-Hydroxy 3- Methyl Glutaryl Coenzyme A
CONTENTS
1. INTRODUCTION 1
2. AIMS OF THE STUDY 3
3. REVIEW OF LITERATURE 4
4. MATERIALS AND METHODS 45
5. OBSERVATIONS AND RESULTS 49
6. DISCUSSION 69
7. SUMMARY 75
8. BIBILIOGRAPHY
1
INTRODUCTION
Cholecystitis is often thought to be a major ailment in modern society.
Gallstones are more likely associated with humans from antique era, since they
have been found in the gallbladders of Egyptian mummies dating back to 1000
BC. Historical evidence suggests that Alexander The Great had suffered from
acute gall bladder infection[1]. Nowadays, it is a worldwide medical problem, with
wide areas of geographical distribution.
Recently, gallstones are becoming increasingly common due to sedentary
lifestyle and socio economic status. Its frequency has been strongly integrated
with the epidemics of obesity and the metabolic syndrome[2].
Risk factors associated with cholecystitis are multifactorial. Many risk
factors for gallstone formation are not modifiable such as ethnicity, older age,
female sex and family history or genetics. On contrary, modifiable factors like
diet, drugs, physical activity also contributes for stone formation. Other
attributable risk factors related to biliary sludge include pregnancy, drugs and total
parenteral nutrition or starvation.
Certain diseases like cirrhotic liver, chronic hemolytic diseases and ileal
Crohn’s disease are more prone for black pigment stones. Gallstone disease in
childhood, was once considered rare but its occurrence has been increased these
days because of lifestyle modification particularly childhood obesity[3].
Population-based surveys have uncovered an overall increase in mortality
2
incidence of gallstone disease, there is a concomitant increase in certain
complications like gallstone-related pancreatitis[4].
Gall bladder is one of the commonest specimens received in the
histopathology laboratory. Cholecystitis is classified based on the presence of
stones as calculous (cholelithiasis) and acalculous cholecystitis. Both are
associated with significant macroscopic and microscopic changes.
Histopathological alterations such as epithelial hyperplasia, dysplasia with
erosion of mucosa and inflammatory cellular infiltrates were encountered in both
cholelithiasis and acalculous cholecystitis. Therefore it will automatically warrant
a study to distinguish and estimate the changes evident in both types. In the recent
decades,morphometrictechniques have been developed rapidly which permits
quantification of structural data facilitating correlation with functional studies.
Morphometry is a field concerned with studying variations and alterations
in forms such as size and shape. It can be used to assess the malignant nature of
cells and its classification by quantitative measurements of nuclei such as density,
area, etc. For example, in uveal melanoma, the nuclear perimeter shows good
correlation with prognosis[5]. In addition, it can also be used to estimate the
predominant alteration with statistical evidence. With the recent advent of
personal computers, morphometric measurement could be easily merged with the
computer for rapid and better analysis.
This article gives a valuable audit on calculous and acalculous cholecystitis
and spotlights current information about the pathogenesis, risk factors,
histopathological changes and morphometric analysis of the predominant
3
AIMS OF THE STUDY
The aim of this study is
1) To morphometrically analyse the histomorphological pattern in the wall
of human gall bladder in cholecystitis.
2) To compare them statistically with normal human gall bladder through
4
REVIEW OF LITERATURE
HISTORY :
Cholecystectomy is the commonest operative procedure of biliary tract and
second most common surgery performed today[6]. History of surgery is weighed
down with names of well known German specialists like Kocher, Czerny,
Courvoisier and Mikulicz.In 1687,Stal Pert Von Der Weil while operating a
patient with purulent peritonitis inadvertently discovered gall stones[1]. But Carl
Langenbuch spearheaded the idea and executed first gall bladder (GB) extraction
in 1882 [7].
In 1987, Philippe Mouret in France did the first laparoscopic
cholecystectomy which immediately reformed the treatment of gall stones[8].
Today laparoscopic cholecystectomy is the preferred treatment for symptomatic
gall stones.
EMBRYOLOGY :
Embryologically, GB and biliary tree anlage begins around fourth week of
gestation. They are endodermal in origin and develop as a ventral bud known as
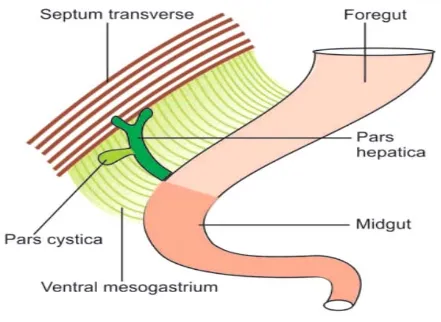
hepatic diverticulum[9]. It stretches out into septum transversum as rapidly
multiplying cell strands and partitioned into two parts(FIG. 1) - a larger cranial
part pars hepatica which is the liver primordium and smaller caudal part pars
5
At 29 days of gestation, pars cystica will start protruding as anterolateral
dilatation which later develops into GB along with a cystic duct visible at 34
days[11]. Initially GB is an empty organ however as a consequence of multiplying
strands of epithelial lining, it turns out to be briefly solid. Further recanalization
[image:17.595.102.543.228.550.2]happens by vacuolation of epithelium .
FIG.1 – Diaphragmatic representation of hepatic diverticulum.
The external layers of GB wall and cystic duct develop from consolidating
mesenchyme around the epithelial mass. Myoblasts develop around 30mm stage
resulting in establishment of each of the three layers of wall of future gall bladder
6
For up to 56 days of gestation, the extra hepatic biliary tree (EHBD)
develops from extension of the caudal part of the hepatic diverticulum. From the
beginning, it remains patent and in coherence with the developing liver at all
stages.By 12 weeks of gestation, tubular structures are formed from the distal part
of right and left hepatic ducts.
The intra hepatic bile ducts (IHBD) require finely tuned epithelial –
mesenchymal interactions for its developement, which continue from the hilum of
the liver toward its fringe along the branches of the developing portal vein[12].
ANATOMY :
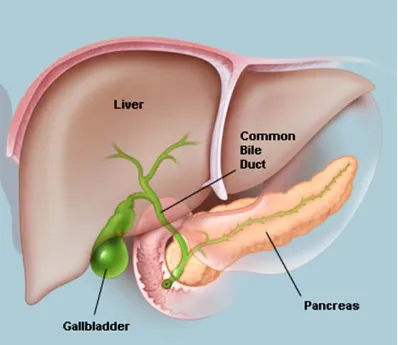
Gall bladder is a pear shaped organ that lies in the shallow fossa on visceral
surface of liver[13].It usually lies at junction of right lobe and medial lobe of left
lobe[14] (FIG. 2). In adult, it measures 7 to 10 cm in length, 3 to 4 cm in width and
thickness of 1 to 2 mm[15].
Its capacity is usually 40 to 70 ml [15]. But when obstructed, it can distend
markedly and contain upto 300 ml[16]. It is divided into four anatomic areas
7
FIG. 2 – showing anatomy of gall bladder and its relations.
FUNDUS :
It is the rounded blind end that usually extends 1 to 2 cm beyond hepatic margin.
8
FIG. 3 – Parts of gall bladder – fundus, body and neck.
CORPUS :
The body extends from fundus and tapers into neck connecting with the
cystic duct. It contains most of the elastic tissue and therefore serves as the main
storage area.
NECK :
The neck lies in the most profound part of GB fossa and extends into free
portion of hepatoduodenal ligament. True glands are present only in the neck.
INFUNDIBULUM :
The infundibulum or Hartmann’s pouch is an out pouching of wall in the
region of neck. It is the result of some pathological conditions such as dilatation
9
BLOOD SUPPLY
ARTERIAL SUPPLY :
GB is supplied by cystic artery, usually given off in Calot’s triangle. It is a
branch of right hepatic artery. The course of cystic artery may vary and enters GB
in the body or neck[17]. It is divided into anterior and posterior branches.
VENOUS DRAINAGE:
It is carried through small veins that enter directly into liver. Rarely, a large
cystic vein carries blood back to portal vein [19].
LYMPHATIC DRAINAGE:
Lymphatics drain into nodes present at the neck of GB. From here it flows
to nodes near hepatic hilum and in inferior portion of hepato– duodenal ligament
reaching the nodes on celiac axis[20] .
NERVE SUPPLY :
Nerves of GB arises from vagus and from sympathetic branches T8 &
T9 that pass through the celiac plexus[21] .
BILE DUCT:
Bile duct comprises intra hepatic and extra hepatic bile duct (EHBD).
The EHBD consists of right hepatic and left hepatic duct, common hepatic duct,
cystic duct, common bile duct (CBD) or choledochus. The CBD enters second
10
HISTOLOGY :
GB is a muscular sac. The wall of GB is composed of mucosa comprising
surface epithelium & lamina propria (LP), smooth muscle – tunica muscularis,
perimuscular subserosal connective tissue&serosa. There is no submucosa or
muscularis mucosa (FIG. 4). True glands are present only in the neck and are of
tubulo-alveolar type[23].
MUCOSA :
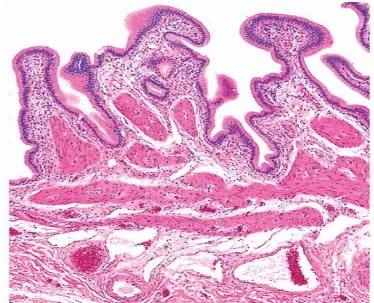
The mucosa is thrown into variably sized branching folds lined by single
layer of columnar cells(FIG. 4) having pale cytoplasm with occasional small
apical vacuoles & basally located nuclei . Ultra structurally, these cells have
abundant micro villi with filamentous glycocalyx on apical surfaces and core
rootlets. Small darker staining columnar cells called pencillate cells are scattered
among columnar cells.Tubulo alveolar mucous glands are seen only in the neck of
GB.
Histochemically, the epithelial cells contain mainly sulfomucin in contrast
11
FIG 4 – showing normal histology of GB, mucosa thrown into folds, lamina propria and tunica muscularis.
IMMUNO HISTOCHEMISTRY :
By IHC, the epithelial cells are reactive to both Low molecular weight
keratin (LMW) and Epithelial membrane antigen (EMA). Carcino embryonic
antigen (CEA) positivity is confined to apical cells[23].
LAMINA PROPRIA :
It lies between surface epithelium and muscularis and fills the cores of
mucosal folds. It is composed of loose connective tissue, lymphocytes, plasma
cells & macrophages. Nerve fibers, small blood vessels and lymphocytes are also
12
MUSCULAR LAYER :
It is made up of haphazardly arranged bundles of smooth muscle
fibers.Unlike in GI tract, the GB has only one muscle layer, tunica muscularis.
They are highly porous, allowing numerous invaginations from the mucosa.
Mucosal invaginations known as RokitanskyAschoff (R.A) sinuses (FIG. 13) may
be seen in normal GB but more prone in inflammation[25].
PERIMUSCULAR LAYER :
This sub serosal layer contains variable amount of fibro elastic & adipose
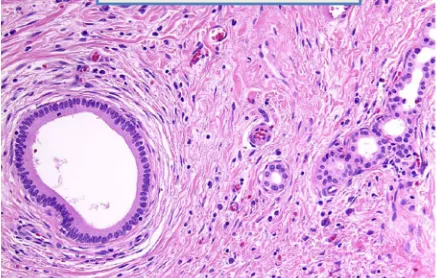
tissueas well as nerve cells. Bile ductules also known as Luschka ductules (FIG.
5) which are thought to be remnants of primordium liver may likewise be seen [26].
They are lined by cuboidal epithelium alike intra hepatic bile duct surrounded by
collar of fibrous tissue. They have no relation with R.A sinuses. They have been
seen in 10 % of cholecystectomy specimens[23].
SEROSA :
It covers the entire unattached GB surface. When GB is attached to liver
13
FIG 5– Luschka ductules seen in perimuscular layer at the hepatic surface of gall bladder.
EHBD :
It is lined by single layer of tall epithelium similar to GB.The epithelium
invaginates into the stroma known as Sacculi of Beale surrounded by mucinous
glands[27].
CHOLECYSTITIS :
It is defined as inflamed GB in which inflammation may be acute, acute on
chronic, or chronic. 90% cases involve stones in GB i.e calculous cholecystitis
14
GALL STONES :
EPIDEMIOLOGY :
Gall stone is a vital problem affecting 5 – 20% of adults[29].The prevalence
ranges widely across ethnicities and approximately twice as high in women as in
men[30]. It is considered as one of the leading causes of gastrointestinal
problems[31].They are often asymptomatic but 1- 3% of patients per annum may
present with symptoms[32].
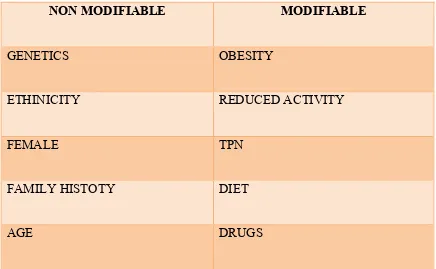
RISK FACTORS :
Risk factors are multifactorial and classified as modifiable and non –
modifiable factors[33]. (Table 1)
1) ETHNICITY :
Geography and particularly ethnicity contribute to prevalence of gallstone
disease and also the type of stones. Cholesterol gallstones are more common in
the developed countries of the Western world while brown pigment stones in the
bile ducts in Asia[29]. White Americans show an overall predominance of 16.6% in
women and 8.6% in men[34]. Intermediate prevalence rates occur in Asian[35]and
Black Americans while Sub-Saharan Black Africans have very low frequencies
15
Table 1 – Risk factors of gall stones.
NON MODIFIABLE MODIFIABLE
GENETICS OBESITY
ETHINICITY REDUCED ACTIVITY
FEMALE TPN
FAMILY HISTOTY DIET
AGE DRUGS
2) GENETICS :
Genetic susceptibility is a key factor in gallstone formation. Familial
studies reveal an increased frequency of nearly five times increased risk in the
relatives of gallstone patients. These rates are even higher in monozygotic twins
than dizygotic twins[37].
3) AGE :
The frequency of gallstones markedly increases with age which are 4 to 10
times more likely in older individuals[38]. It also corresponds with the type of
stone formation initially being composed predominantly of cholesterol but later
16
4) GENDER :
Women show increased frequency for gall stones formation among which
premenopausal are at higher risk[33]. Risk factors include parity, oral
contraceptives and estrogen replacement therapy[40]. Female sex hormones show
strong association with GB function and bile secretion. Estrogen acts by
augmenting the secretion of cholesterol and decreases bile salt formation, whereas
progestins reduces bile salt secretion impeding GB emptying leading to stasis[39].
5) OBESITY :
Obesity, in particular, centripetal obesity, is a common risk factor for gall
stone disease[41]. It affects the rate limiting step in cholesterol synthesis by
enhancing HMG COA reductase activity. It eventually promotes increased
cholesterol synthesis in the liver and its secretion into bile[42].
6) DYSLIPIDEMIA & DIABETES MELLITUS :
Gallstone disease is a metabolic problem, in association with lipid
abnormalities & diabetes mellitus. A low HDL cholesterol[43] and
hypertriglyceridemia[44] carry an increased risk of developing stones. In DM,
insulin resistance alters cholesterol and bile salt metabolism predisposing to gall
stone formation[45].
7) DIET & TOTAL PARENTERAL NUTRITION :
Diets rich in cholesterol[46], fatty acids[47], carbohydrates[48] and legumes[49]
are associated with the risk of development of cholelithiasis whereas unsaturated
17
the other hand, is a risk factor for developing microlithiasis and gallstone disease
besides acute acalculous cholecystitis[55].It may be due to loss of the enteric
stimulation of the GB which occurs as a result of starvation, prompting
gallbladder stasis[56].
8) LIFESTYLE :
The relationship between socioeconomic status and gallstones is still
controversial[33]. Reduced physical activity increases the risk of gallstone disease
and increased physical activity helps in preventing cholelithiasis[55].
9) DRUGS :
Certain medications like estrogen therapy, thiazide diuretics[57],
ceftriaxone[42] and octreotide[58] show predilection for gall stone formation
whereas statins reduces the risk[59].
10) UNDERLYING ILLNESS :
Advanced cirrhosis[60], Crohn’s disease[61], cystic fibrosis[62] and other
injuries such as spinal cord injuries[63] are well known risk factors.
PATHOGENESIS :
Gall stones are formed of abnormal constituents of bile. Biliary sludge
precedes stone formation which contains mucous gel, hydrophobic bile pigments,
cholesterol lecithin liquid crystals and solid cholesterol mono hydrate crystals[64].
First, cholesterol precipitates into crystals when its concentration in bile exceeds
the solubilizing ability of bile salts and phospholipids. Biliary accumulation along
18
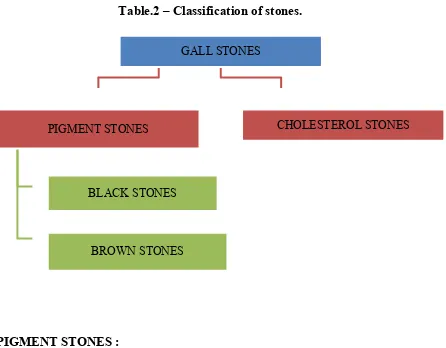
and mucous hypersecretion facilitating stone formation[65]. There are two different
types of stones - cholesterol stones and pigment stones.(Table 2)
CHOLESTEROL STONES :
Cholesterol stones comprises of 70% of gall stones in western countries[66].
Its formation is related to super saturation of bile with cholesterol and rapid
nucleation of cholesterol crystals[67]. Other mechanisms include GB hypomotility
resulting in stasis.More than 80% of cholesterol stones lack calcium carbonate and
hence radiolucent[23].
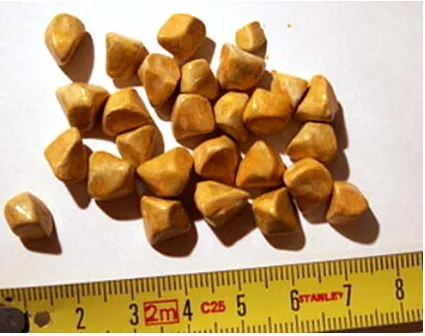
MORPHOLOGY :
Pure cholesterol stones accounts for 10% of gall stones. They are
yellowish to white, round to ovoid, crystalline or laminated cut surface measuring
upto 4 cm[23] (FIG. 6).
Stones with lower cholesterol level are designated as mixed. Depending on
the proportion of calcium carbonate, bilirubin and phosphates, mixed stones may
be lamellated, greyish white to black in colour. They are usually smaller and
19
Table.2 – Classification of stones.
PIGMENT STONES :
It is classified as black stones which are hard in consistency and brown
stones which are soft.
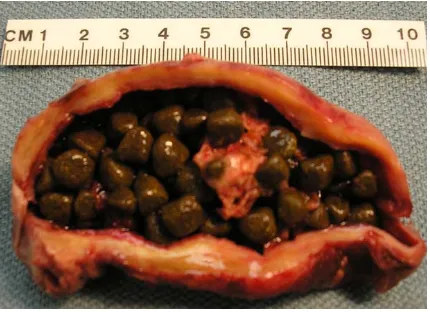
BLACK STONES :
Black stones form in sterile GB bile. It contains enough calcium carbonates
and phosphates to render them radiopaque[68].It is associated with states of
hyperbilirubinemia [69],all hemolytic anemias like spherocytosis[70],sickle cell
disease[71], thalassemia[72], malaria[73]and foot trauma in long distance runners[74]. GALL STONES
PIGMENT STONES
BLACK STONES
BROWN STONES
20
FIG. 6 – showing multiple cholesterol stones each measuring less than 4 cm.
MORPHOLOGY:
Black stones are black or deep brown, (FIG 7) relatively small measuring
about 2-5 mm. They are brittle and sometimes spiculated. On fracturing, these
stones have a glass like appearance[23].
BROWN STONES :
Brown stones are more common in Asia[33]. It forms secondaryto stasis,
anaerobic bacterial infection and parasitic infestation from nematodes and flukes
21
FIG. 7 – showing multiple black pigment stones.
It contains unpolymerized Ca(HUCB)2 and calcium soapscontaining
amorphous calcium salts of palmitate and stearate rendering them as
radiolucent[68].Parasites in the bile duct may induce stone formation by the
calcified overcoat of parasite’s egg which serves as a nidus and enhance
precipitate of calcium bilirubinate[66].
MORPHOLOGY :
These stones are much softer, laminated and may have soap like or greasy
consistency[75] (FIG. 8)
CLINICAL PRESENTATION :
Majority of patients have silent stones without any symptoms and may not
22
repeated episodes of right upper quadrant or epigastric pain accompanied by
nausea or vomiting [77]. Often attacks occur after fatty meals and almost at
[image:34.595.96.526.162.474.2]night[78].
FIG. 8 – shows multiple soft brown pigment stones.
Sometimes, patients may experience referred pain between the shoulder
blades or below right shoulder region (Boas sign)[79]. On examination, there will
be tenderness in right quadrant (Murphy’s sign)[80]. Occasionally, gall stone ileus
may occur by a large stone eroding the adjacent loop of small bowel which in turn
results in intestinal obstruction (Bouverets syndrome) [81].
ACALCULOUS CHOLECYSTITIS :
Cholecystitis can occur without the evidence of gall stones. It is
23
hyperalimentation. Extensive burns, sepsis, major operations and multiple trauma
are at higher risk. Decreased GB perfusion and ischemia caused by shock,
congestive cardiac failure and arteriosclerosis are the contributing mechanisms[82].
It usually presents with nonspecific clinical features similar to gall stone disease.
Microscopically, it shows leukocyte margination of blood vessels,
lymphatic dilatation and bile infiltrating deeper into the muscular layer[83]. There
will be associated edema of serosa and muscular layers with patchy thrombi of
arterioles and venules[14]. Due to nonspecific presentations, diagnosis will be
delayed and tends to have fulminant complications such as gangrene, perforation
and empyema. Majority of the patients will improve by percutaneous
cholecystostomy.
ACUTE CHOLECYSTITIS :
It is an acute inflammation of GB.It is more often a clinical entity and does
not necessarily imply acute inflammation of GB i.e. neutrophils are often
lacking[23].
It is precipitated by obstruction of stones in neck or cystic duct (90%) and
rest includes acute acalculous cholecystitis[84]. Its etiology may not be
demonstrable but it is typically seen in debilitating patients[85].
PATHOLOGIC FINDINGS :
The gross and histopathological findings of GB wall in both acute
24
GROSS FINDINGS :
GB is usually enlarged, tense and external surface shows bright red or
green black discolouration[75].
HISTOPATHOLOGY :
In acute cholecystitis, the mucosa is often eroded and shows prominent
edema, congestion, hemorrhage and fibrin deposition in all layers(FIG. 9). In
extreme cases, necrosis and neutrophils are seen[23]. Sometimes fibrin thrombi
may be seen in small veins[20].On addition, the adventitia shows activated myo
fibroblastic cells in a loosely edematous stroma which is considered as one of the
[image:36.595.99.516.398.674.2]hallmarks of acute cholecystitis[23]. (FIG. 10)
25
VARIANTS :
The variants of acute cholecystitis are :
1) Empyema of GB
2) Acute emphysematous cholecystitis.
EMPYEMA OF GB :
It is a severe form of acute calculous cholecystitis with superadded
suppuration[86]. In other words, it is an inflammation of GB with contained pus.
The presentation is often atypical[87]. Microscopically, the mucosa is often
extensively ulcerated and contains numerous neutrophils[23]. Laparoscopic
cholecystectomy is contra indicated because of fear of life threatening
[image:37.595.94.521.435.719.2]complications[88]. It carries high mortality rate[87].
26
ACUTE EMPHYSEMATOUS CALCULOUS CHOLECYSTITIS :
It is a life threatening form of acute calculous cholecystitis caused by
presence of gas on GB lumen or wall[89]. Clostridium species, Escherchia coli,
streptococcus and Klebsiella are the most common gas forming organism[90]. It is
a consequence of ischemic injury associated with predisposing conditions like
atherosclerosis, arterial embolism, vasculitis[91]. It is more common in older
patients with DM[89]. On HPE, the inflammatory reactions are histologically
indistinct and consists of usual pattern of acute inflammatory changes[75] and
ischemic changes formed by progressive vascular incompetence leading to
necrosis and perforationof GB wall. It is associated withcomplications like
perforation and abscess formation leading to peritonitis and carries high mortality
rate[92].
CHRONIC CHOLECYSTITIS :
ETIOLOGY :
It is often associated with cholelithiasis. It occurs as a result of chronic
irritation of GB wall by recurrent attacks of cholecystitis secondary to transient
obstruction by gallstones[93].
EPIDEMOLOGY :
Women are more affected than men. It usually occurs in 5th to 6th
decade. It is strongly associated with GB cancer with an incidence ranging from
27
CLINICAL FEATURES:
Intermittent or constant pain in right upper quadrant is the most specific
symptom. Many patients have nausea with colic pain. Other non-specific
symptoms are belching, bloating, flatulence or upper abdomen fullness. A
palpable GB mass in upper abdomen can sometimes be seen on clinical
examination suggesting chronic hydrops[94].
PATHOPHYSIOLOGY :
Characteristic finding of chronic calculous cholecystitis is fibrosis which leads
to shrunken or contracted GB[93].
GROSS :
Calculi are present in greater than 90% of cases.GB is itself normal or
show thickening of wall. In more severe cases the GB may be shrunken with
marked fibrosis, thickening and serosal scarring [23].
PORCELAIN GB :
Long standing chronic calculous cholecystitis may develop mural
calcification and referred as porcelain GB. Its prevalence is 1 – 2% in chronic
choloecystitis specimens. It is strongly associated with GB cancer with an
incidence ranging from 12-61%. Grossly, it appears bluish and brittle in
28
FIG. 11– porcelain GB with brittle in nature.
HISTOPATHOLOGY :
On HPE, the epithelium may be relatively normal, atrophic and show
hyperplastic or metaplastic changes[95]. Metaplasia can be of intestinal with goblet
cell (FIG. 12) or pyloric (antral), the former being accompanied by paneth cells
and endocrine cells. Of these, pyloric metaplasia is more common[96].R.A sinuses
(FIG.13) results from increased intra luminal pressure. It is a pseudo diverticula
formed by deeply invaginating mucosa without a complete muscular coat. It is
common finding and more prominent in severe cases[23]. Luschka’s ducts are
29
Fig.12– shows intestinal metaplasia of GB with paneth cells.
The degree of chronic inflammation varies with predominance of
lymphocytes and some plasma cells, macrophages and occasionally eosinophils.
When neutrophils are present, a diagnosis of chronic active cholecystitis may be
30
FIG. 13– showing R.A sinuses associated with thickened wall and inflammatory cells
In some cases, there will be collection of macrophages containing bile and
lipofuschin which is termed as cholegranulomatous cholecystitis[23].The different
31
VARIANTS :
1) Xanthogranulomatouscholecystitis.
2) Hyalinisingcholecystitis.
3) Follicular cholecystitis.
4) Diffuse lymphoplasmacyticcholecystitis.
5) Eosinophiliccholecystitis.
6) IgG4 related sclerosingcholecystitis
1) XANTHOGRANULOMATOUS CHOLECYSTITIS :
It is considered as an uncommon variant and clinically similar to acute or
chronic cholecystitis. Grossly there is large or small contracted GB usually
associated with cholelithiasis and greyish yellow nodules in outer layers.
Recurrent inflammation and calculi incite degeneration and necrosis of GB wall
which subsequently leads to intra mural abscess and eventual replacement by
32
FIG.14 – shows foamy macrophages containing bile and cholesterol clefts.
2) FOLLICULAR CHOLECYSTITIS :
It is an extremely rare entity seen in older age group usually in mid
60s[99]. Originally described in typhoid fever, it is now known to occur in gram
negative infections[100]. In normal GB mucosa, lymphoid tissue is very sparse.
Some intra epithelial lymphocytes may be evident among surface columnar cells
but lymphoid follicles are never seen[101]. In this variant, there is widespread
formation of lymphoid follicles(FIG.15) in all layers of GB[102]. It is
33
masquerading as cholecystitis are MALT, follicular lymphoma, mantle cell
[image:45.595.114.507.136.478.2]lymphoma, CLL / SLL[104].
FIG.15 – shows prominent lymphoid follicles in lamima propria.
3) DIFFUSE LYMPHOPLASMACYTIC CHOLECYSTITIS :
It occurs sporadically in almost 7% of GB resected for cholecystitis[105].It
was initially related with chronic inflammation in patients with primary sclerosing
cholangitis[106]. On HPE, it shows triad of diffuse chronic inflammatory infiltrate
with predominant plasma cells accompanied by nodules of mucosal lymphocytes
34
It is a unique form of cholecystitis charcterised by diffuse inflammatory infiltrates
[image:46.595.144.479.146.426.2]confined to lamina propria not extending to deeper layers[23].
FIG.16 - shows mixture of lymphocytes and plasma cells forming a band in mucosa sparing the deeper layers.
4) EOSINOPHILIC CHOLECYSTITIS :
It is an uncommon condition first described in 1949[108]. Histologically,
eosinophilic cholecystitis is distinguished by a dense transmural infiltration of
eosinophils without evidence of any infestation[109]. The eosinophilic infiltrates
35
It may be associated with parasitic infestations of liver and biliary tract.
It should be distinguished from Churg Strauss syndrome in which gall bladder is
[image:47.595.101.519.171.485.2]involved in addition to granulomatous angitis and eosinophilia[23].
FIG.17 - shows predominantly esosinophilic infiltrates.
5) HYALINISING CHOLECYSTITIS :
It is a recently described rare subtype clinically referred as porcelain GB. It
is characterised by dense pauci cellular collagenous transmural fibrosis(FIG.18)
replacing the mucosa and muscularis propria[111]. It is often associated with
36
cell cytology, nuclear enlargement and nuclear axis parallel to surface helps in
[image:48.595.100.532.135.388.2]distinguishing from their malignant counterpart[23].
FIG.18 – shows hyalinization entirely replacing the gall bladder wall.
6) IgG4 RELATED SCLEROSING CHOLECYSTITIS :
In IgG4 related sclerosing pancreatitis, patients may also show changes in
gall bladder in addition to duodenum and pancreas[113]. On HPE, it shows a band
of characteristic basophilic wavy sclerosis with plasma cells lying individually in
37
MORPHOMETRIC ANALYSIS :
HISTORY :
Since ancient era, the human body has been measured for several purposes.
In the older days, human body was measured for figurative arts. Eventually, the
methodology was trailed by the naturalist field and then by anthropologists to
identify basic morphological characteristics of human. The term anthropometria
dates back to the 17th century in the naturalist field, and was initially mentioned
in the short manual of Anthropometria by Johann Sigismund Elsholtz. It is the
first recorded material that researched the human body for scientific and medical
purposes. Elsholtz proposed that anthropometry could be applied in various fields
such as medical practices, physiognomy, the arts, and ethics[114]. By the
application of mathematics, geometry, and statistics, anthropologists proposed
human investigation methodologies.
MORPHOMETRY :
Morphometrics is a branch of anthropometry, which deals with the study of
size and shape of the components of various biological forms. It can also be
characterised as the quantitative analysis of organic structures. It focuses on
studying the variations and changes in forms (i.e., size and shape) of organisms.
The field has emerged rapidly over the last two decades. It is classified into
38
TRADITIONAL MORPHOMETRICS :
It comprises multivariate statistical tools to characterise shape by analysing
conventional estimations between points with biological and anatomical
implications to characterize shapes called landmarks. These measurements usually
depictsthe lengths and widths of various parameters and the distances between
specific landmarks, within and between various populations.[116]
METHOD :
It was done by measuring linear distances such as length, width, and
height. Multiple statistical tools were used to describe patterns of variation in
shape within and among groups. Occasionally,counts, ratios, areas and angles can
be measured.
MERIT :
The advantage of this technique was that it was extremelyfundamental and
simple, however it had certain challenges.
DEMERITS:
1. It is impossible to recoup the shape of the original form using the data
matrices of distance measurements. The overall form is neither archived
nor used in the analysis[117].
2. Linear distance measurements are usually analogous with size and this
39
3. In this technique, the data did not include the area from which the
measurements were taken. Therefore possibility of same results could be
generated from the measurements taken from two different shapes.
4. It was likewise impractical to restore graphical representation of shape
from the taken measurements[118].
MODERN MORPHOMETRICS :
Later, in 1960s, biometricians started applying multivariate statistical tools
to sets of traditional measurements. They used a set of landmarks to describe
shape. Landmark is described as a two or three-dimensional point by a tightly set
of rule. It is considered as more substantial than traditional morphometric methods
in ensuring morphological information and permitting for further analysis of this
information.These information might be two dimensional (2D) or
three-dimensional (3D) organizing with morphological point of interest[117].
It includes the development of powerful statistical methods based on
models that are used to examine the shape variation of all configurations that
correspond to morphologic landmark locations. Indeed, in many biological or
biomedical studies, the most efficient way to analyze the forms of biological
organs or organisms is by registering landmarks[115].
MERIT :
It records the geometry of surveyed objects, and preserves the information
40
DEMERIT :
Disadvantage is that a number of landmarks available can sometimes be
insufficient to capture the shape of an object.
PRINCIPLE :
The fundamental principles of morphometric measurements are :
1. Linear measurements determine the distance between two landmarks by
using an eyepiece graticule with an engraved scale or alternatively with a
ruler on a projected microphotograph.
2. Stereology based on geometric probabilityhighlights the features of
twodimensional images in three dimensions.
3. Computerized image processing and analysis system allows image capture,
stockpiling and analysis using specialized software and hardware.
APPLICATIONS :
Morphometric methods can be applied in creating methods for
identification of tumor in diagnostic context and in characterizing diagnostic
histopathology. In conventional method of subjective diagnostic histopathology,
reproducibility can be defined adequately but the definition of precision is
ambiguous. The pathologists may be interested in morphometry for checking an
intuitive and subjective evaluation of a diagnostic feature on microscopic section
41
A) STUDIES ON CLASSIFICATION OF TUMOR :
It is used to create a classification basis for diagnostic decisions through
two approaches :
1) Initially, it correlates the obtained morphometric information with
traditional tumor classification taking into account of subjective
histopathology.
2) Secondly, by attempting a classification by reviewing the morphometric
data.
It may include correlation of morphometric data with prognostic
parameters like life expectancy, response to therapy and metastasis prediction.
B) STUDIES ON DIAGNOSTIC HISTOPATHOLOGY :
In this technique, the morphometric descriptors are defined to identify
certain type of tumor. It also includes the search for relevant morphometric
parameters.
MORPHOMETRIC HISTOPATHOLOGY :
It deals with the study of certain parameters measured from tissue sections
or derived from the primary measurements estimated through calculations. For
example, in tumor, certain parameters such as nuclear density, nuclear area,
perimeters, cellularity and number of mitosis per area are measured. For rational
application of morphometric methods,it is very important to make distinction
42
GROUP MORPHOMETRY :
It includes the study of multiple samples from different specimens.Then
the pathologist tries to achieve classifications by using obtained morphometric
methods.Finally based on the data from various samples, the results are
interpreted. This method is controlled and the measurements are mostly carried
out by one and the same investigator who is acquainted with the technique
involved.
DIAGNOSTIC MORPHOMETRY :
On the other hand,it is a process that takes place in a number of different
labs. It is carried out by many investigators and various techniques. This results in
variation in tissue processing, section thickness, and staining intensity[119].
MORPHOMETRIC PARAMETERS :
In HPE, the sections studied are usually two dimensional. Indeed there are
certain conditions in which one may need to characterize the tissue in three
dimensional evaluation. It involves volumetric measurements of tissue,
parameters per tissue volume or 3D structure of tissue. For these, stereological
parameters are recommended. But stereological parameters are always not
necessary for diagnostic context.
REPRODUCIBILITY AND ACCURACY :
In morphometric methods, both reproducibility and accuracy can be
estimated. By estimating reproducibility, we can compare the results of subjective
43
reference by standard units of measurements to estimate the accuracy. However
morphometric methods do not give diagnosis directly[5].
COMPUTER ASSISTED MORPHOMETRY :
With the approach of computers, applications for morphometric analysis
became simpler. Compared to conventional methods, computer-assisted
morphometry is exponentially quicker, more accurate, meticulous, and efficient in
providing a broad scope of estimations of morphological parameters. Using this
methodology, subjective, perception based interpretation have been replaced by
objective quantification. It depends on various factors such as image acquisition,
image display,transmission of images, storage and retrieval of images[120].
A) IMAGE ACQUISITION :
In this technique, the microscopic image is connected to the capturing
device. Devices for acquisition images range from electronic still to video
cameras which obtain electronic images directly in real time. It converts
photographs to digital data suitable for display and storage by computer.
B )IMAGE DISPLAY :
Captured images are usually displayed on computer display monitors. It
depends on the screen size, dot pitch and pixel resolution of the video output card.
C) IMAGE ANALYSIS :
It involves two distinct activities – image processing and morphometry.
Image processing may be either hardware based ie. incorporated into cameras,
44
cropping, rotation, labeling, arrows, horizontal and vertical reflection. Further it
allows for quantification studies like morphometric analysis using the processed
digital data. Some microscope manufacturers like Zeiss and Olympus are offering
image analysis packages interpreted with their microscope.
CASE CONTROL STUDY :
To conduct case control study, the control should be free of disease. If the
study involves a large number, then one control should be used for each case. If
the study group is small, then 2 or more controls can be selected for each study
subject. In order toavoidselection bias, some epidemiologists prefer case from one
45
MATERIALS AND METHODS
This study deals with the methodology and comparative study on
morphometric analysis of histoarchitectural changes in cholecystitis. The present
study was carried out at the Department of Pathology at Tirunelveli Medical
College and Hospital during October 2014 to August 2016. The study population
includes case and control groups. Cases include gall bladder specimen operated
for cholecystitis received from Department of Surgery in our hospital. Control
groups include normal human gall bladder obtained from autopsy subjects from
Department of Forensic Medicine in our hospital.
Inclusion criteria
This study includes
A. Cases with clinical diagnosis of cholecystitis and cholelithiasis irrespective
of age and sex.
B. Control group includes autopsy gall bladder specimens with no obvious
gross changes irrespective of age and sex.
Exclusion criteria
1) Autolysed specimens
2) All the cases of malignant gall bladder lesions
46
Age and Sex :
The age of case and control groups varied from 15 to 80 years. Study
populations were grouped into 4 groups as ≤ 20, 21- 40, 41 – 60, and > 60 based
on age and sex. The male patients were 25 and the remaining 50 were female with
male and female ratio of 1: 2.
In our case control study, 75 normal gall bladders (controls) and 75
cholecystitis specimens (cases) were studied. From each specimen, three sections
were taken from neck, body and fundus. After sectioning, tissues were processed
in an automated tissue processor and paraffin blocks were made. Tissue sections
of 3 mm were cut and stained with hematoxylin and eosin. Then the slides were
examined under light microscope and estimation was done in microns using IS
capture software to find out the predominant histopathological alterations in each
layers of gall bladder.
The predominant histopathological alterations observed in this study were
as follows:
HISTOPATHOLOGICAL ALTERATIONS:
EPITHELIUM:
Intact epithelium
Mucosal erosion
Epithelial distortion
47
LAMINA PROPRIA:
Thickness
Irregularity and gap
Lymphocytes
Macrophages
Plasma cells
MUSCULAR LAYER:
Rokitansky Aschoff sinuses
Macrophages
Plasma cells
Lymphocytes
SEROSAL LAYER:
Macrophages
Plasma cells
Lymphocytes
In epithelial layer, intactness and erosion of mucosa were measured in
microns. In addition to these, epithelial distortion like hyperplasia and metaplastic
changes like gastric and intestinal metaplasia were observed and estimated.
Thickness of lamina propria andirregularity and gap between the lamina propria
48
To count the number of inflammatory cells in each layers such as lamina
propria, muscular and serosal layer, 10 high power fields were chosen. In each
areas, the inflammatory cells such as lymphocytes, plasma cells and macrophages
were counted using 40 X magnification and average was taken.
Control specimens were grouped based on their age and gender. An
average value was calculated from the groups and considered as control values for
49
RESULTS AND OBSERVATIONS
In our case control study, 75 normal gall bladders(controls) and 75
cholecystectomy specimens such as calculous and acalculous (cases) were
studied. Out of 75 cholecystectomy specimens, 56 specimens i.e 74.66% were
associated with gall stones. Among these, 2 were reported as chronic follicular
cholecystitis(2.67%), 2 asacute on chronic cholecystitis(2.67%) and 52 as chronic
calculous cholecystitis(69.33%). Remaining 19 specimens(25.34%) were not
associated with stones, in which 2 were reported as chronic follicular
cholecystitis(2.67%) and 3 as acute on chronic cholecystitis(4%) and 14 as
chronic cholecystitis(18.67%).
With regards to gallstones, 36 were black stones(73.33%), 19 were
cholesterol stones(25.33%) and remaining one case comprised of both black and
cholesterol stones(1.33%). The age of case and control groups varied from 15 to
80 years with maximum frequency of 36 falls in age group of 41 – 60 years.
The mean age for calculous cholecystitis was 44.79 with SD of 13.53 and
50
TABLE 2 :AGE GROUP 1 : ≤ 20, GROUP 2 : 21 – 40, GROUP 3 : 41 – 60,
GROUP 4 : ≥60.
Age
group
1 2 3 4 Total p value
Control 2 23 35 15 75 <0.0001 pearson chi square test
Calculous 2 21 25 8 56
Acalculous 7 0 11 1 19
11 44 71 24
In our study, various histopathological alterations were observed in each
layers of calculous and acalculous cholecystitis and compared with control. In
both calculous and acalculous cholecystitis, epithelial hyperplasia, intactness,
minimum and maximum erosion were noted. Thickness of lamina propria and
mucosal invaginations called Rokitansky aschoff sinuses were found and
estimated. Maximum to minimum inflammatory infiltrates such as lymphocytes,
51
CHART NO. 1: GENDER DISTRIBUTION AMONG CASE GROUP
CHANGES IN EPITHELIUM :
In epithelial layer of calculous cholecystitis, predominant histopathological
alterations were estimated. Maximum epithelial erosion was calculated as 95.94%,
minimum epithelial erosion as 12.66%, maximum epithelial hyperplasia as
16.67% and maximum intactness as 87.33%. Epithelial metaplasia such as goblet
and intestinal type were not observed. Compared to control groups, it showed a
significant p value of < 0.0001.
In case of acalculous cholecystitis, maximum and minimum epithelial
erosion were calculated as 93.79% and 15.45% respectively. Epithelial distortion
like hyperplasia was noted and estimated as 1.44% and maximum intactness as
84.55%. Epithelial metaplasia was not found. It showed a significant p value of <
0.0001 when compared to control groups.
66.67% 33.33%
Gender
Females
52
CHART NO. 2: CHANGES SEEN IN EPITHELIUM OF CALCULOUS CHOLECYSTITIS
47.68
52.32
3.54 4.06
12.66
0.60 87.33
95.94
16.67
0.00 20.00 40.00 60.00 80.00 100.00 120.00
INTACT EROSION HYPERPLASIA
Axis Title
Epithelium
53
CHART NO. 3: CHANGES SEEN IN EPITHELIUM OF ACALCULOUS CHOLECYSTITIS.
CHANGES IN LAMINA PROPRIA :
Predominant histopathological alterations of lamina propria were found
and estimated. In calculous cholecystitis, maximum irregularity and gap between
the lamina propria and mucosal layer were estimated as 21.59% and maximum
lymphocytic infiltration as 94%. Percentage of plasma cells and macrophages 54.07 6.21 84.55 45.94 15.45 93.79
2.26 1.44 3.60
0.00 10.00 20.00 30.00 40.00 50.00 60.00 70.00 80.00 90.00 100.00
Mean Minimum Maximum
Axis Title
Epithelium
54
were estimated as 24% and 15 % respectively. Compared to control groups, it
showed a significant p value of < 0.0001.
CHART NO.4: CHANGES SEEN IN LAMINA PROPRIA OF CALCULOUS CHOLECYSTITIS.
14.30
71.70
6.11 7.72
7.73
16
1 1
21.59
98
24
15
0.00 20.00 40.00 60.00 80.00 100.00 120.00
IRREGULARITY & GAP LYMPHOCYTES PLASMA MACROPHAGES
Axis Title
Lamina propria
55
CHART NO.5 : CHANGES SEEN IN LAMINA PROPRIA OF ACALCULOUS CHOLECYSTITIS.
In acalculous cholecystitis, maximum irregularity and gap between the
lamina propria and mucosal layer were estimated as 63.63% and maximum
lymphocytic infiltration as 98%. Percentage of plasma cells and macrophages
were estimated as 7% and 14% respectively. On comparison with control
groups,it showed a significant p value of < 0.0001. 38.76 62.42 4.83 5.42 13.34 32 2 1 66.63 94 7 14 0.00 10.00 20.00 30.00 40.00 50.00 60.00 70.00 80.00 90.00 100.00
IRREGULARITY & GAP LYMPHOCYTES PLASMA MACROPHAGES
Axis Title
Lamina propria
56
CHART NO. 6: COMPARISON OF LAMINA PROPRIA THICKNESS IN CALCULOUS AND ACALCULOUS CHOLECYSTITIS.
In addition to the above criteria, thickness of lamina propria was estimated
and found to be an average of 332.16 microns in calculous cholecystitis whereas
367 microns in acalculous cholecystitis. 332.16
367
310.00 320.00 330.00 340.00 350.00 360.00 370.00
Calculus Acalculous
Axis Title
Thickness of lamina propria
57
CHART NO. 7: CHANGES SEEN IN MUSCULAR LAYER OF CALCULOUS CHOLECYSTITIS.
CHANGES IN MUSCULAR LAYER :
Predominant changes in muscular layer were observed and found. In
calculous cholecytitis, R.A sinuses were calculated as a maximum of 27.56%.
Infiltrates such as lymphocytes, plasma cells and macrophages were estimated as
maximum of 98%, 11% and 12% respectively. 7.64 66.02 4.74 5.56 3.06 26 1 1 27.56 98 11 12 0.00 20.00 40.00 60.00 80.00 100.00 120.00
R.A SINUS LYMPHOCYTES PLASMA MACROPHAGES
Axis Title
Muscular layer
58
CHART NO. 8: CHANGES SEEN IN MUSCULAR LAYER OF ACALCULOUS CHOLECYSTITIS.
In acalculous cholecytitis, R.A sinuses were calculated as a maximum of
4.14%. Inflammatory infiltrates such as lymphocytes, plasma cells and
macrophages were estimated in muscular layer as maximum of 86%, 8% and 9%
respectively. 3.76 53.26 4.22 5.17 3.37 16.00 1.00 1.00 4.14 86.00 8.00 9.00 0.00 10.00 20.00 30.00 40.00 50.00 60.00 70.00 80.00 90.00 100.00
R.A SINUS LYMPHOCYTES PLASMA MACROPHAGES
Axis Title
Muscular layer
59
CHART NO. 9: CHANGES SEEN IN SEROSA OF CALCULOUS CHOLECYSTITIS.
CHANGES IN SEROSAL LAYER :
Predominant alterations of serosal layer were found in calculous
cholecystitis and estimated as 88% maximum infiltration of lymphocytes. Others
like plasma cells and macrophage showed maximum infiltration of 12% and 24%
respectively. 47.25 10 88 4.94 1 12 7.42 1 24 0.00 10.00 20.00 30.00 40.00 50.00 60.00 70.00 80.00 90.00 100.00
Mean Minimum Maximum
Serosa
60
CHART NO. 10: CHANGES SEEN IN SEROSA OF ACALCULOUS CHOLECYSTITIS.
In acalculous cholecytitis, inflammatory infiltrates such as lymphocytes,
plasma cells and macrophages were estimated in serosal lasyer as maximum of
79%, 4% and 9% respectively. 43.84
11.00
79.00
2.25 5.00 1.00 2.00 4.00
9.00
0.00 10.00 20.00 30.00 40.00 50.00 60.00 70.00 80.00 90.00
Mean Minimum Maximum
Axis Title
Serosa
61
TABLE 3 : SHOWS DESCRIPTIVES
Descriptives
N
Mean S.D Min Max
EPI_INTA Control 75 100.00 0.00 100 100
Calculous 56 47.68 22.19 4.06 87.33
Acalculous 19 54.07 24.45 6.21 84.55
PI_EROS Control 0 . . . .
Calculous 56 52.32 22.19 12.66 95.94
Acalculous 19 45.94 24.45 15.45 93.79
EPI_DIST Control 0 . . . .
Calculous 28 3.54 3.69 0.6 16.67
Acalculous 7 2.26 0.78 1.44 3.6
LAM_THIC Control 75 203.01 62.10 110.8 410.1
Calculus 56 332.16 180.51 63.77 875.2
Acalculus 19 367.00 169.79 58.21 748.7
LAM_IR Control 0 . . . .
Calculous 6 14.30 5.38 7.73 21.59
Acalculous 4 38.76 29.11 13.34 66.63
62
Calculous 56 71.70 18.98 16 98
Acalculous 19 62.42 16.05 32 94
LAM_PL Control 0 . . . .
Calculous 36 6.11 4.70 1 24
Acalculous 12 4.83 1.64 2 7
LAM_MAC Control 0 . . . .
Calculous 39 7.72 3.27 1 15
Acalculous 12 5.42 4.36 1 14
MUSC_RA Control 0 . . . .
Calculous 14 7.64 6.32 3.06 27.56
Acalculous 2 3.76 0.54 3.37 4.14
MUSC_LYM Control 0 . . . .
Calculous 56 66.02 18.95 26 98
Acalculous 19 53.26 19.92 16 86
MUSC_PL Control 0 . . . .
Calculous 31 4.74 2.71 1 11
Acalculous 9 4.22 2.28 1 8
MUSC_MAC Control 0 . . . .
63
Acalculous 12 5.17 3.10 1 9
SER_LYM Control 0 . . . .
Calculous 56 47.25 21.65 10 88
Acalculous 19 43.84 19.74 11 79
SER_PL Control 0 . . . .
Calculous 18 4.94 3.04 1 12
Acalculous 4 2.25 1.26 1 4
SER_MAC Control 0 . . . .
Calculous 24 7.42 5.06 1 24
Acalculous 5 5.00 2.92 2 9
EPI – Epithelium, INTA - intact, EROS – erosion, DIST – distortion, LAM
– lamina propria, THIC – thickness, IR – irregularity & gap, LYM – lymphocytes,
PL – plasma cells, MAC – macrophages.
The average values for each statistical criteria in both calculous and
64
CHART NO. 11 : COMPARISION OF EPITHELIAL CHANGES BETWEEN CALCULOUS AND ACALCULOUS CHOLECYSTITIS.
47.68
52.32
3.54 45.94
2.26
0.00 10.00 20.00 30.00 40.00 50.00 60.00
INTACT EROSION HYPERPLASIA
Axis Title
Epithelium
65
CHART NO. 12 : COMPARISION OF CHANGES IN LAMINA PROPRIA BETWEEN CALCULOUS AND ACALCULOUS CHOLECYSTITIS
14.30
71.70
6.11 7.72
38.76
62.42
4.83 5.42
0.00 10.00 20.00 30.00 40.00 50.00 60.00 70.00 80.00
IRREGULARITY & GAP LYMPHOCYTES PLASMA MACROPHAGES
Axis Title
Lamina propria
66
CHART NO. 13 : COMPARISION OF CHANGES IN MUSCULAR LAYER BETWEEN CALCULOUS AND ACALCULOUS CHOLECYSTITIS
7.64
66.02
4.74 5.56
3.76
53.26
4.22 5.17
0.00 10.00 20.00 30.00 40.00 50.00 60.00 70.00 80.00
R.A SINUS LYMPHOCYTES PLASMA MACROPHAGES
Axis Title
Muscular
67
CHART NO. 14 : COMPARISION OF CHANGES IN SEROSAL LAYER BETWEEN CALCULOUS AND ACALCULOUS CHOLECYSTITIS
47.25
4.94 7.42
43.84
2.25
5.00
0.00 10.00 20.00 30.00 40.00 50.00 60.00
LYMPHOCYTES PLASMA MACROPHAGES
Axis Title
SEROSA
68
TABLE 4 : STATISTICAL COMPARISON BETWEEN THE STUDY GROUPS
Multiple Comparisons
Bonferroni
Dependent Variable
(I) GROUP (J) GROUP SIG
EPI_INTA Control Calculous <0.0001
Acalculous <0.0001
Calculous Control <0.0001
Acalculous 0.408
Acalculous Control <0.0001
Calculous 0.408
LAM_THIC Control Calculous <0.0001
Acalculous <0.0001
Calculous Control <0.0001
Acalculous 0.975
Acalculous Control <0.0001
Calculous 0.975
LAM_LYM Control Calculous <0.0001
69
EPI - Epithelium, INTA – Intact, LAM – Lamina propria,THIC – Thickness,
LYM- Lymphocytes
Based on statistical evidence, the present study showed a significant p
value of < 0.0001 between control group and calculous cholecystitis. Similarly,
control group and acalculous cholecystitis also showed a significant p value of <
0.0001.
Calculous Control <0.0001
Acalculous 0.152
Acalculous Control <0.0001
70
FIG.19 :A case of calculous cholecystitis showing mucosal erosions and lamina propria thickness with dense inflammatory cells in lamina propria
[image:84.595.108.506.95.368.2]and muscular layer (10X).
71
[image:85.595.110.506.330.700.2]FIG. 21: Photomicrograph showing mucosal hyperplasia and dense inflammatory cells in lamina propria and muscular layer (10X).
FIG. 22: Photomicrograph showing mucosal erosions withR.A sinus ifiltrating into the muscular layer and inflammatory cells in lamina propria
72
FIG. 23: Photomicrograph showing inflammatory infiltrates predominantly lymphocytes, few macrophages and plasma cells in muscular layer(40X).
[image:86.595.104.515.416.725.2]73
DISCUSSION
The study was conducted in Tirunelveli medical college hospital,
Tirunelveli, southern Tamilnadu on operated specimens of gall bladder for both
calculous and acalculous cholecystitis. A total number of 75 cholecystectomy
specimens and 75 controlspecimens obtained from autopsy subjects were
subjected to the histopathological examination and morphometric analysis of
predominant histoarchitectural changes.
In our study, majority of patients were between age group of 41 and 60
years with mean age being 45.58 with S.D of 12.38. The mean ageof the calculous
and acalculous patientswere 44.79 and 46.37 respectively. Tyagi SP et
al[122]studied morphological changes of GB in 415 cholecystectomy specimens at
Aligarh and showed the mean age was 43.6% with most of the cases were seen in
the 4th and 5th decades of life.
With regards to gender, there was a female preponderance in our study
with male to female ratio ratio of 1:2. Of the 75 patients, 66.67% were females
and 33.33% were male. Santhosh Upadhyaya Kafle[123] showed female
predominance in his study conducted in Nepal with male to female ratio of 1:7.16.
In the present study which includes 75 cholecystectomy specimens, 56 specimens
showed the presence of gall stones accounting for 74.66% whereas acalculous
cholecystitis constituted of remaining 25.34% specimens. Among the gall stones,
74
of mixed stones. Tadashi Terada[124] in his study showed 96% among the 540
cholecystectomy specimens in the population of Japan had gall stones among
which 47% were black stones, 19% were cholesterol stones and 33% were having
mixed stones.
In the present study, routine histopathological examination showed the
following lesions : chronic calculous cholecystitis(69.33%), chronic cholecystitis
without gall stones(18.67%), chronic follicular cholecystitis with gall
stones(2.67%), chronic follicular cholecystitis without gall stones(2.67%), acute
on chronic calculous cholecystitis (2.67%) and acute on chronic acalculous
cholecystitis(4%).
Santhosh Upadhyaya Kafle[123] in his study on the population of Nepal
observed acute on chronic cholecystitis without cholelithiasis (8%), chronic
acalculous cholecystitis with cholesterosis(22%), chronic cholecystitis without
cholelithiasis (50%), chronic cholecystitis with cholelithiasis (8%),
follicularcholecystitis (4%), xanthogranulomatous calculous cholecystitis(2%)
and without stones(6%).
In the present study, all the specimens were then subjected to
morphometric analysis using IS capture software to find out the histopathological
alterations in calculous and acalculous cholecystitis. Finally the results were
compared with age and gender based control specimens.
In our study, we observed that the predominant histopathological
alterations in epithelium were found to be erosion and hyperplasia. Maximum