SERVICE VALUE NETWORKS: INTO PRACTICE
John HAMILTON
Director of E-Business, James Cook University, Cairns, 4870, Australia [email protected] ()
Abstract
Modeling a business to match its customer perceived (and customer desired) outcomes, remains an on-going task. This paper considers shows how a service value networks (SVNs) approach may be engaged to model, and deliver, understanding of the front-end business and its direct engagement with its immediate (or front-end) customers. These front-end customers may be either: (1) its off-line, in-store customers – engaging directly with the business sales staff (or representative), or (2) its on-line, virtual customers – engaging with the business via internet or remote access. In this situation, both the business, and the customer draw upon their respective viewpoints, and both sides influence the interaction. External to these business and customer influences are additional factors that capture the immediate and broader global effects – termed environmental effects. These three business-customer engagement areas of influence are captured by a SVN SEM approach.
Without a business-customer encounter of some kind the likelihood of a services business, and a prospecting customer, successfully engaging in an exchange process is reduced. This exchange may be a physical, and/or services exchange, and/or an information and/or ideas exchange. To the business, this encounter is, in effect, a trade, and as a result, the business targets acquiring an economic exchange that will ultimately deliver a net positive economic outcome. To the customer, external and internal information feeds, servicing, perceived value, and satisfaction, are key encounter drivers. SVNs offers a new way to understand the business-customer encounter, and to then utilize this acquired knowledge to either: (1) build a strategic management model, or (2) reengineer its business networks, and to then create a re-positioned, more customer-aligned business operation – one that is capable of delivering win – win, competitive business-customer solutions.
Keywords: Service value networks, alignment, structural equation modeling
1. Introduction
This study shows the progression of customer engagement may be expanded into a new level of understanding. The approach engages service value networks (SVNs),
2004, 2005, 2006, 2007). By adopting a SVNs approach, a service industry (or a substantial service industry business), may elucidate significant measures by which they may adjust their business model, and drive customer engagement to new levels.
This SVNs approach allows the service industry (or business) to further leverage its economies of scale – drawing on its combined: supply chain and logistics systems, its peripheral and interlinked partners, its ad hoc channels, and its intelligent databases to deliver highly-specific, individual customer solutions (each of which it has attempted to partially align to each respective customer’s, or customer group’s needs) (Brown and Vashistha, 2002, France, Da Rold et al., 2002, Chen and Paulraj, 2004).
The SVNs approach captures and engages business-customer directional communications channels. It draw on the business networks, and to deliver timely, reasoned, cost acceptable, and efficient solutions that the customer perceives to be of suitable value, and from which, the business derives successes and/or profitability (Sampson, 2000, Christensen and Anthony, 2004, Chen and Paulraj, 2004, Hamilton, 2006).
To build a service industry SVN, a survey approach is initially adopted (Hamilton, 2006. Data is then analysed – ultimately using a SVN structural equation modeling (SEM) approach. This approach unlocks the business-customer interface as a complex array of interaction channels, that in combination, match customer perceived servicing, value, and satisfaction level requirements. The interface between the business and the customer is termed the
From the business side a number of business sectors could contribute to the business-customer encounter. Thus measures encompassing possible business sectors must be captured. These sectors are termed ‘front-end business cells’, and the measures applicable to each front-end business cell are termed its ‘interactors’. These interactors (observed variables) engage with the business back-end.
The business back end is a combination of supply chains, value networks, and external networks. These networks are matrixed, and interlinked, via various intelligent artificial and fuzzy logic sorting sieves systems (which are embedded in the information technology and information systems (IT/IS)). They are capable of delivering an economically acceptable, best-guess, reasoned, value-added, suitable, customer solution package.
The SVN SEM approach shows this front-end delivery system involves multiple customer interaction pathways, and that the business-customer encounter acts as a conglomeration of pathways (not one pathway). Each pathway contributes in a different way, and to a different degree, to the final customer outcome and to the resultant customer perception satisfaction level.
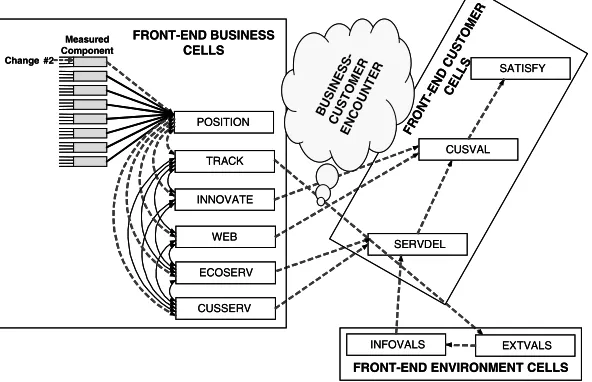
environmental consist of a series of observed variables interactors, that in-turn engage associated back-end business components, that may be changed – like ‘Change #2’.
When the measurable business component attached to the front-end business cell termed POSITION (which contributes to the business’s strategic positioning), and also linked to ‘Change #2’, is varied, be it via a model, or otherwise, it affects the business network systems. The dotted lines shown in Figure 1 portray how these effects are also delivered across: (1) the front-end business cell network; (2) the business-customer encounter, (3) via the environmental systems, and (4) ultimately through to the customer measures. The net customer effect for such a change is typically small. However, combinations of changes acting together, can deliver significant effects. Similarly, a major redirection involving
realigning multiple strategic positioning components can deliver significant changes to customer perceptions.
[image:3.595.126.422.402.593.2]In the real world of business the SVN SEM approach may be used as a basis from which to build a SVNs business. Within this SVNs business solution, a near-real-time management modeling tool may also be incorporated. Hence the manager may now model, and experiment with, the real business data, and so can better model to optimize the management desired business solution set. This solution set may be overlaid into the SVNs intelligence systems as a constraint, or factor to be included in each final outcomes solution. Such an approach makes it extremely difficult for a competing business to copy or imitate the SVNs operating business, as the solution can be varied quickly, or it can even be set to change along with any customer perceptions drift.
Figure 1 Typical front-end service value network
FRO N
T-END CU
STO MER
CE LLS
INNOVATE
WEB
CUSSERV
INFOVALS EXTVALS
CUSVAL SATISFY
SERVDEL TRACK
POSITION
ECOSERV Change #2
FRONT-END BUSINESS CELLS
FRONT-END ENVIRONMENT CELLS
BU SIN
ES S
-CU STO
ME R
EN CO
UN TER
Measured Component
FRO N
T-END CU
STO MER
CE LLS
INNOVATE
WEB
CUSSERV
INFOVALS EXTVALS
CUSVAL SATISFY
SERVDEL TRACK
POSITION
ECOSERV Change #2
FRONT-END BUSINESS CELLS
FRONT-END ENVIRONMENT CELLS
BU SIN
ES S
-CU STO
ME R
EN CO
UN TER
2. SVNs: Theory into Practice
Services industries may use the approach developed for the pharmacy industry in Australia, to build their own industry specific SVN SEM model. For example a nationwide or state transport business network can deliver an appropriate model, as can a tertiary education sector study. This SVNs field of study progressed from theory to reality using the pharmacy in Australia.
The pharmacy industry consisted of eight main business models. This situation was further complexed by competitive differences, and location effects. For example, in various locations several business models may have been in direct competition customers, whilst in other localities no direct competition may have existed.
The eight pharmacy business model groupings also displayed varying degrees of networked back-end to front-end activities. For example, all had government prescription data-entry and recording systems linked directly into the national database, whilst individual stores displayed degrees of local and nation-wide operational, human resources, and financial databases; pharmacy chain displayed varying degrees of supply chain, logistics and networking approaches. In addition, e-pharmacies operated across the spectrum with various website and mobile approaches.
Across the industry, and its national database customer tracking/record-keeping systems, a SVN structure was found to apply. Variations to this overall structure also occurred, especially in some pharmacy chains, and e-pharmacies –
back-end systems were engaged.
External to the business-to-customer systems, the pharmacy industry comes under the influences of the environment. Environmental effects tend to reside on a number of levels – macro or global effects, and micro or immediate and business surrounding effects. Under this study, the macro environmental effects (typically: political, economic, social, technologies, environment and legal), were minimal as at the time of this study, the regional situation was stable (OECD, 2006). Hence complications due to macro effects were negated.
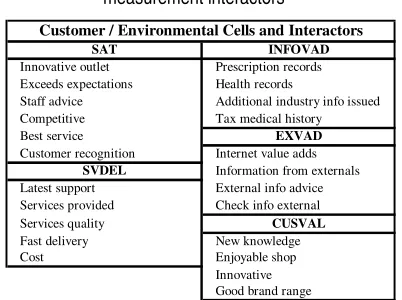
At the micro or store-specific level environmental effects existed, and these were captured as INFOVALS (measures as INFOVAD) – direct pharmacy related information obtained from external sources; and EXTVALS (measured as EXVAD) – external value adding type data. These measures, are shown in Table 1
[image:4.595.284.485.495.645.2]Although environmental effects affected both business, and customers, this study showed only minor influences occurred around the front-end business-customer encounter, and particularly in the customer domain. One explanation for mini-
Table 1 Customer and environmental cells
measurement interactors
SAT INFOVAD
Innovative outlet Prescription records Exceeds expectations Health records
Staff advice Additional industry info issued Competitive Tax medical history
Best service EXVAD
Customer recognition Internet value adds SVDEL Information from externals Latest support External info advice Services provided Check info external Services quality CUSVAL Fast delivery New knowledge Cost Enjoyable shop
mal local environmental change was that offered by the OECD, where it reported Australia, and its business realm, as the second most stable economy in the world during 2005 and 2006. Hence, EXVAD – the external environmental cell interactor set, and INFOVAD – the informing environmental cell interactor set, in-turn affected the customer perspectives, in the manner displayed in Figure 1.
The front-end customer perceived drivers of the SVN SEM (with their net EFA derived latent variable measure shown in brackets) were: SERVDEL (SVDEL) – perceived customer servicing and desired product features; CUSTVAL (CUSVAL) – perceived customer value; and SATISFY (SAT) – satisfaction generated in the customer outcomes achieved by the engagement with the business. Each of these latent drivers constituted a complex variable of measures (as shown in Table 1) that captured industry perceptions in a broad, yet detailed manner.
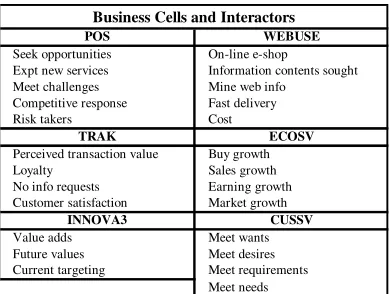
Six front-end business cells – capturing the interactor items displayed in Table 2, are portrayed in Figure 1. These six front-end
busin-Table 2 Business cells measurement interactors
ess cells constituted the business side of the business-customer encounter for this industry. Each business cell (like POSITION), typically captured its four to six key measured variables as a net EFA derived latent variable (like POS). The six business cells with their latent variable shown in brackets were termed: POSITION (POS) – strategic and competitive positioning; TRACK (TRAK) – marketing and customer tracking; INNOVATE (INNOVA3) – new and innovative orientation (INNOVA3 was a complex variable of 17 items); WEB (WEBUSE) – communication and web/IT/operational channels; ECOSERV (ECOSV) – economic and financial imperatives); CUSTSERV (CUSSV) – services and products offered to the customer to win their business.
Figure 1 typified the front-end of a SVNs service industry. To build such a model data was first captured from the business, the broad customer base, and the environment. Seven point Likert scales were utilized. In this type of research large sample sizes should be employed as they greatly enhance the accuracy of SVN SEM calculations (Byrne, 2001, Kline, 2005). For example, considering an Australian transport industry carrying around 180,000 persons per day - a customer sample of 30,000 has been selected. Business surveying in this industry remains complex, and will not be discussed herein, but linkages between operational and executive levels have been drawn into the model’s workable structure. The transport industry business survey group was also positioned as a large data capture set of 1,500 business side cases. This SVNs transport industry is treated as per the pharmacy industry, and again unique business-customer encounter
POS WEBUSE
Seek opportunities On-line e-shop
Expt new services Information contents sought Meet challenges Mine web info
Competitive response Fast delivery Risk takers Cost
TRAK ECOSV
Perceived transaction value Buy growth Loyalty Sales growth No info requests Earning growth Customer satisfaction Market growth
INNOVA3 CUSSV Value adds Meet wants Future values Meet desires Current targeting Meet requirements
[image:5.595.71.266.491.638.2]pathways are be elucidated. In conjunction with this industry, sample findings may be reported at a later date.
3. Test Bed: The Pharmacy Industry
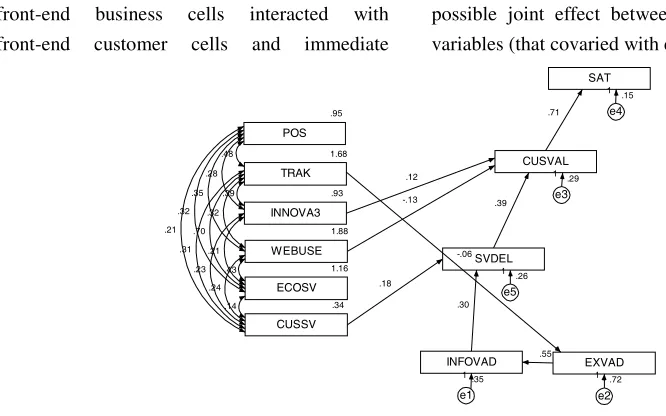
The Australian pharmacy industry was surveyed in 2006, with over 200 business and 800 customer data sets engaged. The data was collated; cleaned; checked for normality and range; grouped in cells; and exploratory factory analysis latent variable grouped for each cell (with reliability and validity measures checked). Loadings and errors (from alpha’s, means, and standard deviations) were then generated and checked for each cell latent variable. AMOS 6.0 and multiple regression modeling was used to test for the cells relationships prior to SEM modeling (Hair, Anderson et al., 1998, Cramer, 2003). The SVNs multiple regression model generated is depicted as Figure 2.The SVN regression model showed six front-end business cells interacted with front-end customer cells and immediate
environmental cells, and all interactions shown were significant at 90% confidence. The front-end business cells also captured additional business-specific immediate environmental effects. A business-customer encounter area was exposed. This encounter showed only certain pathways significantly affected customer perceptions, and only certain approaches could further drive customer perceived servicing, value and satisfaction. Thus, the sequence of variables (and their interaction pathways) from independent, exogenous business cell variables, to the final customer cell dependant, endogenous variables was regression portrayed. The business cells also showed a networking effect with fourteen of the possible fifteen covariance pathways being significant. Potential path complications (none of which were significant) also considered at this stage, included: regression path linearity, the presence or absence of bidirectional or reciprocal flows, or the possible joint effect between two endogenous variables (that covaried with each other). It must
.93
INNOVA3
1.88
WEBUSE
.34
CUSSV
INFOVAD EXVAD
CUSVAL SAT
SVDEL
.35
e1
1 .72
e2
1 .29
e3
1
.15
e4
1
.26
e5
1 .23
.24 .18
.71
.55 .12
.30 .39 -.13
1.68
TRAK
.95
POS
1.16
ECOSV
.28
.21 .32 .35
.43 .31 .21 .70
.32
.14 .39 .48
[image:6.595.67.400.402.610.2]-.06
be noted that this SVN regression modeling process still presents limitations. In particular (1) only multiple dependant, endogenous customer variables display errors (and these errors may add potential difficulties to the model’s interpretation); (2) each independent exogenous business cell variable is assumed to be a measure without error (which is unlikely); and (3) multicolinearity amongst independent exogenous business cell variables (those with values of 0.7 or above) may hinder result interpretation. This pharmacy SVN regression model displayed its excellent fit measures –
χ2/DF = 0.762, p = 0.835, RMR = 0.045, GFI =
0.962, AGFI = 0.924. However, to account for the above regression weaknesses, this pharmacy SVN regression model was moved into a SEM model environment for more detailed and accurate analysis (Hair, Anderson, et al., 1998, Cunningham, Holmes-Smith et al., 2006).
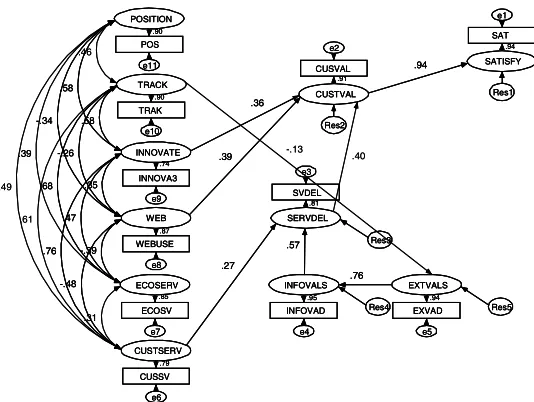
The SVN SEM model, displayed in Figure 3, with (1) business cell errors included; (2) external customer, and customer environmental residual (model unexplained) errors included; (3) covariance values below 0.7 (the one exception on testing still displayed uniqueness); and (4) all paths significant at 90% confidence, showed unstandardized pathways improvement values over the unstandardized regression model (as expected). In addition, this SVN SEM pharmacy model yielded an excellent model with key ‘goodness-of-fit measures’ being better than the
corresponding regression values: χ2/DF = 0.528,
p = 0.987, RMR = 0.016, GFI = 0.974, AGFI =
0.947, again showing the stability and quality of this model. All additional SEM fit measures supported this excellent fit model (Hair, Anderson et al., 1998, Byrne, 2001, Cramer, 2003, Kline, 2005, Cunningham, Holmes-Smith et al., 2006).
[image:7.595.138.405.399.600.2]SATISFY SAT e1 .94 CUSTVAL CUSVAL e2 .91 EXTVALS EXVAD e5 .94 INNOVATE INNOVA3 e9 .74 WEB WEBUSE e8 .87 ECOSERV ECOSV e7 .85 TRACK TRAK e10 .90 POSITION POS e11 .90 CUSTSERV CUSSV e6 .79 SERVDEL SVDEL e3 .81 INFOVALS INFOVAD e4 .95 Res5 Res3 Res4 .76 .57 .27 .39 .36 Res2 Res1 .94 -.35 .47 .58 .58 .76 -.39 -.26 -.34 -.48 .68 .39 .31 .46 .61 .49 .40 -.13 SATISFY SAT e1 .94 CUSTVAL CUSVAL e2 .91 EXTVALS EXVAD e5 .94 INNOVATE INNOVA3 e9 .74 WEB WEBUSE e8 .87 ECOSERV ECOSV e7 .85 TRACK TRAK e10 .90 POSITION POS e11 .90 CUSTSERV CUSSV e6 .79 SERVDEL SVDEL e3 .81 INFOVALS INFOVAD e4 .95 Res5 Res3 Res4 .76 .57 .27 .39 .36 Res2 Res1 .94 -.35 .47 .58 .58 .76 -.39 -.26 -.34 -.48 .68 .39 SATISFY SAT e1 .94 CUSTVAL CUSVAL e2 .91 EXTVALS EXVAD e5 .94 INNOVATE INNOVA3 e9 .74 WEB WEBUSE e8 .87 ECOSERV ECOSV e7 .85 TRACK TRAK e10 .90 POSITION POS e11 .90 CUSTSERV CUSSV e6 .79 SERVDEL SVDEL e3 .81 INFOVALS INFOVAD e4 .95 Res5 Res3 Res4 .76 .57 .27 .39 .36 Res2 Res1 .94 -.35 .47 .58 .58 .76 -.39 -.26 -.34 -.48 .68 .39 .31 .46 .61 .49 .40 -.13
Validation of latent constructs showed construct reliability with all bar two squared multiple correlation constructs above 0.7, and all above 0.55. Hence, item reliability with its construct was acceptable. All covariance correlations were below 0.7 and discriminant validity was acceptable, and all factor loadings were above 0.6, so convergent validity was acceptable.
The resultant full SVN SEM pharmacy model,
with all pathways significant at the p < 0.05 level,
was again checked for reliability (using bootstrapping 1000 times at 90%), and standard sample invariance calibration-validation procedures and validity. The SVN SEM model again passed all criteria (Byrne, 2001, Standage, Duda et al., 2005).
4. Discussion
This empirical pharmacy research indicated the existence of SVNs – particularly at the industry-wide front-end business, and its customer connections level. The SVN multiple regression model displayed business cell networking, and showed four significant pathways between the observed business and dependant customer and customer environmental variables likely existed.
When moved into SEM analysis the same four business-customer encounter pathways existed. The front-end business cell TRACK showed a negative correlation with the external customer environmental feed cell EXTVALS, and showed no other direct customer influences. Hence, as this pathway offered another channel of contribution to customer perception, a realignment of the front-end business cell should
The TRACK business cell also influenced the business cells INNOVATE, ECOSERV, and CUSTSERV and these channels should also be further targeted for improvement. Thus, market orientated strategies for this services industry should be a major focus – targeted at delivering both a more competitive, and customer focused solution set. To deliver such a solution the front-end business cell interactors may be adjusted, the model re-run, and the relevant measures noted for improvement (or decline) in alignment. The best solution is thus iteratively determined, and may then be implemented. In the future this approach may be computer modeled, attached to real-time, updating, back-end business networks and intelligent databases, and then used as a management assisting decision tool.
across this divide has been an approximation, and the business and customer alignment differences have been adjusted in a lock-step manner. In contrast, SVNs offer a broader capture mechanism- one capable of delivering specific ‘customerized’ solutions and that can be set to recognise and move with changes or drifts in the customer focus (Hamilton, 2005, 2007).
Another area for further development in this study was business cell networking related to the WEB business cell. A significant number of customers utilized the communication sources captured under the WEB business cell, yet the pharmacists, and pharmacy senior managers, in general, did not see this business cell as one that would significantly contribute to their store level business models. This area is a second significant area exposed by the SVNs approach. This business cell is a customer desired source for information and up-skilling (regarding pharmacy related areas), and it is a business cell where this services industry should improve in order to more closely align itself with its customers.
5. Conclusions
This SVN SEM industry-wide approach highlighted the complex nature of the business-customer exchange. This SVNs approach showed that not all business cell constructs (and their interactors) acted directly across the business-customer encounter. The significant and direct pathways (connecting the front-end business to its customers) captured the fields of: innovation; communications (IT, IS, mobile and web operations); services and/or products provided; and target marketing/sales approaches. These direct pathways also showed networked effects into other front-end business
cells.
The non-direct pathway front-end business cells (or fields of engagement) interacting via their measurement interactors, still exhibited some (but indirect) influence across the business-customer encounter.
This study remains an important piece of competitive business research. The SVN SEM approach shows new competitive intelligence possibilities, which can then be built into fully operational SVN business models for services industries.
The SVN SEM approach applies to many service sectors, like tourism, health, mass transport, and education. This approach is also projected to apply beyond the services area. When used correctly, a SVNs approach offers greater alignment of the business to its specific customer-base, and constituent individuals. In addition, unique customer specific value adds may be incorporated to enhance customer commitment.
References
[1] Brown, S. & Vashistha, A. (2002). Igniting the services value chain. Services Marketing, 11 (1): 12-13
[2] Byrne, B. (2001). Structural Equation
Modeling with AMOS. Lawrence Erlbaum Associates, Mahwah, NJ
[3] Chen, I. & Paulraj, A. (2004). Towards a theory of supply chain management: The constructs and measurements. Journal of Operations Management, 22(2): 119-150
[4] Christensen, C. & Anthony, S. (2004).
[5] Cramer, D. (2003). Advanced Quantitative Data Analysis. McGraw-Hill, New York, NY [6] Cunningham, E., Holmes-Smith, P. & Coote, L. (2006). Structural Equation Modeling: From the Fundamentals to Advanced Topics. Streams Statsline, Melbourne
[7] France, N., Da Rold, C. & Young, A. (2002). Services value chain reshapes IT services industry. Gartner Group Research, AV-21-3090: 1-4
[8] Hair, J., Anderson, R., Tatham, R. & Black, W. (1998). Multivariate Data Analysis, With
Readings (5th ed.). Prentice Hall, Englewood
Cliffs
[9] Hamilton, J. (2004). Service value networks: Value, performance and strategy for the services industry. Journal of Systems Science and Systems Engineering, 13 (4): 469-489 [10] Hamilton, J. (2005). Service value networks:
A new approach to performance and the delivery of services. The E-Business Review, 5 (1): 66-71
[11] Hamilton, J. (2006). Business-customer alignment in the Australian pharmaceutical industry. International Journal of E-Business, 4 (5): 401-420
[12] Hamilton, J. (2007). Service value networks: From theory to practice. The E-Business Review, 7 (1): 1-11
[13] OECD. (2006). Economic survey of
Australia, 2006. OECD Economic Surveys, 12: 1-154
[14] Kline, R. (2005). Principles and Practices of
Structural Equation Modeling (2nd ed.).
Guildford Press, New York, NY
[15] Sampson, S. (2000). Customer-supplier duality and bidirectional supply chains in
Service Industry Management, 11 (2): 348-364
[16] Standage, M., Duda, J. & Ntoumanis, N. (2005). A model of contextual motivation in physical education: using constructs from self-determination and achievement goal theories to predict physical activity intentions. Journal of Education Psychology, 95 (1): 97-110
John Hamilton, PhD (Macquarie Graduate School of Management, Macquarie University, Sydney, Australia) is the Director of E-Business at James Cook University. His current prime research interest areas are competitiveness, innovation and the future. He has developed his SVNs concepts into highly agile business approaches – that are capable of near-real-time, business-to-customer ‘customerized’ solutions, whilst also delivering enhanced business competitive advantage. John’s ongoing SVNs research targets services industries (like: education, health and transport), marketspaces, and customerization.