568 Published By: Blue Eyes Intelligence Engineering & Sciences Publication
Retrieval NumberK15760981119/2019©BEIESP DOI: 10.35940/ijitee.K1576.0881119
Social Spider Optimization with Tumbling Effect
Based Data Classification Model for Stock Price
Prediction
R. Saravanan, P. Sujatha, G. Kadiravan, J. Uthayakumar
Abstract: In last decade, data classification become more famous which aims to classify the data to a fixed number of classes. The data classification problem is treated as an NP hard problem and different optimization models are presented to resolve it. This paper introduces a social spider optimization (SSO) algorithm with tumbling effect called SSO-T algorithm to solve the data classification problem. First, the SSO algorithm is derived to solve the classification process which is considered as a NP hard problem. Next, to further enhance the exploration process of SSO algorithm, it is modified by the inclusion of tumbling effect, called SSO-T algorithm. For validating the results of the SSO and SSO-T algorithm, a real time problem of stock price prediction (SSP) is employed. For experimentation, the results are validated by testing the SSO and SSO-T algorithms against four datasets such as Dow Jones Index (DJI) dataset, three own datasets gathered from Yahoo finance on the basis of daily, weekly and yearly. The empirical result states that the proposed algorithms perform well and it is noted that the classification performance of the SSO algorithm is increased by the inclusion of tumbling effect.
Keywords: Social Spider algorithm; Urban data; Classification; Tumbling effect; Stock price prediction.
I. INTRODUCTION
With the design and development of urban areas, opportunities and challenges arise at the moment. In recent days, people living in urban areas are showing more interest on business sectors and it leads to the generation of big data in various form. To handle the massive urban big data, data classification algorithms can be utilized. Data classification is a viral part in the data mining process, which is employed to the databases for labeling the new input objects whose labels are not known [1]. The data classification techniques aim to extract the relationship between a collection of feature variables and a target variable of interest. As various real-world problems are often defined by the relationship between the available features and target variable, it achieves a wide range of a classifier model, attained from a sample of has objects from the database where the labels are already present
Revised Manuscript Received on September2, 2019.
R. Saravanan, Department of Computer Science, Pondicherry University, Puducherry,
P. Sujatha, Department of Computer Science, Pondicherry University, Puducherry, India,
G. Kadiravan Department of Computer Science, Pondicherry University, Puducherry, India,
J. Uthayakumar, Department of Computer Science, Pondicherry University, Puducherry, India
The procedure of construction such kind of model is called learning or training and it refers to the parameter changes of the algorithm for maximizing the generalization ability [2]. The prediction for unlabeled data is carried out by the models created in the training process or few of the lazy learning processes that the capability of comparing objects classified previously with the new objects needs to be classified. The outcome of a classification method may be applied for a test instance in any of the two ways namely discrete label and numerical score. In the former type, a label will be assigned for the test instances. In the latter type, a numerical score will be provided to every class label and test instance combination. It is noted that the numeric score can be transformed to a discrete label for a test instance, by choosing the class with the high score for that test instance.
The benefit of a numerical score is that providing a possibility for comparing the relativity of various test instances which belongs to a specific class of importance, and rank them under requirement. Data classification is a supervised learning approach where the machine learns something from the provided input data and then employs the learning process for classifying the new observation. This dataset might contain only two class labels such as identifying the mail as spam or not, and sometimes it might contain many classes. Various application areas of data classification problems are speech recognition, handwriting recognition, bio metric identification, document classification etc [3].
The stock price prediction is also an important data classification problem which aims to classify the stocks as profit or loss, i.e. stock prices rises or not. Stock is a crucial investment in financial sectors and presently it seeks much attention among the research community. Investors and research people are considering multidimensional factors to suggest a methodology that will choose the stock precisely with the guaranteed profit in return. Due to the diverging nature of SPP, it is diligent to predict stock prices each and every business day. An accurate SPP can lead the investors to gain higher profit while exchanging stocks. Hence unambiguously, SPP has become more popular and highly helpful for investors [4]. A study [5] revealed that a proper SPP can lead the trading to a more profitable way and it also recommended that researchers should concentrate on precisely identifying the direction of movement and to reduce the variations from the real observed values.
Social Spider Optimization with Tumbling Effect Based Data Classification Model for Stock Price Prediction
But, the performance of stock exchange is based on several qualitative factors like politics, economics, weather, etc. The stock markets rapidly changing and they show more variation. This nonlinear and complex nature of stock market makes SPP more difficult [7, 8]. The prediction of future stock prices is defined by factors like data intensity, noise, non-stationary, random nature, uncertainties and invisible interlinks [9–11].
Generally, there are two classifications of SPP which includes the SPP movement and predicting the value of the stock price. The first type is considered as a classification problem and the other is treated as a regression problem. But both depend on auto regression and multi-variable regression models. The auto regression model treats the problem based on time sequences and the sequences are partitioned to various segments. The partitioned segments are employed as raw data for SPP. In multi-variable regression model, the technical variables are chosen as raw data for SPP.
In recent years, many methods have been proposed to predict the trends in stock price variations. Prediction of upcoming stock price using the existing financial information is highly valuable for investors. Investors like to predict the increasing or decreasing trends in stock price over a period of time. Prior to making an investment decision in a firm, a prediction method was used to foresee stock prices using the existing and present financial data about the firm. Financial balance sheets and several ratios represent the status of company and it is the fundamental for technical investigation. The experts applied various mathematical models using the previous data to validate company’s intrinsic value like Graham number. Graham number and Graham’s criterion is assumed as a popular method of SPP [12]. Because of increasing instability in the present market scenario, it is very hard to identify a company which satisfies Graham’s principles on current situation. Due to these modifications, the requirement for adjusted models started.
In addition, the stock market trends change over time [13, 14]. Generally, Machine Learning (ML) technique handles SA as a traditional classification problem. Hybrid methods integrate the features of lexicon based and ML methods (Naive Bayes (NB), Bayesian Network (BN), Maximum Entropy (ME), Support Vector Machine (SVM), Neural Network (NN), Decision Tree (DT), etc.) are also applied to solve SPP classification problem. Metaheuristic approaches are also used for SPP due to the nature of effective searching strategies. Some of the meta-heuristic algorithms are ant colony optimization (ACO), particle swarm optimization (PSO), genetic algorithm (GA), artificial bee colony (ABC) optimization, bat algorithm (BA) and so on. Social spider is one of the meta-heuristic algorithm [15], derived from the foraging nature of social spider. SSO algorithm is used in several application areas like electrical engineering, clustering, images processing applications, etc. SSO algorithms are employed to different traditional optimization problems. In [16], a SSO algorithm is presented for global optimization problems. The inflation loss mechanism is used to avoid the premature convergence of SSO algorithm. A SSO algorithm for handling constrained optimization problems is presented in [17]. A hybridization of SSO
algorithm is derived using simplex Nelder-Mead technique [18] to solve the integer programming and min-max problems. The SSS algorithm combines the positive capability to do the exploration and exploitation process whereas the Nelder-Mead method improves the best obtained solution from SSO algorithm. It is intended to enhance the searching capability and avoids the execution of the algorithm with a greater number of iterations with no improvement. A binary social spider (BSS) algorithm is introduced for knapsack KP01 problem [19] effectively. In [20], the SSO algorithm is applied to resolve the non-convex problems of Economic Load Dispatch (ELD).
A modification in SSO algorithm is made and developed a MSSO algorithm [21] for the improving the exploration process of the continuous optimization problem. In [22], the SSO algorithm is integrated to GA to develop a HSSOGA for simplifying the energy function of the molecule. For clustering the text documents, the SSO algorithm is introduced in [23]. In this paper [24], a simple method-based social spider optimization (SMSSO) algorithm is presented to attain effective clustering process. The SSO algorithm is employed in image processing applications. An image fusion approach using SSO algorithm for image enhancement is presented in [25]. In [26], a histogram based bi-modal and multi-modal thresholding is developed for grayscale images by the use of SSO algorithm. In this paper, we introduce new SSO algorithm for data classification problem to identify the classes for every applied instance. The SSO algorithm is derived for the data classification process to classify the data in an effective way. To further enhance the exploration process of SSO algorithm, it is modified by the inclusion of tumbling effect, called SSO-T algorithm. In order to validate the performance of the SSO and SSO-T algorithm, a real time problem of stock price prediction is employed. For experimentation, the results are validated by testing the SSO and SSO-T algorithms against four datasets such as Dow Jones index (DJI) dataset, three own datasets gathered from Yahoo finance on the basis of daily, weekly and yearly. The empirical result states that the proposed algorithms perform well and it is noted that the classification performance of the SSO algorithm is increased by the inclusion of tumbling effect.
The paper organization is given as follows: The proposed SSO-T algorithm is explained in Section 1. The experimental analysis and conclusions are provided in Section 3 and Section 4 respectively.
II. PROPOSED DATA CLASSIFICATION ALGORITHM The proposed SSO based data classification operates as follows: the female spiders in the colony members determine the class label based on the attributes hold by the male spiders. The male spiders indicate the value of the attribute using the intensity of the vibration. Based on the intensity of the vibration reached by the female spider, the attribute value will be determined and decides the class label for every instance. The pseudo code of the SSO algorithm for data classification is given in Algorithm I and the variables used are given in Table 1.
570 Published By: Blue Eyes Intelligence Engineering & Sciences Publication
Retrieval NumberK15760981119/2019©BEIESP DOI: 10.35940/ijitee.K1576.0881119
web, where each social spider interacts with one another. Every solution in the search space indicates the position of the spider in the communal web. Each spider will receive a weight based on the fitness value of the solution that is defined by the social-spider. The SSO algorithm defines two types of search agents namely male spiders and female spiders. The overall operation of the SSO algorithm is illustrated in Fig. 1, which comprises of four blocks namely population initialization, female cooperative operator, male cooperative operator and mating operator.
Fig. 1. Workflow of SS algorithm A.
Initialization
The SSO algorithm starts with the initialization of the population of spider positions (solutions). The whole population contains female and male spiders. The number of ( ) is arbitrarily selected between 65-90% and is determined by Eq. (1) and the number of ( is also determined by Eq. (2):
(1)
(2)
The position of the is randomly generated between the lower and upper initial parameter bound and which are represented by
(3)
where . Then, the position of the is also randomly generated and equated as
(4)
where .
B.
Fitness assignation
Biologically, the size of the spiders is the main feature that is used to evaluate spider's capacity to accomplish the allocated process. In the proposed model, each spider receives a weight that indicates the solution quality of the spider (irrespective of gender) of the population . The weight of the each spider is determined as
where is the fitness value, and is the maximum and minimum values of the solution
The values and are represented using the following Eq. (6)
(6)
C.
Vibration modeling
The communal web is treated as a communication medium to exchange information between the members of the colony. This information is coded as small vibrations which are important for the cooperative operation of every individual in the population. The vibrations are based on the weight and distance of the spider which has produced it. As the distance is related to the individuals that generates the vibrations and the colony members are present in the nearby distance will receive stronger vibrations and vice versa. To information exchange between the colony members and , the vibration can be mathematically defined as follows:
where is the Euclidian distance between two colony members and .Using these vibrations, the attribute value of the instance will be sent by the member to member
There are three kinds of vibrations takes place between and and they are represented as , and . Vibrations is received by the individual i (si) as a result of the information sent by the member c (sc) which is closer to as well as with higher weight compared to (wc > wi).
The vibrations Vibbi received by the individual as a result of the information transmitted by the member b (sb) which has best weight (best fitness value) of the whole entire population S,
Finally, defines the information transmitted from the member i to the nearest female individual can be represented as
D.
Female cooperative operator
Social Spider Optimization with Tumbling Effect Based Data Classification Model for Stock Price Prediction
(11)
E. Male cooperative operator
The has a weight value more than the median of the is called as dominant D and the remaining are called as non-dominant ND. The median weight is indexed by
.The location of the can be equated as
(12)
F. Mating operator
In general, mating is performed between and in case of a is found by in a specific range, the mating range is equated as
(13)
[image:4.595.85.251.425.568.2]The spider with more weight has higher probability of generating the offspring.
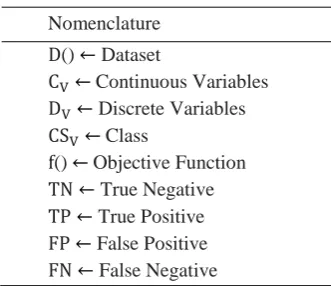
Table 1 Parameters settings
Nomenclature
() Dataset
Continuous Variables Discrete Variables Class
() Objective Function True Negative True Positive False Positive False Negative
To improve the classifier efficiency of the SSO algorithm, tumbling effect is included in the SSO algorithm to resolve the local optima problem. The original SSO algorithm is modified using the bacterial foraging strategies and developed a SSO-T algorithm. The new solutions are generated using the equations motivated by the concept of bacterial foraging algorithm (BFO). The bacteria movement in the human intestine in search of nutrient rich location away from toxic surroundings is done using the locomotory organelles called flagella by chemotactic movement in either of the ways, that is, swimming (in the same direction as the previous step) or tumbling (in an absolutely different direction from the previous one). When the spider moves towards the optimum value of fitness function, then type of movement is swimming. Else, the spider follows the chemotactic movement of bacterium and is indicated by
(14)
where is the velocity at time step , and is the random number generated in the range [-1, 1]. The pseudo code of SSO-T algorithm is given in Algorithm II.
Algorithm I: Pseudo code of SSO-T algorithm
Input: Dataset ( ), () Define from
// Discretization Factor for Continuous Variables, Fixed Frequency Distribution (FFD) [1]
using FFD
Initialize the Parameters , Number of Spiders, Dimension of each spider,
// Initialize the Operators for Discrete & Discretized Continuous Variables
//Population Initialization do
do
End For
End For
//Fitness Calculation with Tumbling Effect do
End For Repeat
//Calculation of Mating Radius do
End For
//Calculation of weights of Each Spider do
End For
//Calculation of Vibration of Female Spiders do
End For do
572 Published By: Blue Eyes Intelligence Engineering & Sciences Publication
Retrieval NumberK15760981119/2019©BEIESP DOI: 10.35940/ijitee.K1576.0881119
//Mating Process and Fitness Calculation
Until (termination condition satisfied)
OUTPUT: Optimized Rule Set
III. EXPERIMENTAL RESULTS AND DISCUSSIONS
To ensure the goodness of the proposed SSO-T algorithms, it is applied to the problem of SPP. The dataset, measures and the attained results are discussed in the upcoming subsections.
A. Dataset description
For precise SPP, the dataset is collected by the past history of stock prices of four different datasets with massive instances. The datasets of SPP are namely DJI [36], Yahoo Finance_2007_2017_Daily,Yahoo Finance_2007_ 2017 _Weekly, Yahoo Finance_2007_2017_ Monthly [37] are taken.
The particulars of the dataset are demonstrated in Table 2. The frequency distribution of these dataset is shown in Figs. 2-5. For SPP dataset, the entire count of instances are 4210 and count of the distinct dataset such as DJI, Yahoo
Finance_ 2007_2017_Daily,Yahoo
Finance_2007_2017_Weekly, Yahoo Finance_
2007_2017_Monthly are 750, 2755, 572, 133 correspondingly. For DJI dataset, among the total number of instances, there are 375 instances for both increased and
decreased in stock prices. For Yahoo
[image:5.595.304.545.49.180.2]Finance_2007_2017_Daily, there are 1269 instances for increase stock prices and 1486 for decreased stock prices. For Yahoo Finance_2007_2017_Weekly, there are 247 increased stock prices and 325 decreased stock prices. For Yahoo Finance_2007_2017_Monthly, there are 48 instances which are increased stock prices and 85 which are decreased stock prices. Among these datasets, Yahoo Finance_2007_ 2017_Daily has large number of increased and decreased stock rates.
Table 2 Dataset Description
[image:5.595.300.549.226.709.2]Fig. 2. Frequency distribution of Dow Jones Index (DJI) Dataset
Fig. 3. Frequency distribution of Yahoo Finance _2007 _2017 _Daily Dataset
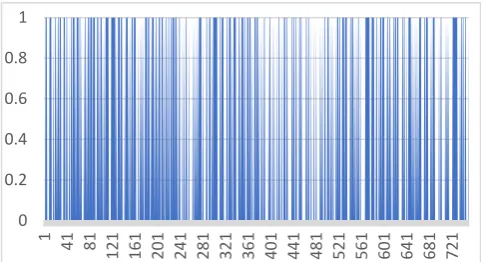
Fig. 4. Frequency distribution of Yahoo Finance _2007 _2017 _Weekly Dataset
Fig. 5. Frequency distribution of Yahoo Finance _2007 _2017 _Monthly Dataset
0 0.2 0.4 0.6 0.8 1
1 41 81
121 161 201 241 281 321 361 401 441 481 521 561 601 641 681 721
0 0.2 0.4 0.6 0.8 1
1 9 17 25 33 41 49 57 65 73 81 89 97
[image:5.595.51.297.517.660.2]Social Spider Optimization with Tumbling Effect Based Data Classification Model for Stock Price Prediction
B. Performance Measures
To assess the performance of SSO and SSO-T algorithms against four dataset, 15 measures are used which are generated from a 2x2 confusion matrix. It is generally a 2x2 matrix and contains 4 elements related to real and predicted classes. The elements in confusion matrix are True Positive (TP), False Negative (FN), False Positive (FP) and True Negative (TN) values. The overall performance of the model is determined using the data present in the matrix. The performance measures include false positive rate (FPR), false negative rate (FNR), sensitivity, specificity, accuracy, F-score, Youden's index (Y), Positive likelihood (ρ+), Negative likelihood (ρ-), Discriminant power (DP), G-measure, Mathew correlation coefficient (MCC), false discovery rate (FDR), false omission rate (FOR) and kappa value.
IV. RESULTS ANALYSIS A. Dow Jones Index (DJI) dataset
Table 3 and Table 4 provide the confusion matrix and the classification results attained by the SSO and SSO-T algorithms. Among the total 750 instances in DJI dataset, 361 instances are correctly classified to increased stock prices and 363 instances are correctly classified into decreased stock prices. With respect to the classification performance, the results of the proposed algorithms are ensured by comparing its results with six other classifiers namely ACO, XGBoost, OlexGA, MLP, RBF and RF. Regarding the classifier results, DL-TLBO model is verified by comparing its results with three classifiers include DL, LR and RBF models.
Table 4 values show that the proposed SSO algorithm attains a minimum FPR and FNR values of 7.29 and 6.05 values respectively. At the same time, it is noticed that maximum results is attained by SSO-T algorithm with least values of FPR and FNR. It is noticed that the Olex-GA shows worst performance with a highest FPR value of 50.00. In addition, it is observed that the ACO, XGBoost and RG classifiers manages to perform well than Olex-GA,
MLP and RBF classifiers. But they showed higher FPR and FNR values over the SSO and SSO-T algorithms. Likewise, in terms of sensitivity and specificity, the SSO-T algorithm obtains maximum values of 96.78 and 96.28 respectively whereas the SSO algorithm achieves slightly lower values of 93.94 and 92.7 respectively. In contrast, the RBF attains a lowest sensitivity and specificity values of 82.22 and 82.57 respectively. In line with, the SSO and SSO-T algorithm achieves a maximum accuracy of 96.33 and 96.53 respectively. Similarly, the SSO and SSO-T algorithms reported F-score values of 93.45 and 96.52 which are higher than the values obtained by the compared methods. The higher value of kappa represents the measure of agreement between experts and models; the value closer to 100 indicates better system performance. The kappa value of SSO and SSO-T algorithms are 93.06 and 86.66 indicating
effective classification performance.
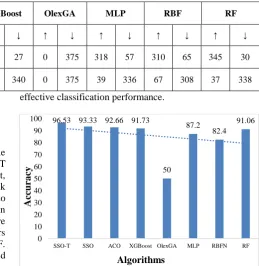
Fig. 6. Comparison of Various Methods in terms of Accuracy (DJI Dataset)
At the same time, the compared methods such as RBF and MLP attain minimum kappa methods, it also attains inferior results to the SSO and SSO-T algorithms value. Though the ACO algorithm outperforms the compared.
96.53 93.33 92.66 91.73
50 87.2
82.4 91.06
0 10 20 30 40 50 60 70 80 90 100
SSO-T SSO ACO XGBoost OlexGA MLP RBFN RF
Acc
ura
cy
Algorithms Table 3. Confusion matrix for the DJI dataset
Experts
SSO-T SSO ACO XGBoost OlexGA MLP RBF RF
↑ ↓ ↑ ↓ ↑ ↓ ↑ ↓ ↑ ↓ ↑ ↓ ↑ ↓ ↑ ↓
↑ 361 14 357 27 350 25 348 27 0 375 318 57 310 65 345 30
[image:6.595.285.545.252.519.2]574 Published By: Blue Eyes Intelligence Engineering & Sciences Publication
Retrieval NumberK15760981119/2019©BEIESP DOI: 10.35940/ijitee.K1576.0881119
B. Yahoo Finance _2007 _2017 _Daily Dataset
The confusion matrix and the classification results obtained from them are given in Table 5 and Table 6. From the total of 2755 instances in Yahoo Finance daily dataset, 820 instances are correctly classified to increased stock prices and 1462 instances are correctly classified into decreased stock price. In contrast, the number of instances correctly classified to increased and decreased stock is 565 and 610 respectively.
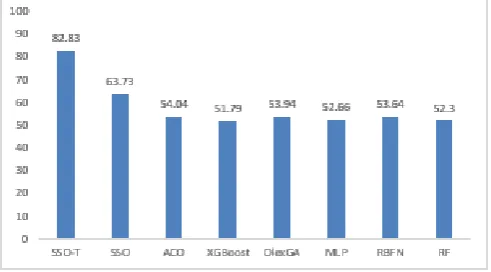
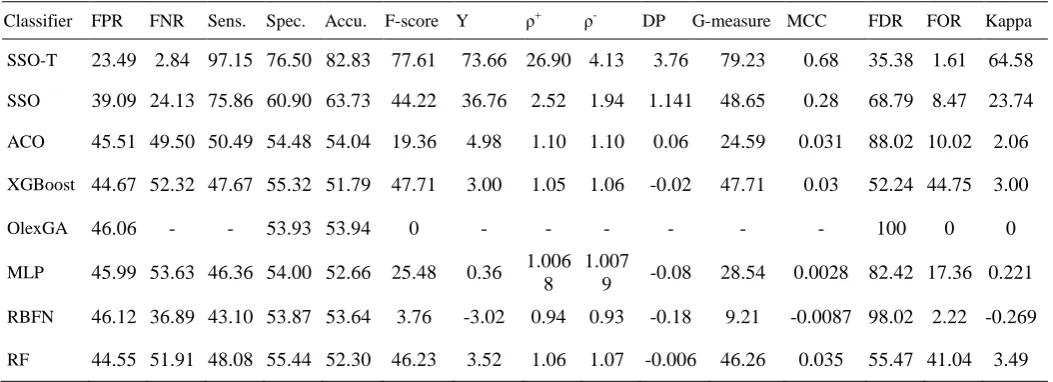
Based on the classification performance, the obtained values are the comparative results are tabulated in Table. As said earlier, the value of FPR, FNR, FOR and FDR should be as low as possible. From the table, it is showed that the FPR, FNR, FOR and FDR are 39.09, 24.13, 8.47 and 68.73 respectively. At the same time, it is noted that maximum results is attained by SSO-T algorithm with least values of FPR, FNR, FOR and FDR. It is observed that the poor performance interms of FPR, FNR, FOR and FDR are attained by XGBoost, Olex-GA, RBF and MLP. In continuity, the value of the classification accuracy is significantly higher for SSO-T algorithm with a value of 82.83 whereas the SSO algorithm attains an accuracy of 63.73. From the Fig. 7, it is clear that the order of increased classification performance is SSO-T, SSO, ACO, XGBoost, Olex-GA, MLP, RBF and RF respectively. In addition, in terms of sensitivity and specificity, the SSO-T algorithm obtains maximum values of 97.15 and 76.50 respectively whereas the SSO algorithm achieves slightly lower values of 75.86 and 60.9 respectively. Contrastingly, the RBF attains a lowest sensitivity and specificity values of 43.1 and 53.87
[image:7.595.41.557.71.256.2]respectively. In line with, the XGBoost, RBF and RF classifiers showed competitive performance and it fails to outperform SSO and T algorithms. Similarly, the SSO-T algorithm reported an F-score of 77.61 which is higher than the values obtained by the compared methods. Next, the F-score attained by XGBoost and RF classifiers are better with the values of 47.71 and 46.23 respectively. Though these classifiers shows better performance over other classifiers, it fails to outperform the proposed SSO-T algorithm. The kappa value of SSO and SSO-T algorithms are 64.58 and 23.74 indicating effective classification results. At the same time, RBF classifier attains the negative performance with the F-score of -0.269. Though the RF and XG-Boost classifiers outperform the compared methods, it also attains inferior results to the SSO and SSO-T algorithms.
Fig. 7. Comparison of Various Methods in terms of Accuracy (Yahoo Finance Daily Dataset) Table 4 Comparison of proposed method with existing methods for Dow Jones Index (DJI) Dataset
Classifier FPR FNR Sens. Spec. Accu. F-score Y ρ+ ρ- DP G-measure MCC FDR FOR Kappa
SSO-T 3.71 3.21 96.78 96.28 96.53 96.52 93.06 20.92 3.20 3.74 96.52 0.93 3.73 3.20 93.06
SSO 07.29 06.05 93.94 92.70 93.33 93.45 86.65 15.31 12.87 3.01 93.45 0.86 07.03 06.28 86.66
ACO 06.75 07.89 92.10 93.24 92.66 92.71 85.34 11.81 13.63 2.71 92.71 0.85 06.66 08.00 85.33
XGBoost 07.35 09.13 90.86 92.64 91.73 91.82 83.50 10.13 12.35 2.54 91.82 0.83 07.20 09.33 83.46
OlexGA 50.00 - - 50.00 50.00 0 - - - 100 0 0
MLP 14.50 10.92 89.08 85.49 87.20 86.89 74.57 07.82 06.14 2.29 86.91 0.74 15.20 10.40 74.40
RBFN 17.42 17.77 82.22 82.57 82.40 82.44 64.80 04.64 04.71 1.69 82.44 0.64 17.33 17.86 64.80
RF 08.15 09.68 90.31 91.84 91.06 91.14 82.16 09.48 11.07 2.47 91.15 0.82 08.00 09.86 82.13
Table 5. Confusion matrix for the Yahoo Finance _2007 _2017 _Daily dataset
Experts
SSO-T SSO ACO XGBoost OlexGA MLP RBF RF
↑ ↓ ↑ ↓ ↑ ↓ ↑ ↓ ↑ ↓ ↑ ↓ ↑ ↓ ↑ ↓
↑ 820 449 396 873 152 1117 606 663 0 1269 223 1046 25 1244 565 704
[image:7.595.308.554.576.712.2]Social Spider Optimization with Tumbling Effect Based Data Classification Model for Stock Price Prediction
Table 6. Comparison of proposed method with existing methods for YahooFinance_2007_2017_Daily Dataset
C. Yahoo Finance_2007_2017_Weekly Dataset
The confusion matrix and the classification results obtained from them are given in Table 7 and Table 8. From the total of 572 instances in Yahoo Finance weekly dataset, 223 instances are correctly classified as increased stock prices. Table 8 shows the attained classification results of various methods under several performance metrics for yahoo finance weekly dataset in the year 2007 to 2017. For Weekly dataset, the proposed SSO-T algorithm produces best results and attained a minimum FPR and FNR value of 7.66 and 13.89 respectively. Among the compared methods, RBF classifier showed poor performance with a highest FPR and FNR of 44.92 and 59.47 respectively. At the same time, ACO manages to perform well and showed lower FPR and FNR value than compared methods, it showed inefficiency over SSO and SSO-T algorithms. Although SSO algorithm produces better results than other classifiers, it fails to outperform SSO-T algorithm with the best FPR and FNR of 7.66 and 13.89 respectively. Interms of accuracy, Fig. 8 depicts the comparative results of different classifiers on the Yahoo Finance Weekly dataset. From the Fig., it is shown that order of maximum classification accuracy attained by the different classifiers are SSO-T, SSO, ACO, Olex-GA, XG-Boost, RBF, MLP and RF respectively. In the same way, the SSO classifier showed maximum classification performance with an accuracy of 78.49 which is higher than all the compared models except the proposed SSO-T algorithm. Interestingly, SSO-T algorithm produces
[image:8.595.40.545.296.379.2]maximum predictive performance with an accuracy of 89.51 which is much higher than the compared classifiers. On comparing the classifiers based on kappa value, the results reported that the RBF and RF classifiers showed poor classification results with the negative kappa value of -0.108 and -4.333 respectively. However, the SSO algorithm tries to show better performance with a kappa value of 56.24, it fails to achieve better results over the SSO-T algorithm. From the Table 4 and Fig. 8, it is reported that the classification results based on Yahoo Finance weekly dataset verified that the SSO-T algorithm is found to be efficient than the compared classifiers.
Fig. 8. Comparison of Various Methods in terms of Accuracy (Yahoo Finance Weekly Dataset)
89.51 78.49
61.18
55.76 56.81 55.59 55.76 49.3
0 10 20 30 40 50 60 70 80 90 100
SSO-T SSO ACO XGBoost OlexGA MLP RBFN RF
Classifier FPR FNR Sens. Spec. Accu. F-score Y ρ+ ρ- DP G-measure MCC FDR FOR Kappa
SSO-T 23.49 2.84 97.15 76.50 82.83 77.61 73.66 26.90 4.13 3.76 79.23 0.68 35.38 1.61 64.58 SSO 39.09 24.13 75.86 60.90 63.73 44.22 36.76 2.52 1.94 1.141 48.65 0.28 68.79 8.47 23.74 ACO 45.51 49.50 50.49 54.48 54.04 19.36 4.98 1.10 1.10 0.06 24.59 0.031 88.02 10.02 2.06 XGBoost 44.67 52.32 47.67 55.32 51.79 47.71 3.00 1.05 1.06 -0.02 47.71 0.03 52.24 44.75 3.00
OlexGA 46.06 - - 53.93 53.94 0 - - - 100 0 0
MLP 45.99 53.63 46.36 54.00 52.66 25.48 0.36 1.006 8
1.007
9 -0.08 28.54 0.0028 82.42 17.36 0.221 RBFN 46.12 36.89 43.10 53.87 53.64 3.76 -3.02 0.94 0.93 -0.18 9.21 -0.0087 98.02 2.22 -0.269 RF 44.55 51.91 48.08 55.44 52.30 46.23 3.52 1.06 1.07 -0.006 46.26 0.035 55.47 41.04 3.49
Table 7. Confusion matrix for the Yahoo Finance _2007 _2017_Weekly dataset
Experts
SSO-T SSO ACO XGBoost OlexGA MLP RBF RF
↑ ↓ ↑ ↓ ↑ ↓ ↑ ↓ ↑ ↓ ↑ ↓ ↑ ↓ ↑ ↓
↑ 223 24 187 60 116 131 103 144 0 247 24 223 18 229 92 155
[image:8.595.306.554.537.667.2]576 Published By: Blue Eyes Intelligence Engineering & Sciences Publication
[image:9.595.33.562.69.259.2]Retrieval NumberK15760981119/2019©BEIESP DOI: 10.35940/ijitee.K1576.0881119
Table 8 Comparison of proposed method with existing methods for YahooFinance_2007_2017_Weekly Dataset
D. Yahoo Finance_2007_2017_Monthly Dataset The confusion matrix and the classification results obtained from them are given in Table 9 and Table 10. From the total of 133 instances in Yahoo Finance Monthly dataset, 38 instances are correctly classified to increased stock prices whereas the SSO, ACO, MLP and RF classifiers properly identifies 34, 30, 21 and 17 instances respectively.
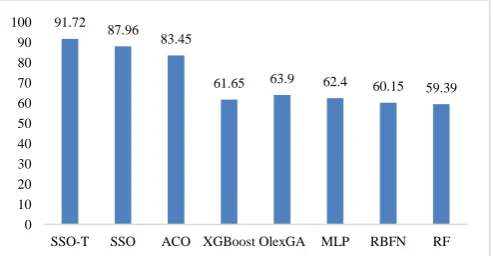
Table 7 shows the attained classification results of various methods under several performance metrics for yahoo finance monthly dataset in the year 2007 to 2017. Similar to weekly dataset, the table shows that the SSO-T algorithm is found to be the best classifier than the compared methods. From the table and Fig. 9, it is clear that the highest level of accuracy 91.72is achieved by SSO-T which is higher than the SSO and ACO algorithms. Though Olex-GA attains an accuracy of 91.72, it fails to achieve better results than SSO-T, SSO and ACO algorithms. Similarly, the F-score value of the SSO and SSO-T algorithms are found to be high compared to the compared classifiers. The ACO algorithm obtains an F-score value of 73.17 which is higher than the compared methods except SSO and SSO-T algorithms. Based on sensitivity and specificity, the SSO-T algorithm obtains maximum values of 97.43 and 89.36 respectively whereas the SSO algorithm achieves slightly lower values of 94.44and 85.56respectively. And, the RBF attains a lowest sensitivity and specificity values of 27.27 and 63.11 respectively. In line with, the XGBoost, MLP and RF classifiers showed competitive performance and it fails to outperform ACO, SSO and SSO-T algorithms. Since the kappa value closer to 100 implies better classification performance where the SSO-T algorithm attains a maximum kappa value of 91.30. At the same time, it can also be seen that the XGBoost and RBF classifiers achieved worst
classification with the negative kappa values of 2.108 and -3.799 respectively.
[image:9.595.306.553.534.662.2]From the above tables and graphs, it is evident the SSO and SSO-T algorithms outperforms the compared methods in a significant way. Additionally, the results depicts that the classification results of the SSO algorithm are highly improved by the process of SSO-T algorithm. In line with SSO-T classifier, the SSO classifier is also an effective approach compared to the other classifiers. Specifically, the use of SSO-T classifier shows the superiority with easier training process. Finally, it is concluded that the SSO-T algorithm is an effective classifier and is verified on SPP model over the state of art methods.
Fig. 9. Comparison of Various Methods in terms of Accuracy (Yahoo Finance Monthly Dataset)
Table 10 Comparison of proposed method with existing
91.72 87.96
83.45
61.65 63.9 62.4 60.15 59.39
0 10 20 30 40 50 60 70 80 90 100
SSO-T SSO ACO XGBoost OlexGA MLP RBFN RF
Classifier FPR FNR Sens. Spec. Accu. F-score Y ρ+ ρ- DP G-measure MCC FDR FOR Kappa
SSO-T 7.66 13.9 86.1 92.3 89.5 88.14 78.43 6.64 11.2 2.04 88.16 0.78 9.71 11.1 78.7 SSO 18.6 25.2 74.8 81.4 78.5 75.25 56.16 3.22 4.01 1.24 75.25 0.56 24.3 19.4 56.2 ACO 35.9 43.9 56.0 64.1 61.2 51.10 20.14 1.45 1.56 0.34 51.30 0.19 53.0 28 19.3
XGBoost 40 51.4 48.6 60 55.8 44.88 8.58 1.17 1.22 0.05 45.01 0.08 58.3 33.6 8.30
OlexGA 43.2 - - 56.8 56.8 0 - - - 100 - 0
MLP 43.1 56.4 43.6 56.9 55.6 15.89 0.50 1.00 1.01
-0.136 20.59 0.003 90.3 9.53 0.19 RBFN 43.2 57.1 42.9 56.8 55.8 12.45 -0.35 0.99 0.99 -0.16 17.67 -0.002 92.7 7.38 -0.11
RF 44.9
2 59.4
7 40.5
2 55.0
7 49.3
0 38.81 -4.39 0.92
6 0.90
21 -0.26 38.85 -0.043 62.8 41.5 -4.33
Table 9. Confusion matrix for the Yahoo Finance _2007 _2017 _Monthly dataset
Experts
SSO-T SSO ACO XGBoost OlexGA MLP RBF RF
↑ ↓ ↑ ↓ ↑ ↓ ↑ ↓ ↑ ↓ ↑ ↓ ↑ ↓ ↑ ↓
↑ 38 10 34 14 30 18 2 46 0 48 21 27 3 45 17 31
Social Spider Optimization with Tumbling Effect Based Data Classification Model for Stock Price Prediction
methods for YahooFinance_2007_2017_Monthly Dataset
CONCLUSION
To enhance the exploration process of SSO algorithm, it is modified by the inclusion of tumbling effect, called SSO-T algorithm. The proposed SSO and SSO-T algorithms are validated using a set of four dataset such as DJI dataset, three own dataset gathered from Yahoo finance on the basis of daily, weekly and yearly. The empirical result states that the proposed algorithms perform well and it is noted that the classification performance of the SSO algorithm is increased by the inclusion of tumbling effect. In future, the proposed SSO-T algorithm can be employed to various real time classification processes.
REFERENCES
1. Qi, Yanjun, Ziv Bar‐Joseph, and Judith Klein‐Seetharaman.
"Evaluation of different biological data and computational
classification methods for use in protein interaction
prediction." Proteins: Structure, Function, and Bioinformatics 63.3
(2006): 490-500.
2. S Tu, My Chau, Dongil Shin, and Dongkyoo Shin. "A comparative
study of medical data classification methods based on decision tree
and bagging algorithms." 2009 Eighth IEEE International Conference
on Dependable, Autonomic and Secure Computing. IEEE, 2009.
3. S Schmidtler, Mauritius AR, and Roland Borrey. "Data classification
methods using machine learning techniques." U.S. Patent No. 7,937,345. 3 May 2011.
4. Gholamiangonabadi, Davoud, et al. "Investigating the performance of technical indicators in electrical industry in Tehran's Stock Exchange using hybrid methods of SRA, PCA and Neural Networks." Thermal Power Plants (CTPP), 2014 5th Conference on. IEEE, 2014. 5. Leung, Mark T., Hazem Daouk, and An-Sing Chen. "Forecasting
stock indices: a comparison of classification and level estimation models." International Journal of Forecasting16.2 (2000): 173-190. 6. Mostafa, Mohamed M. "Forecasting stock exchange movements using
neural networks: Empirical evidence from Kuwait." Expert Systems with Applications 37.9 (2010): 6302-6309.
7. Guresen, Erkam, Gulgun Kayakutlu, and Tugrul U. Daim. "Using artificial neural network models in stock market index prediction." Expert Systems with Applications 38.8 (2011): 10389-10397. 8. Lee, Tian-Shyug, and Chih-Chou Chiu. "Neural network forecasting
of an opening cash price index." International Journal of Systems Science 33.3 (2002): 229-237.
9. Khan, Md Ashraful Islam. "Financial volatility forecasting by nonlinear support vector machine heterogeneous autoregressive model: evidence from Nikkei 225 stock index." International Journal of Economics and Finance 3.4 (2011): 138.
10. Tay, Francis EH, and Lijuan Cao. "Application of support vector machines in financial time series forecasting." Omega29.4 (2001): 309-317.
11. Deboeck, Guido. Trading on the edge: neural, genetic, and fuzzy systems for chaotic financial markets. Vol. 39. John Wiley & Sons, 1994
12. Graham, B., 1949. Intelligent Investor. s.l.:Harper.
13. Barsky, R. B. & De Long, J. B., 1992. Why does the stock market fluctuate?, s.l.: National Bureau of Economic Research
14. Hendershott, Terrence, and Pamela C. Moulton. "Automation, speed, and stock market quality: The NYSE's hybrid." Journal of Financial Markets 14.4 (2011): 568-604.
15. Cuevas, E., Cienfuegos, M., Zaldívar, D. and Pérez-Cisneros, M., 2013. A swarm optimization algorithm inspired in the behavior of the social-spider. Expert Systems with Applications, 40(16), pp.6374-6384.
16. James, J.Q. and Li, V.O., 2015. A social spider algorithm for global optimization. Applied Soft Computing, 30, pp.614-627.
17. Cuevas, E., Cortés, M.A.D. and Navarro, D.A.O., 2016. Social-Spider Algorithm for Constrained Optimization. In Advances of Evolutionary Computation: Methods and Operators (pp. 175-202). Springer International Publishing.
18. Tawhid, M.A. and Ali, A.F., 2016. A simplex social spider algorithm for solving integer programming and minimax problems. Memetic Computing, 8(3), pp.169-188.
19. Nguyen, P.H., Wang, D. and Truong, T.K., 2017. A Novel Binary Social Spider Algorithm For 0-1 Knapsack Problem. International Journal of Innovative Computing Information and Control, 13(6), pp.2039-2049.
20. James, J.Q. and Li, V.O., 2016. A social spider algorithm for solving the non-convex economic load dispatch problem. Neurocomputing, 171, pp.955-965.
21. Klein, C.E., Segundo, E.H., Mariani, V.C. and Coelho, L.D.S., 2016. Modified social-spider optimization algorithm applied to electromagnetic optimization. IEEE Transactions on Magnetics, 52(3), pp.1-4.
22. Tawhid, M.A. and Ali, A.F., 2017. A hybrid social spider optimization and genetic algorithm for minimizing molecular potential energy function. Soft Computing, 21(21), pp.6499-6514. 23. Chandran, T.R., Reddy, A.V. and Janet, B., 2016, February. A social
spider optimization approach for clustering text documents. In Advances in Electrical, Electronics, Information, Communication and Bio-Informatics (AEEICB), 2016 2nd International Conference on (pp. 22-26). IEEE.
24. Zhou, Y., Zhou, Y., Luo, Q. and Abdel-Basset, M., 2017. A simplex method-based social spider optimization algorithm for clustering analysis. Engineering Applications of Artificial Intelligence, 64, pp.67-82.
25. Maurya, L., Mahapatra, P.K. and Kumar, A., 2017. A social spider optimized image fusion approach for contrast enhancement and brightness preservation. Applied Soft Computing, 52, pp.575-592. 26. Agarwal, P., Singh, R., Kumar, S. and Bhattacharya, M., 2016. Social
spider algorithm employed multi-level thresholding segmentation approach. In Proceedings of First International Conference on Information and Communication Technology for Intelligent Systems: Volume 2 (pp. 249-259). Springer International Publishing.
27. Lubin, T. B. (2007). The evolution of sociality in spiders. In H. J. Brockmann (Ed.), Advances in the study of behavior (Vol. 37, pp. 83– 145).
28. Aviles, L. (1986). Sex-ratio bias and possible group selection in the social spider Anelosimus eximius. The American Naturalist, 128(1), 1–12.
Classifier FPR FNR Sens. Spec. Accu. F-score Y ρ+ ρ- DP G-measure MCC FDR FOR Kappa
SSO-T 10.6 2.56 97.4 89.4 91.7 87.35 86.79 34.9 9.15 3.96 87.82 0.82 20.8 1.17 81.30
SSO 14.4 5.55 94.4 85.6 87.9 80.95 80.01 15.4 6.54 3.06 81.79 0.74 29.2 2.35 72.42
ACO 18.2 11.7 88.2 81.8 83.5 73.17 70.05 6.95 4.85 2.17 74.26 0.63 37.5 4.70 61.71
XGBoost 36.5 71.4 28.6 63.5 61.7 7.27 -7.93 0.89 0.78 -0.57 10.91 -0.037 95.8 5.88 -2.11
OlexGA 36.1 - - 63.9 63.9 0 - - - 100 0 0
MLP 30.3 52.3 47.7 63.7 62.4 45.65 17.39 1.33 1.57 0.10 45.69 0.17 56.3 27.1 16.99
RBFN 36.9 72.7 27.3 63.1 60.2 10.16 -9.61 0.86 0.73 -0.61 13.05 -0.055 93.8 9.41 -3.79
578 Published By: Blue Eyes Intelligence Engineering & Sciences Publication
Retrieval NumberK15760981119/2019©BEIESP DOI: 10.35940/ijitee.K1576.0881119
29. Burgess, J. W. (1982). Social spacing strategies in spiders. In P. N. Rovner (Ed.), Spider communication: Mechanisms and ecological significance (pp. 317–351). Princeton, NJ: Princeton University Press. 30. Maxence, S. (2010). Social organization of the colonial spider Leucauge sp. in the Neotropics: Vertical stratification within colonies. The Journal of Arachnology, 38, 446–451.
31. Avilés, L. (1997). Causes and consequences of cooperation and permanent-sociality in spiders. In B. C. Choe (Ed.), The evolution of social behavior in insects and arachnids (pp. 476–498). Cambridge, MA: Cambridge University Press.
32. Rayor, E. C. (2011). Do social spiders cooperate in predator defense and foraging without a web? Behavioral Ecology & Sociobiology, 65(10), 1935–1945.
33. Gove, R., Hayworth, M., Chhetri, M., & Rueppell, O. (2009). Division of labour and social insect colony performance in relation to task and mating number under two alternative response threshold models. Insectes Sociaux, 56(3), 19–331
34. Jones, T., & Riechert, S. (2008). Patterns of reproductive success associated with social structure and microclimate in a spider system. Animal Behaviour, 76(6), 2011–2019.
35. Damian, O., Andrade, M., & Kasumovic, M. (2011). Dynamic population structure and the evolution of spider mating systems. Advances in Insect Physiology, 41, 65–114
36. https://archive.ics.uci.edu/ml/datasets/dow+jones+index