International Journal of Innovative Technology and Exploring Engineering (IJITEE) ISSN: 2278-3075, Volume-8 Issue-9, July 2019
Abstract: As of late, expectation of cancer at prior stages is mandatory to increase the opportunity of survival of the harassed. The most appalling sort is lung cancer, which is most common malady these days. So to dispose of it a detection framework is proposed. The objective of this paper is to investigate a practical segmentation algorithm with optimization system for therapeutic images to abridge the doctors' understanding of CT images. Recent medicinal imaging modalities produce enormous images that are incredibly terrible to examine physically. The outcomes of segmentation algorithm depend on the exactitude and intermingling time. In this paper, a qualitative detection model is proposed to partition the CT images of lung cancer. The detection framework shaped the obtained therapeutic images of lung CT images. To begin with, in pre-processing stage the median filter is utilized for noise reduction and smoothing. Later Otsu’s segmentation is applied to separate locale of enthusiasm from lung cancer images along with particle swarm optimization to get more accuracy and also for feature extraction LBP is connected. Here, the proposed model is framed by utilizing SVM technique for classification. Using MATLAB, simulation results are obtained for cancer detection system and these results are compared with other optimization techniques.
Index Terms: Modalities, Framework, Detection, SVM, LBP and Otsu’s.
I. INTRODUCTION
Cancer identifies with abnormal cell development anyplace in the body, having a tendency to multiply in an uncontrolled way [1]. Numerous cancers and the irregular cells that make up it are additionally perceived by the tissue name that the strange cells start from pulmonary cancer, breast cancer, prostate cancer, colon cancer and so forth. Lung cancer is the world's leading reason for death [2]. A CT thorax scan is commonly the most delicate approach to detect lung lesions and encompassing structures. A CT scan is an effortless, non-intrusive imaging technique that makes accurate numerous pictures (cuts) of body structures, similar to the lungs [3]. Various artifacts can reconfigure the cross-sectional pictures which are produced during a CT scan. The National Lung Screening Study (NLST) exhibited a relative hazard reduction of 20% in lung cancer-explicit mortality and 6.7% taking all things together reason mortality utilizing low-portion CT screening [4]. A lung lesion is a round nodule of under 3 cm in width. It could be either benign (non-cancerous) or malignant (cancerous) and could be
Revised Manuscript Received on July 06, 2019.
C Venkatesh, Research Scholar, Department of Electronics and Communication Engineering, Koneru Lakshmaiah Education Foundation, Vaddeswaram, Guntur, Andhra Pradesh, India.
Polaiah Bojja, Professor, Department of Electronics and Communication Engineering, Koneru Lakshmaiah Education Foundation,
detected in 1 out of each 100 chest scans. In a CT scan, lung cancer is distinguished as round white nodule sores, accordingly it is noteworthy for screening and demonstrative contemplations to detect and group those lesions. The likelihood of annodule getting to be cancerous is about 40%, however the hazard changes extraordinarily relying upon a few contemplations. For example, in individuals under 35 years old, the likelihood of a lung sore getting to be cancerous is under 1%, while in individuals over half of the lung knobs are threatening (cancerous) [5]. The radiologists ought to dependably contrast the present CT scan and the past ones when a lesion is detected on a CT scan. In the event that the size, shape or presence of the nodule on prior CT scans has not transformed, it is likely not cancerous. In the event that a lung nodule is new or has changed in size, shape or appearance, at that point it is exhorted that a bronchoscopy or tissue biopsy decides whether it is cancerous. Because of the high number of scans which are regularly overseen and broke down, the possibility of accurate evaluation from CT scans requires a ton of exertion from the pros. The appraisal turns out to be increasingly convoluted when the movement of the illness isn't yet outwardly significant (early stage)[6]. The strategy for examining a CT scan to detect lung knobs takes around 15 to 20 minutes for the radiologist. The radiologist for the most part assesses at any rate 45 pictures around the same time, and this could be an exhausting technique. Distinct restorative outcomes would thus be able to be gotten for a similar scan by various specialists. In this paper, the work is focused on creating modern enhancement based lung cancer detection procedure that would be valuable in helping radiologists as a subsequent feeling to characterize lung lesions and decrease the time of the CT scan appraisal. For the radiologist, lung nodules are regularly accidentally perceived in a CT scan since they are not wide enough to see it effectively. The nodules were depicted in this paper by computing the boundary highlights acquired from the Local binary Pattern (LBP) by utilizing a spiral based SVM to order CT pictures into two classifications: cancerous aspiratory lesions and lung lesions.
II. LITERATUREREVIEW
K.Senthil Kumar et al.[7 ] in 2019 suggested a lung cancer identification system using GCPSO . Multiple optimization techniques are also used in this work for identification of cancer in CT images. By this method 95 percent precision is acquired. Preethijoon et al.[8 ] in 2019 suggested a pulmonary
cancer detection
arrangement using fuzzy c — mean and k-mean clustering
Development of Qualitative Model for Detection
of Lung Cancer using Optimization
methodologies together with SVM classifier . C.Venkatesh et al.[9 ] in 2019 suggested a genetic algorithm-based detection scheme along with SVM and LBP. By this method 90 percent proficiency is acquired.
S.Perumalet.al[10 ]. in 2018, a cancer detection and classification scheme was suggested by Enhanced ABC optimization. By using this method, 92 percent proficiency (in terms of TPR) is achieved. The accuracy is less in all of the above current (existing) techniques. So a diverse approach is proposed in this paper where PSO has been used for segmentation together with SVM classifier and LBP for feature extraction to get greater accuracy.
III. METHODOLOGY
The identification and classification of lung nodule or lung cancer by image processing is not an easy task. Various levels are implicated to achieve final result. Figure 1 shows the block diagram and processing stage to gain the desired outcome. In the early stage of the work, the lung CT images has been collected and the pre-processing is experienced on it, and composed and set up this image for soft processing of next algorithmic steps in the proposed methodology is as shown in Fig 1.In the image segmentation stage, the pre-processed image has been labelled the pixels of image and reclaim as per the prerequisite. The local binary pattern algorithm has been extracted the features the segmented image to forecast the statistical, texture and shape features. The segmented and extracted lung CT has been classified by SVM and determined the accuracy of proposed algorithm. The complete details of the above mentioned steps have been presented in the subsequent sections.
Image Acquisition
The lung CT images has attained from public data base and private hospitals and real patient images.
Preprocessing
In the pre-processing, initiallythe CT lung image has been resized into 256x256 and 512x512pixels that makes all the images are of identical dimensions. Next, the image is transformed into a gray scale to eliminate the intricacy of an RGB image as a standard RGB image has many channels; it is also easier to achieve the gray scale image features.The noise can mask and blur the significant features of medical images and becomes problematic in processing of advanced steps in image analysis. The main objective of pre-processing is to enhance the picture quality by eliminating the noise and removing the unintended parts in the backdrop and making them more reliable. Median filter is a non-linear filtering method that eliminates high-frequency elements in lung CT pictures without maintaining the edges [11].
Fig.1 Flowchart of Proposed Methodology
Image segmentation using PSO
PSO is a sprawling image segmentation boundary technique. The PSO is often used to locate the threshold with all its fitness function by getting the values to have a appropriate destination image location and that is for optima to renew the generations after placing the set of random particles[12]. It is a scheduling method which can maximize a argument based on incremental process and transfer the designated particles into the search space to measure the quality [13]. It can alleviate the issue through a candidate solution with only a basic mathematical function through the location and velocity of particles. This is a meta-heuristic approach and then it holds a few expectations regarding the current issue to improve and analyze candidate solutions of major areas. Basically all particles experience the motion in search space with its highest local position and shift towards to the better known places. If any other particles ascertained the best location, the flock migrates towards the best solution [14]. In this job, the PSO algorithm is interpreted for segmentation in order to achieve sub-images of the required target. It is a inter-agent equidistant exploration process that retains a set of components and each object defines a likely option in the group. In this development process all the components travel through some kind of single-dimensional computational space in which each object
adapts its position. Let
International Journal of Innovative Technology and Exploring Engineering (IJITEE) ISSN: 2278-3075, Volume-8 Issue-9, July 2019
position and velocity vectors respectively at moment t in search space and then renew every object location by equation 1.
= + --- (1)
As a result, in PSO the whole particles start randomly and calculated together with perseverance of personal best (Pbest) and global best (gbest) to estimate the fitness value. The personal best reflects each particle's best value as well as the global best represent the best particle value in the hive.
Feature Extraction
Local Binary Pattern: After obtaining lung nodule from the preprocessing and segmentation steps, the LBP operator is applied on lung data set and nodule templates. Ojala et al.[15] first initiated the LBP inspector for the categorization of rotation scalar texture. Due to its prejudicial strength and mathematical elegance, the LBP is really a appropriate texture descriptor.The LBP function is computed on each pixel by evaluating the binary variations of the results of a small circular area (with radius R) across the location of a central pixel, considering the image I of size n / m m gray scale pixels and they indicate with I(g) gray level of the gth pixel of picture I. Mathematically specifies the present pixel LBP value:
1 , 02
P nP R n c
n
LBP
s g
g
1
0
( )
0
0
t
s t
t
(2 )Where gc is the gray value of the center pixel, gp is the gray values of the spatially structured neighbourhood gp(p=0,.,P-1), P is the picture pixels in the range of R(R>0) creating a spatially structured neighbourhood set respectively 2P: binomial factor for each sign s(gp-gc). After finding each pixel's LBP code in the image, a histogram is generated to represent the texture image.
Classification using SVM
SVM is the most accurate method of supervised learning and classification of patterns, as ascertained by Vapnik & Cortes. The support vector machine (SVM) classification system used in this work is it to identify a pulmonary CT lesion as benign or malignant. SVM is a binary classifier, takes input information set and classifies them into one of the two separate classes[16].SVM's strengths lie in its potential to translate the information into a large-dimensional space in which information could be segregated utilizing hyper plane and distinguish two classes by increasing the range or gap among two classes. SVM has the unique feature of concurrently mitigating sorting errors and enhancing the linear difference by categorizing both linear and non-linear data types.
IV. PERFORMANCEPARAMETERS
The proposed methodology has been determined the parameters of the resistance of an image towards noise signals. These can be determine using the following two equations (3 ) and ( 4).
Mean Square Error:
2
1
MSE
f i j
( , )
f
R( , )
i j
P Q
(3)Peak Signal to Noise Ratio:
10
PSNR
20 log
MAX
IMSE
(4)The efficiency of the implemented method can be estimated in terms of precision, awareness and specificity. Confusion matrix includes data on real and expected categories. The confusion matrix describing the terms like True Positive (TP), False Positive (FP), True Negative (TN) and False Negative (FN) from the calculations of anticipated outcome and ground truth outcome.
Sensitivity TP
TP FN
(5)
Specificity TN
TN FP
(6)
Accuracy TP TN
TP TN FP FN
(7)
V. RESULTSANDDISCUSSION
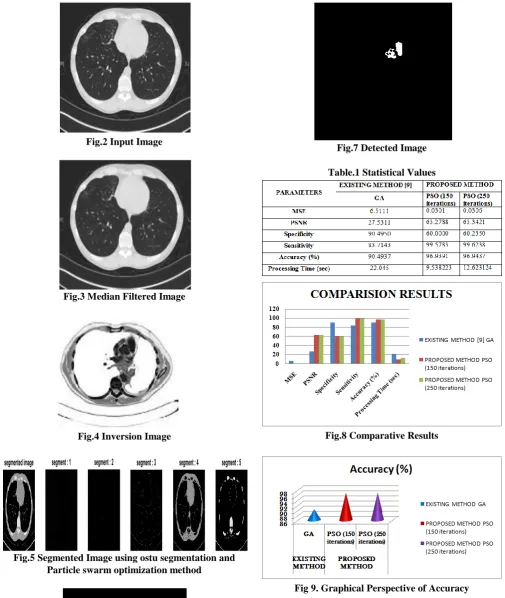
Fig.2 Input Image
Fig.3 Median Filtered Image
Fig.4 Inversion Image
Fig.5 Segmented Image using ostu segmentation and Particle swarm optimization method
Fig.6 Feature Extracted Image
Fig.7 Detected Image
[image:4.595.359.501.51.190.2]Table.1 Statistical Values
[image:4.595.302.548.217.632.2]Fig.8 Comparative Results
Fig 9. Graphical Perspective of Accuracy
[image:4.595.106.232.639.769.2]International Journal of Innovative Technology and Exploring Engineering (IJITEE) ISSN: 2278-3075, Volume-8 Issue-9, July 2019
VI. CONCLUSION
In this work, sighting sighting of lung cancer on CT scan images is performed with the guide of image processing techniques along with optimization technique (PSO) which improves the excellence of the input lung images for prior identification of disease. At the same time, time taken for the entire procedure is likewise significantly less. The deformity of the lung nodules or tissues is effectively decided as target images with Otsu segmentation. The accuracy is the significant issues of this exploration the proposed technique yields more promising results in terms of accuracy, MSE compared to other existing methodologies.
REFERENCES
1. Jinsa kuruvilla and K Gunavathi, “Lung cancer classification using neural networks”, Computer methods and programs in medicines, Vol. 113, 2014, pp.202-209.
2. Cancer statistics, 2019.Siegel RL1, Miller KD2, Jemal A3. CA Cancer J Clin. 2019
Jan;69(1):7-4.doi:10.3322/caac.21551.Epub2019Jan8.(https://www.nc bi.nlm.nih.gov/ pubmed/30620402)
3. Indian J Radiol Imaging. 2015 Apr-Jun; 25(2): 109–120. doi: 10.4103/0971-3026.155831 Imaging of lung cancer: Implications on staging and management Nilendu C Purandare and Venkatesh Rangarajan
4. Rasmussen J, Siersma V, Pedersen J, Heleno B, Saghir Z, Brodersen J. Healthcare costs in the Danish randomised controlled lung cancer CT-screening trial: a registry study. Lung Cancer. 2014;83:347–55. 5. Farag A, El Munim H, Graham J, Farag A. A novel approach for lung
nodules segmentation in chest CT using levelsets. IEEE T Image Process. 2013;22:5202–13.
6. Choi W, Choi T. Automated pulmonary nodule detection based on three-dimensional shape-based feature descriptor.Comput Meth Prog Bio. 2014;113:37–54.
7. K. Senthil Kumar , K. Venkatalakshmi , K. Karthikeyan, “Lung Cancer Detection Using Image Segmentation by means of Various Evolutionary Algorithms”Hindawi, Computational and Mathematical Methods in Medicine, Research article , 2019,Pg.No:1-16 Article ID 4909846. 8. PreetiJoon, ShaliniBhaskar Bajaj and AmanJatain, “Segmentation and
Detection of Lung Cancer Using Image Processing and Clustering Techniques” Springer Nature Singapore, Progress in Advanced Computing and Intelligent Engineering, Advances in Intelligent Systems and Computing , Volume No:1, 2019, Pg.No:13-23. 9. C.Venkatesh, Polaiah Bojja, “A Novel Approach for Lung Lesion
Segmentation Using Optimization Technique”, Helix the scientific explorer , Volume:9, Issue No: 1, 2019,Pg. 4832-4837,E-ISSN: 2319-5592, DOI 10.29042/2019-4832-4837.
10. S. Perumal , T. Velmurugan, “Lung cancer detection and classification on CT CT scan images using enhanced artificial bee colony optimization”International Journal of Engineering & Technology, Volume No:7, Issue No:2.26, 2018, Pg. No.: 74-79.
11. C.Venkatesh, Polaiah Bojja, “An Exploration of Optimization Techniques for Detection of Lung Cancer in CT Images”, International Journal of Pure and Applied Mathematics , Volume 117 Issue No 18, 2017,Pg. 379-384.
12. Kun-Huang Chen et.al, “Gene selection for cancer identification: a decision tree model empowered by particle swarm optimization algorithm” BMC Bioinformatics, volume 15,Issuue No 49, 2014,Pg.2-10
13. Dilpreet Kaur, Yadwinder Kaur“Intelligent Medical Image Segmentation U e and Information Technologies, Volume 5,Issue No 5, 2014, Pg.6089-6093sing FCM, GA and PSO”, International Journal of Computer Scienc
14. C.Venkatesh, Polaiah Bojja, “An Exploration of Optimization Techniques for Detection of Lung Cancer in CT Images”, International Journal of Pure and Applied Mathematics , Volume 117 Issue No 18, 2017,Pg. 379-384
15. T. Ojala, M. Pietik¨ainen and D. Harwood, “A comparative study of texture measures with classification based on feature distributions” Pattern Recognition vol. 29, 1996.
16. C.Venkatesh,K.Bhagyalakshmi,L.Sivayamini, “Detection of Diverse Tumefactions in Medial images by Various Cumulation Methods”