Automated Guava Classification Technique using
Artificial Neural Network and Artificial Ant Colony
Raed Qaqish ORCID: 0000-0003-2317-6183
Ra’Ed QaQish,
Amani Al-alaya, Duha AdnanAbstract- Guava is one of the main agricultural products in the northern part of Jordan. The classification of fruit products is an essential part in the packaging, shipment, and marketing processes. Normally, the classification and grading of fruits are performed manually, which incur additional overheads in the harvesting and marketing procedures. This adds to the final pricing of fruits and vegetables. The automatic classification and grading of fruits and vegetables can save substantial costs and efforts in addition to avoiding long delays. In this work, we propose an automatic classification system for grading and classifying guava fruits using image-processing techniques. The proposed research will provide a rich analysis and investigation of several features of the problem at hand. Our study will convey and integrate shape, color, and texture descriptors. During the preprocessing step, many morphological operations will be applied accompanied with filtering using various filters like the Wiener Filter. In the classification phase of the proposed system, at least two classification approaches will be considered including the artificial ant colony algorithm and the minimum distance classifier. Moreover, in the experimental part we will collect a large number of input samples (images) with different projections.
I. INTRODUCTION
One of the hot themes within the academic field of research is fruit categorization, which is required to provide people with appropriate dietary guidance. This guidance can help to choose the appropriate food kinds to investigate their nutrient and health requirements (Pennington and Fisher, 2009). Furthermore, fruit categorization techniques have been adopted in many food factories to package their products automatically. Where, the sub- categorization and categorization of fruit is varied from one area to another. This variation appears because the categorization process does not only focus on the essential components in fruit, but on people dependence and fruit availability (Wang and others, 2015). The manual fruit categorization remains a hard mission, thus the automatic categorization of fruit depending on computer vision and machine learning has been adopted to overcome the problems of manual methods.Guava is considered as one of the main popular subtropical and tropical fruits, which are categorized into various varieties relaying on firmness, shape, size and color (Pradeep and others, 2014). The good shape of fruit can be determined by the absence of defect and the identical distribution of color on the fruit surface.
Revised Manuscript Received on July 10, 2019.
Ra’Ed QaQish, Assistant and Associate Professor of Architecture and Design.Educated in the United States and the United Kingdom,
Amani Al-alaya, holds a Bachelor of computer engineering and a Master degree of Embedded system engineering and has been working in educational services since 2009.
B. Duha Khalil, holds a Bachelor of highway and bridge engineering and a Master of Transportation engineering and has been working in educational services since 2011.
The quality of fruit has been detected by automated inspection, which is based on extracting the texture and color features from the fruit sample images to determine those which are defected and which are healthy (Khoje and Bodhe, 2013).
The “Computer Vision Systems (CVSs)” application has many advantages that have increased popularity in the field of agriculture. This application offers beneficial information in real time, guarantees quality standards in maintenance, and offers essential information that relates to produce natural attributes and minimizes costs. The technology of computer vision involves; analyzing, processing and capturing images in order to make the nondestructive and objective appreciation of visual attributes of food and agricultural products very easy. The analysis of image within this technology involves the following techniques;
Image acquisition
Pre-processing of image
Image interpretation
Image classification and quantification
This technology uses geometric characteristics, which involve; texture, size and shape in addition to the chromatic characteristics that involves color to represent the overall appearance of fruit. Furthermore, it involves the defects, which reduce the external fruit quality to represent the appearance. The produces value has been recently increased by using the automated gradation of fruit.
Guava fruit has been studied in this work, where this fruit type has various quality levels. The farmers in Jordan use their experience to sort this type of fruits, but this type of sorting demands large number of labor, time and effort. Therefore, these factors will affect sorting quality and fruit price. To solve these problems, this work aims to use the automate classification by developing an appropriate algorithm to increase the classification accuracy and minimize the required effort. Using this algorithm, Guava fruits have been categorized into four classes:
Excellent
Good
Fair
Defected
These four classes are based on the quality of fruit through the imagery that have been prepared and enhanced using Weiner Filter. Furthermore, the algorithm of “Artificial Ant Colony (AAC)” has been used to classify the images of the fruit. The aim of using these techniques is to minimize time and improve the accuracy and the performance of the classification process. The classification process has been applied and has been
ORCID: 0000-0003-2317-6183 Within this work, a large sample of Guava fruit images has
been gathered from the field. These collected images have been divided into two main sets; testing and training set. Based on testing data of this framework, many feature vectors have been determined and identified; these vectors are:
Vectors of Shape feature
This type of vectors involves different shape characteristics of Guava fruit like:
- Area
- Centroid
- Perimeter
- Circularity
- Mean radial distance
- Standard deviation for radial distance
- Extreme points
- Length of extreme axis
- Column moments, mixed moments and row
moments with second order.
- Ellipse axis orientations and lengths.
Vectors of color feature
These vectors involve different color features of Guava fruit like:
- Intensity
- Saturation
- Color histograms
- Hue
Vectors of texture feature
These vectors involve different texture features of Guava fruit like:
- Texture energy
- Co-occurrence matrices
- Local-binary partitioning
Furthermore, different types of images have been used within this suggested system involving:
Binary images
Gray-scale images
Colored images
Thus, this work has the ability to integrate and combine all types of images and this will make the decision of classification more accurate. However, the previous studies applied only one type of images.
Beside this section, some related works will be reviewed and discussed in the second section. The proposed algorithm will be explained in the third section. The fourth section will show the obtained results after implementing the proposed method and doing the experiments, which are discussed also in the same section. Last but not least, the fifth section will conclude the entire work.
II. LITERATURE REVIEW
During the past years, a large number of agricultural images had been analyzed using different image analysis methods of which vegetables and fruits images were the most analyzed images. The purpose of this analysis was to categorize and recognize these agricultural images (Seng and Mirisaee, 2008).
Previously, different types of fruit were sorted manually, this process demanded huge effort and large amount of time.
However, in time, the sorting and categorization techniques has developed further. The technique of image processing was one of these developed techniques; it categorized the fruits
automatically depending on fruit image attributes (Pratap and others, 2014).
In addition, the technologies of image processing had been applied within many studies. Some of these studies were aimed to evaluate the fruit return, but others were aimed to determine the immature and mature fruits. The performance of these prior studies was based on determining a threshold for use of fruit features (Yamamoto, 2014). Furthermore, several technologies like; ultrasonic (Regunathan and Lee, 2005) imaging, thermal (Wachs and others, 2009) (Stajnko and others, 2004) and hyper-spectral (Safren and others, 2007) (Okamoto and Lee, 2009) technology had been used within many studies to recognize the fruits.
The categorization process of fruit had been developed, where the automatic techniques of classification had been appeared. One of these techniques is computer vision, which achieved a large growth within the agricultural area. This technique had been largely used within the developing and developed countries for automatic grading and sorting of vegetables and fruits (Kshirsagar and Arora, 2014). Another developed technique for fruit grading is machine vision technique. This technique used defection, shape, size and color attributes to grade the fruit (Unay and Gosselin, 2006).
Several techniques will be reviewed in this section, such as Artificial Neural Network (ANN), Support Vector Machine (SVM), Artificial Ant Colony (ANC) and Fuzzy K-Mean (FKM). In order to discuss their results and show the contribution of this proposed method.
Beginning of ANN method, which has many advantages like; ability to deal with noisy data, ease of use, accuracy and strength, this method has many disadvantages as shown from the results that obtained in (Pujari and others, 2013) (Khoshhal and others, 2009) (Maftoonazad and others, 2011). ANN demanded large time of processing, huge training sample and lack of possibility of expansion. Regarding SVM, the results of (Wang and otehrs, 2009), (Suresha and others, 2012) and (Elhariri and others, 2014) studies proved that SVM method has the ability to deal with distorted and from high-dimensional data. In addition, this method outperformed the other traditional methods from the side of accuracy, where it achieved high categorization accuracy. On the other hand, this method has many disadvantages like; consuming large time during the process of learning and demanding large effort to transform the data from the normal form into other advanced form.
The first use of “Ant Colony Optimization (ACO)” was in (Dorigo, 1992), where M. Dorigo
suggested this algorithm to solve the complicated combinatorial issues. This algorithm can be considered as one of swarm intelligence classes. The authors in (Dorigo, 1996) developed the initial algorithm of ant, which was known as “Ant System (AS)”. Within this algorithm, every ant constructs a different solution. On the other hand, many algorithms had been appeared later which represented an enhancement of the first version of AS. “Max-Min Ant System
(MMAS)” (Stutzle and H.
“Elitist Strategy for Ant System (EAS)” (Dorigo, 1992) (Dorigo and others, 1991) (Dorigo and others, 1996) were the most common algorithms.
In (cao and others, 2008), the AAC algorithm had been used to fragment images. The fuzzy interdependence measure had been used to measure the amount of identity between the reference and the demanded objects. Moreover, the ants within this algorithm refreshed their memories every appearing of a novel target, where the adjacent ants are affected with each other. This suggested algorithm achieved high success in performing the fragmentation process. On the other hand, the authors in (Ye and others, 2005) suggested a novel technique to automatically identify the threshold of image during the fragmentation process. This suggested method used the algorithm of ACO. This method had been suggested to overcome the challenges of Ostu algorithm. The number of utilized images within this study was 10. Furthermore, two main terms had been measured within the experiments of this study; time of processing and solution accuracy. The outcomes confirmed that this method outperformed on Ostu algorithm in term of identifying the ideal threshold.
The authors in (Ouadfel and others, 2005) applied the HACSEG ant algorithm, which is a novel algorithm for fragmentation of images. The authors aimed to compare the performance of this algorithm with other algorithms such as; “Ant Colony System- Markov Random Field (ACS-MRF)”, “Generic Algorithm (GA)” and “Simulated Annealing (SA)”. The type of images that used within study was “Magnetic Resonance (MR)”, where images with various values of Inhomogeneities and noise had been selected.
In addition, this algorithm had been applied on two different images with gray level; the first image represent house and the second represent a muscle cell. This algorithm distinguished that others by designating a random partition for each ant, where these designated partitions are regularly adjusted through the heuristic information and trials of pheromone. The obtained outcomes indicated that the performance of this algorithm was better that the performance of the other compared algorithms.
The authors in (Chen and others, 2014) suggested a novel method to fragment the images. The algorithm of “Fuzzy Ant Colony (FAC)” had been used for this purpose. The technique of grey- scale morphologic had been used to perform image pre-processing. Three types of images had been used to perform the fragmentation which were; real, noisy visible and visible images. This suggested algorithm had been compared with AFS and GA algorithms. The interference of noise and the threshold value for search domain had been reduced by this method. Furthermore, the number of population times of search that required within this method is too small as compared with the other algorithms.
The KMC method had been used in (Leemans and Destain, 2009) to categorize and grade the Jonagold type of apples. Cameras with CCD type had been used for image acquisition phase. Furthermore, Belgium and Euresys farm-grabbers had been used to extract the images. C++ had been used to implement the treatment functions of images. The outcomes revealed that percentage of apple fruit that correctly categorized was 73%, while the error percentage was 27%. This correct percentage had been achieved when the size of sample reached to 100 images. However, this
correct percentage had been dropped when the size of sample reduced. In addition, the outcomes of this study confirmed that there were many reasons for the appeared errors such as; inability to categorize some defects, injuries that produced from birds and existence of small defects. The authors in (VaniAshok and Vinod, 2014) used the algorithms of “Fuzzy C-Mean (FCM)” and KMC to categorize the fruit depending on their color attributes. The images of apple fruit had been chosen to apply the study. The captured images had been enhanced through the “Gaussian Low-Pass Filter (GLPF)”. In addition, the images that used within this study represented images of apples that infected by blotch, rot and scab defects. The used images had been categorized into three groups, where the first group showed the non-defective section. However, the second group showed the detective section. Based on the obtained outcomes, both proposed algorithms were correctly categorized the defected fruits. However, the results of KMC algorithm may be incorrect if the number of cluster appreciated in a wrong way.
As shown from the studies above, different types of fruits had been categorized using different techniques. The categorization process was based on different features, where these features were varied from one study to another. The outer and inner features had been used to perform this process. These studies performed the categorization process for different purposes like identifying; size, shape,
defects, quality and maturity degree. On the other hand, the number of images that used as a database had been varied among studies. Large number of studied methods achieved a great success in many terms like; accuracy, operating time, cost and consumed energy.
In addition, many ant colonies techniques had been studied within this chapter, where these techniques had been used in (Liu and others, 2014) (Singh, 2013) studies. These techniques were used edge, noise and background to perform the classification and fragmentation processes. In addition, the number of images that used as sample database was small. Also, different types of images had been used within each study and this made the categorization process more complicated. The studies proved that these techniques overcome on many traditional techniques and provided accurate results.
On the other hand, the AAC technique had been suggested within this study to classify the Guava fruit. The suggested study used the color and texture features to perform the categorization process. In addition, the sample of images was large as compared with the previous studies. In addition, one type of images had been used within this study and this made it more simple and accurate. The performance of this study achieved great success in the accuracy, processing time and error terms. Although the previous studies achieved good results in these terms, but the proposed study outperform on them and achieved the best results. These results will be shown.
III. PROPOSED METHOD
ORCID: 0000-0003-2317-6183 model; image pre-processing and machine learning.
Subsequently, this chapter will explain our experiment and the analytical results that have been harvested. Fruit classification utilizing soft computing has attracted researchers over the years. Various fruits have been
[image:4.595.66.273.120.205.2]classified, such as, apples, oranges, lemons, strawberries and dates. Among these projects, four processing steps are commons. However, the technique details of these steps differ from one project to another. Fig. 1 shows these steps.
Figure 1: Processing Steps
In this work, these steps have been utilized to classify guava fruit into one of four categories; excellent, very good, good and bad. The following sections describe these steps in details:
1.1 Image Acquisitions
More than 1000 guava fruits have been collected. Four different pictures have been taken to these fruits from different angles with different backgrounds. We attempted to make the photos more general. This fact has changed the shapes of the fruits in the photos. This method made photo acquisition simple. However, image pre-processing process became harder.
1.2 Pre-processing
In automated fruit grading systems, image pre- processing techniques are utilized to convert an image into a new image that can be used for feature extraction. Color, shape and texture are the three main properties that have been utilized in these studies. As mentioned, shapes and sizes are variable in our study. This mean they are not important to extract in pre-processing steps. Color and texture on the other hand are the most important property in our photos. In the following sections, we will describe color and texture features.
1.2.1 Color
To study color, two steps have been used to extract features. A- Step one:
To study guava fruits. Image pre-processing steps that have been used are as follows:
1- RBG photos have been processed without
converting them into gray or binary photos.
2- Background color has been eliminated and converted to a black color. To complete this step, we converted our JPG photos into RGB matrices. Subsequently, we worked with the green color since it is degrees are responsible of the green yellow and brown
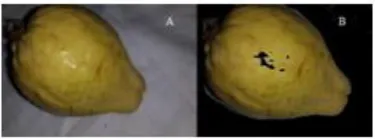
colors. A threshold value has been utilized for the green values. In this way, we extracted the background color. Fig. 2 shows this step.
Figure 2: (A) Shows the image before extracting the background. (B) Shows the image after the extraction
[image:4.595.350.505.214.352.2]3- Colors’ histogram has been calculated for the three matrices R, G and B. After extracting the histogram vectors, the first element of the vector, black color, has been converted into zero. In this way, the black color has been deleted. Figure 3 shows the histogram of R vector. We can observe the massive value of the first element “the black color”. We could not see the changes in other colors without the log scale in the y- axis. Figure 4 shows the histogram after zeroing the first element.
Figure 3: R vector histogram
Figure 4: R vector histogram without the fist element
B- Feature Extraction:
After extraction color histogram vectors, they have been utilized to extract features. Four different features have been extracted from each vector. These features as follows:
1- Max value in each histogram
2-Variance of each histogram 3- Covariance in each histogram
4- Number of values above a
threshold
[image:4.595.347.507.216.494.2] [image:4.595.50.238.668.737.2]Figure 5: GLCM Example
Gray levels must be specified before utilizing GLCM. After extracting GLCM matrix, features should be extracted from this matrix. Two features have been calculated in this project; correlation and contrast. Correlation defines the joint probability; on the other hand, contrast defines the local variance.
B- SFTA:
SFTA takes a gray image and converts it into a number of binary images based on Two-Threshold Binary Decomposition (TTBD). Subsequently, fractal dimensions of the resulting regions are calculated and texture is extracted. The output of this algorithm is a vector of binary images’ size,
This equation converts the values to vary from -1 to 1.
1.2.2 Texture
The second image pre-processing step is to utilize texture as a feature. Two different methods have been implemented. Gray- level Co-occurrence Matrix (GLCM) and Segmentation-based Fractal Texture Analysis (SFTA) have been implemented. In the following sections, these methods will be demonstrated.
A- GLCM: features.
3.2.3. Feature Vector
After implementing these algorithms and steps on color and texture, a feature vector is constructed for each image. This vector is as follows:
<Max(hist R), Max(hist G), Max(his B), GLCM corr, GLCM contract, Avg(SFTA), conv(R), conv(G), conv(B), var(R), var(G), var(B)>
This vector is the feature vector and has been fed into the classifier.
1.3. Classification
Classification is a famous machine-learning problem. Many algorithms emerged to tackle classification problem. Classification can be handled in the two kinds of machine learning algorithms; supervised and non-supervised. However, in this work supervised logistic regression algorithm has been utilized. The following section describes our classification model.
1.3.1. Logistic Regression
Logistic Regression (LR) is a type of supervised machine learning algorithm, which used for classification. Its name shows that LR classifies into two different classes (Logic 1, 0). LR depends on probability output that classifies into zero or one.
As any machine-learning algorithm, LR requires a hypothesis and a cost function. The hypothesis is the function utilized to obtain the probability that used to find a class for the new object. Cost function is the function utilized to optimize the hypothesis. Equ.2 shows the hypothesis of LR. Equ.3 shows the cost function.
First, number of m ants being associated with m random initial values. We set them to the same value.
Second, we take our feature (n) dimension hypothesis and we search for its minimums. To show an example we will show only one feature (diminution) and show how it extended. Suppose the function y=f(x) is defined in interval
[a, b]. Firstly, we divide the interval into n small subinterval with the same size, marked as
{I1 , I2 ,... , In }. Ants will move to the neighboring intervals and calculate the cost function to find if the cost reduced or increased. According too the output, Ants update the pheromone to the new solution for other ants to use it or skip it. Fig. 5 shows the ant moves in one diminution.
Figure 6: Ants moves’ in 1D
Where ’s are the weights of the hypothesis, X’s are the input features and y’s are the output values.
[image:5.595.338.506.198.362.2]Our job is to optimize this cost function. In other words, ... For optimization purposes, Ant colony optimiation (ACO) is used. Another issue to takle is the classification into four different classes not only two.
1- ACO:
The ACO algorithm has been used to find the global minimum of the cost function. In the proposed algorithm, should be implemented. These steps are as follows:
a- Initialize the distribution of the ant
colony
b- Determine the rule of move of the ant colony
c- Update of the pheromone d- Narrow the
research space
Finally, this method in 1D should be extended to nD where n is the number of features. The extension reduced the speed of finding the global min. However, speed can be increased by adding more ants.
2- LR multi-classifications:
To extend LR for 4 classes not two, we generated four hypothesises. Each one classify for only one class. For the first hypothesises, one class is excellent and the second class is other. For the second hypothesises, one class is very good and the other is any and so on. This method can extend LR.
IV. EXPERIMENTAL RESULTS
270 photos have been used; 80 from the first class 60 from the second 70 from the third and 60 of the forth. A farming expert has classified these
ORCID: 0000-0003-2317-6183 reason is to generate a training matrix for our model.
These photos have been fed into image pre- processing and feature extraction to obtain a matrix of 12x270 as an input training matrix. Four different output vectors has been generated to train four different LR hypothesises. The first vector consist of 80 ones and 190 zeros. The second vector, 80 zeros
then 60 ones then 130 zeros. The third and the forth in the same manner. This mean that the training must run four different times.
[image:6.595.75.262.274.450.2]The input matrix and one of the output vectors has been fed into LR and ACO has been used to optimize the cost function. Fig.7 shows the relation between optimal min finding iteration and the number of ants utilized. We can observe from the figure that more ants means fast searching. This mean that ACO is one of the best algorithms for distributed algorithms since each ant works alone. This can convert the searching process into a parallel algorithm to increase its speed.
[image:6.595.332.523.360.509.2]Figure 7: Ants count vs Iterations
[image:6.595.73.268.514.711.2]Fig. 8 shows the error value of our model for 200 iterations. We can observe how much the error reduced as a function of the number of utilized ants.
Figure 8: Error Value 3- Execution Time:
A. In this project, execution time is divided into two classes, training time and decision-making time. Each one of these classes consist of two layers; feature
extraction and results. Feature extraction is the common and shared layer between these two classes. Feature extraction is
fast, however, SFTA algorithm consist of many steps that require time. Fig. 9 and fig.
10 shows the time required to extract our feature vector from one photo to 129 photos. We can observe that execution of SFTA for one image requires approximately 40 seconds. We also can observe that the extracting time is increasing linearly with total number of photos. We can observe that to extract features for any new image, approximately 50 seconds are required.
After extracting the features in the first layer of our two classes, the execution time of the second layer can be calculated. After training our model with 129 images for an iteration of 200 and 4 ants, training time recorded 77.3525 minutes. We can observe that training the model with ACO require more time. However, it is good for distributed and deep learning algorithms. To measure the relation between the number of ants and the training time, we repeated the experiment with 2,4,6,8 and 10 ants with the same number of iterations. Fig. 11 shows the output of this configuration. We can observe that the training time increases linearly with the increases of number of ants. However, the accuracy also increases as in fig.
12. We can observe that to obtain the same accuracy level with different number of ants, iteration number varies. This shows a tradeoff between the number of ants, iterations and execution time.
[image:6.595.334.520.537.689.2]13.
Figure 9: Feature Extraction time with SFTA
Figure 11: Time with number of Ants
To show this fact, we reduced the number of iterations into 50 and we used 5, 10, 15 and 20 ants. Figure 13 and 14 shows the output of this configuration.
[image:7.595.307.547.126.221.2]Finally, the making decision time is our second class. This class consists of feature extraction and using these features in our four equations. The calculation of these equations is neglected. This makes the feature extraction time the most important part in time calculation. This time as mentioned, can be less than 7 seconds without SFTA and approximately 40 second with the execution of these algorithm.
[image:7.595.317.539.267.394.2]Figure 12: Training Time for 50 Iteration and more Ants
Figure 13: Accuracy of 50 Iteration
Regarding the Guava fruit size, it was estimated from the dimensions of the image, by counting the pixels. Moreover, linear regression model was calculated by determining the actual size of the Guava fruit using manual method, and
comparing it with the size estimated by calculating the number of pixels. The resulted output was 0.997 with of 99.45%. The table below shows standard error less than 1mm and the tuned linear model.
Table 1: Regression Analysis (Manual VS Automatic)
Paramete r
Estimatio n
Standar d Error
T P
Value
Constant -0.91001 0.1813 -5.1008 0
0
Size 1.014 0.00195 414.31 0
1 0
The linear model graph is shown in the below figure, comparing the automatic method with manual method.
Figure 14: Regression Analysis (Manual vs Automatic)
The Spectrophotometer in comparison with the image analysis are also in linear model regression as shown in the table below.
Table 2: Regression Analysis CCI (Spectrophotometer vs. image analysis)
Paramete r
Estimatio n
Standar d Error
T P
Value
Constant 7.7666 0.12944 59.997
8
0.000 0
CCI equipmen
t
0.40001 0.00884 48.000
0
0.000 0
CCI equipmen
t ^ 2
0.002500 0.000411 6.1000 0.000
0
[image:7.595.74.266.379.528.2] [image:7.595.64.265.383.696.2]ORCID: 0000-0003-2317-6183
Figure 15: CCI Regression Model
[image:8.595.314.539.168.334.2]The table below shows the performance of each class and the average performance of the system as all.
Table 3: Class and System Performance
Class Performance (%)
Cat. 1 (Excellent)
93
Cat. 2 (Very Good)
92
Cat 3. (Good) 93
Cat 4. (Bad) 93
Avg. Performance
92.75
The below table shows the confusion matrix for the four classes using the proposed technique.
Real/Test (%)
Cat 1 (Excellent)
Cat 2
(Very Good)
Cat 3 (Good)
Cat 4 (Bad)
Cat 1 (Excellent)
93 3 4 0
Cat 2 (Very Good)
1 92 2 5
Cat 3 (Good)
6 0 93 1
Cat 4 (Bad)
1 2 4 93
It is clearly noticed from the figure above that the confusion matrix showed the performance of each class in addition to the system at all. However, in order to compare this result with the other works this performance should be evaluated.
The performance of the proposed work will be evaluated and compared with previous works used different techniques [7][8][9][11]. The below criteria will be considered in the performance evaluation process.
Truly Detected (TD): truly categorizing the new sample.
Falsely Detected (FD): Falsely categorizing the new sample.
Average Precision Time (APT): Processing time
required to recognize the new sample.
Categories with Missing Data (MC): Detected categories with misses more then 20% of the sample
images.
The measurements used for performance are calculated as follow:
Recall . Where AC is the actual number of categories.
Precision
F-Measure .
Misdetection Rate (MDR) = MC/TD.
Table 4: Performance Table
Methods Reca ll Precisio n
F-Measur e MD R
APT(s )
Propose
d Method 0.93 0.82 0.82 0.09 2.4
Threshol d
[7] 0.92 0.80 0.85 0.07 11.7
ultrasoni c
[8] 0.69 0.85 0.76 0.44 1.13
thermal [9] 0.73 0.43 0.54 0.16 24.9
hyper- spectral
[11]
0.49 0.75 0.59 0.13 1.6
From the above table it is clearly noticed that the proposed method enhanced the detection rate and reduced the missing rate in comparison with other techniques. Moreover, the process time is clearly low, considering the shown process time of the previous works.
V. CONCLUSIONS
During the recent years, the categorization techniques have been largely used within different fields. One of these significant fields is the agricultural field, where these techniques have been utilized to categorize the different types of fruit and vegetables. In this study, the categorization technique has been used to categorize the Guava fruit into four
different classes based on their quality. The AAC algorithm has been used to perform the categorization process beside to the LR algorithm.
Large sample of images has been used within this study, where many image have been taken for each fruit from different positions to increase the accuracy of categorization. In addition, these images have been improved and modified through the pre- processing phase, where the Weiner filter has been used for this purpose. Moreover, the captured images have been converted into binary images to make the extraction process more accurate. Two types of attributes have been extracted from images; color and texture attributes.
The SFTA and GLCM algorithms have been utilized to analyze the texture attributes.
The contributed results indicated that there is a tradeoff between these measurements and number of ants and number of iterations. Furthermore, using ACO algorithm helps to increase the accuracy percentage of this work. Based on these obtained results, the performance of this method is better than the performance of conventional methods.
REFERENCES
1. Khoshhal, A. A. Dakhel, A. Etemadi and S. Zereshki, “Artificial Neural Network Modeling of Apple Drying Process”, Journal of Food Process Engineering, pp. 298-313, June, 2009.
2. Pratap, N. Agarwal, S. Joshi and S. Gupta, “Development of Ann Based Efficient Fruit Recognition Technique”, Global Journals Inc. (USA), vol. 14, no. 5, 2014.
3. Stajnko, M. Lakota and M. Hočevar, “Estimation of Number and Diameter of Apple Fruits in an Orchard During the Growing Season by Thermal Imaging, Comput, Electron, Agric, pp. 31-42, 2004. 4. Unay and B. Gosselin, “Automatic Defect Segmentation of Jonagold
Apples on Multi-Spectral Images: A Comparative Study”, Postharvest Biology and Technology, pp. 271–279, 2006.
5. Elhariri, N. El-Bendary, M. M. M. Fouad, J. Platoš, A. E. Hassanien and A. M. M. Hussein, “Multi-class SVM Based Classification Approach for Tomato Ripeness”, Springer International Publishing, pp. 175-186, 2014.
6. H. cao, P. Huang and S. Luo, “A Novel Image Segmentation Algorithm Based on Artificial Ant Colonies”, MIMI 2007, LNCS 4987, pp. 63-71, 2008.
7. H. Okamoto and W. S. Lee, “Green Citrus Detection Using Hyperspectral Imaging, Comput, Electron, Agric, pp. 201–208, 2009. 8. J. A.T. Pennington and R. A. Fisher, “Classification of fruits and
vegetables”, Journal of Food Composition and Analysis, pp. 23-31, 2009.
9. J. D. Pujari, R. Yakkundimath and A. S. Byadgi, “Grading and Classification of Anthracnose Fungal Disease of Fruits Based on Statistical Texture Features”, International Journal of Advanced Science and Technology, March, 2013.
10. J. D. Pujari, R. Yakkundimath and A. S. Byadgi, “Reduced Color and Texture features based Identification and Classification of Affected and Normal fruits’ images”, International Journal of Agricultural and Food Science, vol. 3, no. 3, pp. 119- 127, Sep. 2013.
11. Wachs, H. I. Stern, T. Burks, V. Alchanatis and I. Bet-Dagan, “Apple Detection in Natural Tree Canopies from Multimodal Images, the 7th European Conference on Precision Agriculture, pp. 293-302, July, 2009.
12. Wang, D. Zhao, W. Ji, J. Tu and Y. Zhang, “Application of Support Vector Machine to Apple Recognition Using in Apple Harvesting Robot”, Information and Automation, 2009. ICIA '09. International Conference on, pp. 1110 – 1115, June, 2009.
13. Yamamoto, W. Guo, Y. Yoshioka and S. Ninomiya, “On Plant Detection of Intact Tomato Fruits Using Image Analysis and Machine Learning Methods”, Sensors, pp. 12191-12206, 2014. 14. M. Dorigo and L. M. Gambardella, “A Study of Some Properties of
Ant-Q”, Proceedings of the 4th International Conference on Parallel Problem Solving from Nature, pp. 656–665, 1996b.
15. M. Dorigo, “Optimization, Learning and Natural Algorithms”, Dipartimento di Elettronica, Politecnico di Milano, Italy, 1992. 16. M. Dorigo, V. Maniezzo and A. Colorni, “Ant System: Optimization
by a Colony of Cooperating Agents”, IEEE Transactions on Systems, Man, and Cybernetics – Part B, vol. 26, no. 1, pp. 29–41, 1996. 17. M. Dorigo, V. Maniezzo and A. Colorni, “Positive Feedback as a
Search Strategy”, Dipartimento di Elettronica, Politecnico di Milano, Italy, 1991.
18. M. Kshirsagar and P. Arora, “Classification Techniques for Computer Vision Based Fruit Quality Inspection: A Review”, International Journal of Recent Advances in Engineering & Technology (IJRAET), vol. 2, no. 3, 2014.
19. Regunathan and W. S. Lee, “Citrus Fruit Identification and Size Determination Using Machine Vision and Ultrasonic Sensors, ASAE Annual International Meeting; Tampa, FL, USA, July, 2005. 20. Suresha, N. A. Shilpa and B. Soumya, “Apples Grading based on
SVM Classifier”, International Journal of Computer Applications, on National Conference on Advanced Computing and Communications
– NCACC, pp. 27-30, April, 2012.
21. Maftoonazad, Y. Karimi, H. S. Ramaswamy and
22. S. O. Prasher, “Artificial Neural Network Modeling of Hyperspectral Radiometric Data for Quality Changes Associated with Avocados During Storage”, Journal of Food Processing and Preservation, vol. 35, no. 4, pp. 432-446, August, 2011.
23. Safren, V. Alchanatis, V. Ostrovsky and O. Levi, O, “Detection of Green Apples in Hyperspectral Images of Apple-Tree Foliage Using Machine Vision, Trans, ASABE, pp. 2303–2313, 2007.
24. A. Khoje and S.K. Bodhe, “Application of Colour Texture Moments to Detect External Skin Damages in Guavas (Psidium guajava L)”, World Applied Sciences Journal, Vol. 27, No. 5, pp. 590-596, 2013. 25. Ouadfel, M. Batouche and S. Talhi, “Ant Colonies For MRF-Based
Image Segmentation”, International conference secience Sciences of Electronic, Technologies of Information and Telecommunications, 2005.
26. Sh. Singh, “Microscopic Image Analysis of Nanoparticles by Edge Detection Using Ant Colony Optimization”, IOSR Journal of Computer Engineering (IOSR-JCE), vol. 11, no. 3, pp. 84-89,June, 2013.
27. Sh. Wang, Y. Zhang, G. Ji, J. Yang, J. Wu and L. Wei, “Fruit Classification by Wavelet-Entropy and Feedforward Neural Network Trained by Fitness- Scaled Chaotic ABC and Biogeography-Based Optimization”, Entropy, pp. 5711-5728, Aug. 2015.
28. Stutzle and H. H. Hoos, “Max–Min Ant System”, Future Generation Computer Systems, vol. 16, no. 8, pp. 889–914, 2000.
29. Leemans and M.F. Destain, “A real-time grading method of apples based on features extracted from defects”, Unité de Mécanique et Construction, Gembloux Agricultural University, Passage des Déportés, 2, B-5030 Gembloux, Belgium, 2009.
30. Pradeep, R. Mahendran and K. Alagusundaram, “Classification of Guava Based on Color using Computer Vision System”, Indian Journal of Animal Nutrition, Vol. 7, No. 16, pp. 2168-2174, Dec. 2014.
31. VaniAshok and D.S. Vinod, “Using K-Means Cluster and Fuzzy C Means for Deffect Segmentation in Fruits”, the 2nd International Conference on Current Trends in Engineering and Management ICCTEM, pp. 11-19, 2014.
32. Ch. Seng and S. H.Mirisaee, “A New Method for Fruits Recognition System”, 2008.
33. Liu, X. Wang, N. Shi and C. Li, “Image Segmentation Algorithm Based on Improved Ant Colony Algorithm”, International Journal of Signal Processing, Image Processing and Pattern Recognition, vol. 7, no. 3, pp. 433-442, 2014.
34. Chen, X. Qin and X. Zhou, “Single Threshold Segmentation for Noisy Image Based on Fuzzy Ant Colony Algorithm”, Computer Modelling and New Technologies, vol. 18, no. 11, pp. 311-316, July, 2014.
35. Zh. Ye, Zh. Zheng, X. Yu and X. Ning, “Automatic Threshold Selection Based on Ant Colony Optimization Algorithm”, IEEE, pp. 728-732, 2005.
AUTHORSPROFILE
Ra’Ed QaQish, is a licensed architect (JEA), designer, and educator who has practiced and taught architecture, interior design, and graphic design at various universities in several countries. He is also a plastic/digital artist who has won numerous awards and participated in a great number of art exhibitions/ Biennales internationally.
Dr. QaQish has lectured and acted as a guest critic at numerous academic institutions in Jordan, the UK, and the US. He has taught architecture design studios/ visual communication / CAAD - BIM and extensive, wide-ranging related topics for more than 14 years at distinguished faculties both as Assistant and Associate Professor of Architecture and Design.
Educated in the United States and the United Kingdom, and sponsored by a Chevening Scholarship, a HANSARD Scholarship, and Noor Al-Hussein Foundation grants, QaQish received a B.Sc. in Architectural Studies from the University of Wisconsin- Milwaukee (UWM), USA in 1984, a MARCH from UWM in 1987 (Scholarship) , and a PhD in Architecture / CAAD from Glasgow University (Mackintosh School of Architecture), UK in 1997 (Chevening Scholarship). He
ORCID: 0000-0003-2317-6183 (HANSARD Scholarship) and a Post- Doctorate internship at the Design
Council in London, where he researched the impact of Architectural design on the practice of Politics (Portcullis House post occupancy design analysis case study) In 2002. He further undertook a course in Conflict Resolution- Education at Temple University in 2004.
In academia, he was the founding Dean of Architecture and Design faculties at a number of notable universities, namely AAU, AUM, and MEU. Before CUD, he was the founding Dean and Associate Professor of Architecture at KUTC. Earlier in his academic career, QaQish was the founding head of the graphic design department at the UOP.
His philosophy in education hinges on the concept of amalgamating design and digital art, combined with advocating new paradigms and pedagogies in architecture education vs. the profession, raising questions about the new face of professionalism in architecture and design.
Dr. QaQish has extensive experiences in architecture and design, academic planning, enhancement/ establishing training programs, and curriculum development both in professional and regional accreditation.
Founder and CEO of WTV, Qaqish is also a TV producer, presenter and media civil advocate, as well as a specialized trainer in soft skills. He sits on the board of directors of several leading international NGOs.
Dr. QaQish is a researcher in the subject of Architecture and CAAD; he has published a great number of papers on topics related to CAAD, CAL, digital design and architectural education.
Contact
RaEd QaQish, PhD raedqaqish@gmail.com Mobile no: 079 585 39 39 P.O.Box 961 401 Amman- 11196 JORDAN.
Amani Al-alaya holds a Bachelor of computer
engineering and a Master degree of Embedded system engineering and has been working in educational services since 2009. She taught image proceesing, Networking, Applied engineering mathematics , and many computer engineering courses at Khalifa University, alkhawarizmi University and Laureat vocational college and she was honored for her efforts in Laureat Vocational college Appreciation Certificate .
My personal teaching philosophy includes
Treating all students with absolute equality, regardless of age, gender, nationality, intellectual ability or personal attractiveness.
Making it clear that I am always available on request.
everything back to the standards of the engineering industry, where a single error could lead to tremendous expense or even loss of life.
I make it my business to try to understand the student's point of view however erroneous before attempting to give them my own. This means that when I do teach I can choose a conceptual path that leads from the students current understanding to a broader or more conventional one. The students in my classes know this and ask me for help in their other subjects!
I try to set a good professional example in written solutions and in conversation, by always referring
Enthusiasm is critical to good teaching, and students have a sixth sense for it.
Contact
Amoonh87@windowslive.com Mobile no: 00966548776211