International Journal of Innovative Technology and Exploring Engineering (IJITEE) ISSN: 2278-3075,Volume-8 Issue-12, October 2019
Abstractin This Work, Debye Temperature And Debye Frequency Of Metals Were Computed And Studied Using Quantum Einstein Theory. The Electron Density Parameters Of Strained Metals Is Obtained And Used In The Computation.. The Results Obtained Revealed That There Is Agreement Between The Computed And Experimental Values Of Debye Temperature And Debye Frequency. This Shows That The Model Can Be Used To Study Debye Properties Of Metals. The Debye Temperature And Debye Frequency Obtained Are More Concentrated In The High Density Limit. This Revealed That Debye Temperature And Debye Frequency Of Metals Depend On The Electronic Concentration. Also, The Experimental Value Of Debye Temperature And Debye Frequency Is Higher Than The Computed Value, This Is Because Of Some Factor Which Debye Temperature And Debye Frequency Relied On That The Theory Failed To Account For.
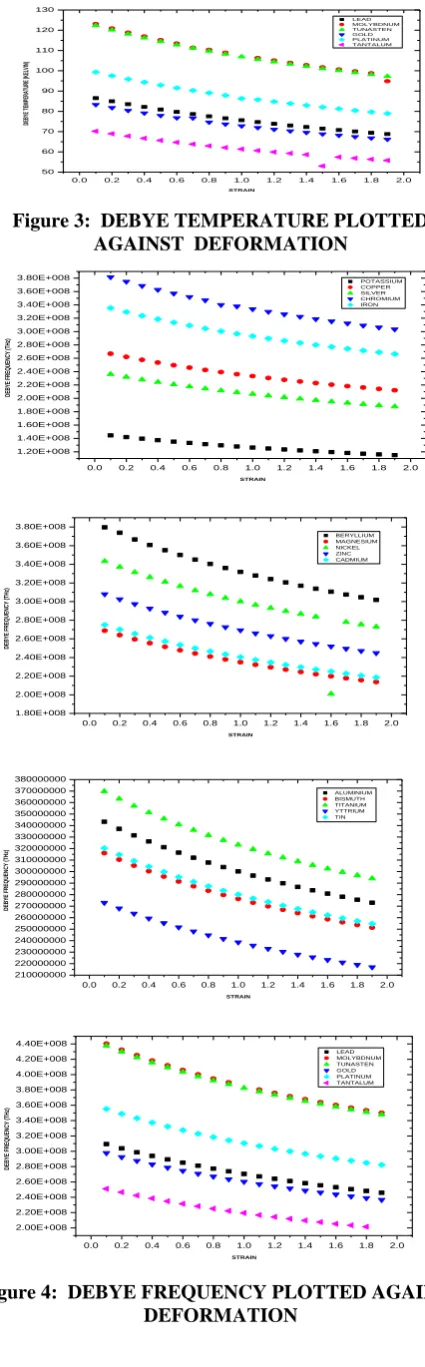
Debye Temperature And Debye Frequency Of Metals Reduces As Strain Increase. This Shows That As Strain Increase, Space Between Lattice Atom Increase Which Reduces Strength Of Electron Interaction And There-By Forces Debye Temperature, Debye Frequency To Decrease As Deformation Increase. This Behavior Of Metals Reveal That Debye Temperature And Debye Frequency Is Greatly Affected By Deformation.
Keywords: Deformation, Einstein model, Debye temperature, Debye frequency, poison ratio. Electron density parameter
I. INTRODUCTION
Solid consists of a sufficiently large collection of atoms that exhibit the characteristic behavior of bulk material, the atom may lose some of its tightly bound electrons leaving the core electrons, such entity is known as ions (Rogalski and Palmer, 2000). At a finite temperature, the atoms in a crystalline lattice vibrate about their equilibrium positions with amplitude that is temperature dependent, these vibrations can be explained in terms of collective modes of motion of the ions. When atom vibrates, the force on atoms changes causing them to vibrate (Efthimios, 2003). Crystal lattice dynamics
Revised Manuscript Received on December 22, 2018.
G.E. Adesakin: Department of Physics, Ekiti State University,
Ado-Ekiti, Nigeria
O. Olubosede: Department of Physics, Federal University Oye- Ekiti,
Nigeria
A. T. Fatigun: Department of Physics, Ekiti State University, Ado-Ekiti,
Nigeria
O. G. Edema: Department of Science Laboratory Technology, Federal
Polytechnic, Auchi, Edo State, Nigeria
T. H. Akande: Department of Physics, Ekiti State University, Ado-Ekiti,
Nigeria
G. S. Agunbiade: Department of Physics, Ekiti State University,
Ado-Ekiti, Nigeria
E.O. Aliyu: Department of Computer Science, Adekunle Ajasin
University, Akungba Akoko
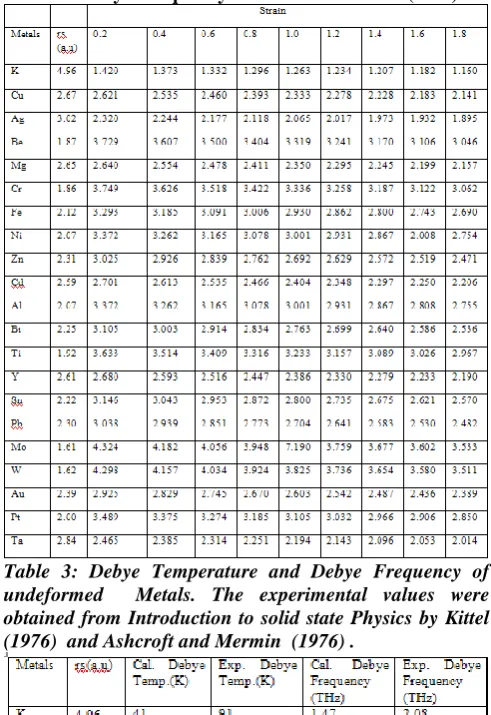
can be discussed in the frame of the adiabatic approximation by solving Hamiltonian operator for the motion of the ions about their equilibrium position which defines the lattice spatial distribution. Lattice vibrations can be described in terms of waves propagating along a linear chain, such that the amplitude of the vibration for the atom is equal in the Debye approximation, a linear lattice can sustain long wavelength elastic waves which propagate without dispersion (Rogalski and Palmer, 2000). Debye model of solid treats the frequency spectrum as linearly dependent on the wave-vectors for all modes. For a realistic computation, the actual frequency spectrum is included to give a density of states with features that relied on the structure of solid (Efthimios, 2003). The Debye model is an isotropic continuum where motion of an atom influences its neighbor’s motion. Atomic vibrations have complete spectrum of frequencies which vary in a continuous fashion, the medium is dispersion-less and the velocity of sound is independent of the frequency and the number of standing sound waves that can be fitted in the solid with frequencies in the range between vibrating mode to determines the spectrum which is characterized by a cut-off frequency known as Debye frequency (Kachava, 1992). Deformation is when metals undergo compressive force, torsion force or tensile force and the shape or size becomes different. Because of the anisotropy of a crystal, the atoms of any crystal can be deformed in a variety of ways that can be decomposed into three types of independent deformations viz, uniform compression associated with the bulk modulus or compressibility and two shears in both of which the volume is unchanged (Animalu, 1977). Mathematically, any lattice deformation can be characterized by a second-rank tensor , called a strain tensor which has three independent components in a system with cubic symmetry (Animalu, 1977).Consequently, a lot of success have been recorded in the study of deformed properties of metals theoretically and experimentally. Kiejna and Pogosov (1999) investigated experimentally the effect of deformation on electronic properties of metals based on Kelvin method. The result obtained shows that contact potential difference of the metals increase/decrease when compressed/tensed. Pogosov and Shtepa, (2006), studied surface stress and contact potential difference of elastically strained metals based on structureless pseudopotential formalism. The results obtained were in agreement with experimental results. Adeshakin and Osiele (2012) theoretically studied the surface energy and surface stress of strained metals using structureless pseudopotential model.
Conclusive Research Design and Development
of the Effect of Linear Deformation on Some
Debye Properties of Metals
Properties of Metals
The results obtained revealed that deformation causes a reduction of surface energy, some metals have tensile stress on their surfaces while some have compressive stress on their surfaces. Surface stress of some metals decreases as deformation increases while some increases. Adeshakin et al. (2012) applied structureless pseudopotential to study correlation, binding and cohesive energy of metals. The result obtained is in agreement with experimental values. The results obtained show that deformation decreases the binding energy of metals but does not significantly affect cohesive energy of metals. Adeshakin et. al (2015) computed the electron density parameter, Fermi energy, Fermi wave vector and chemical potential of strained metals using structureless pseudopotential. The results obtained revealed that deformation affect electron density parameter, Fermi wave vector, Fermi energy and chemical potential of metals. Adesakin, (2018), computed electronic heat capacity of metals based on Einstein model formalism. There is agreement between the computed and experimental values which shows the validity of Einstein model in studying the
electronic heat capacity of metals. The electronic heat
capacity of all the metals increases as deformation (strain) increases. This is because as the collision between the interacting electron increases the electron thermal excitation also increases and there-by result in the increase in the electronic heat capacity as deformation increases.
In this work, Einstein model is extended to study Debye temperature and Debye frequency of metal. The metals were chosen based on experimental data available and physical constants required for computation.
II. THEORETICAL EXPRESSION FOR DEBYE PROPERTIES OF METALS
The internal energy per unit volume of quantum mechanical calculation in terms of phonons is
(1)
Where, is the energy corresponding to a particular state of the system which involves a number of excited phonons. The total energy due to the phonon excitations is given by
(2)
is the index and k is the wave-vector. In classical discussion, the total energy is
(3)
using mathematical trick to express this in a more convenient form. Consider the expression
(4)
Which involves a sum of all exponentials containing terms
with all possible non-negative integer
values of . The expression
(5) Substituting equation (5) into equation (3) gives the summation geometric series as
(6)
The total internal energy per unit volume is
(7)
Where
(8)
The quantity represents the average occupation of
the phonon state with frequency at temperature T. From equation (7), the specific heat per unit volume is
(9)
Turning the summation into an integral, the specific heat in equation (9) become
(10)
Differentiating equation (10), the heat capacity can be express as
(11)
is the number of oscillators with frequencies
range, is the Debye frequency which is the highest frequency of any normal mode.
To be able to compare equation (11) with experimental value of heat capacity, consider the three-dimensional case where a system of N ions has 3N degree of freedom (N-ions=3N) independent quantum oscillators and the normalization condition is
(12)
Since every lattice point is associated with one longitudinal mode and two transverse modes with phase velocities and
respectively for any given frequency we have
=
International Journal of Innovative Technology and Exploring Engineering (IJITEE) ISSN: 2278-3075,Volume-8 Issue-12, October 2019
is the mean phase velocity. Putting equation (13) into equation (12)
(14)
(15)
(16)
(17)
Recall that both side of equation (17) is equal to 3N
(18)
then
(19) and
(20)
= (21)
therefore
(22)
Since equation (19) and equation (21) is the same, the Debye frequency or cut-off frequency is obtained using equation (21) as
(23)
Substituting equation (19) and equation (21) into equation (13) we have
(24)
Using the frequency distribution function, the lattice heat capacity in equation (11) can be written as
(25)
When then
(26)
By integrating equation (26), the Debye temperature is obtained as
(27)
In this work, the Debye temperature and Debye frequency of deformed metals were computed using equation (27) and (23).
III. RESULTS AND DISCUSSION
[image:3.595.44.286.61.591.2]Properties of Metals
1.5 2.0 2.5 3.0 3.5 4.0 4.5 5.0 0 100 200 300 400 500 600 700 DE BY E T E M P E RAT URE (K)
ELECTRON DENSITY PARAMETER (a.u)
[image:4.595.71.471.46.770.2]Experimental Debye Temperature Computed Debye Temperature
Figure 1; DEBYE TEMPERATURE VERSUS ELECTRON DENSITY PARAMETER
1.5 2.0 2.5 3.0 3.5 4.0 4.5 5.0
0.00E+000 5.00E+012 1.00E+013 1.50E+013 2.00E+013 DE BY E F RE Q UE NCY ( Hz )
ELECTRON DENSITY PARAMETER (a.u)
Experimental Debye Frequency Computed Debye Frequency
Figure 2: DEBYE FREQUENCY PLOTTED AGAINST ELECTRON DENSITY PARAMETER
0.0 0.2 0.4 0.6 0.8 1.0 1.2 1.4 1.6 1.8 2.0 30 35 40 45 50 55 60 65 70 75 80 85 90 95 100 105 110 DE BY E T EM PE RAT URE (KE LV IN) STRAIN POTASSIUM COPPER SILVER CHROMIUM IRON
0.0 0.2 0.4 0.6 0.8 1.0 1.2 1.4 1.6 1.8 2.0 60 65 70 75 80 85 90 95 100 105 110 DE BY E T EM PE RAT URE (KE LV IN) STRAIN BERYLLIUM MAGNESSIUM NICKEL ZINC CADMIUM
0.0 0.2 0.4 0.6 0.8 1.0 1.2 1.4 1.6 1.8 2.0 60 65 70 75 80 85 90 95 100 105 DE BY E T E M P E RAT URE (KE LV IN) STRAIN ALUMINIUM BISMUTH TITANIUM YTTRIUM TIN
0.0 0.2 0.4 0.6 0.8 1.0 1.2 1.4 1.6 1.8 2.0
[image:4.595.316.529.55.740.2]50 60 70 80 90 100 110 120 130 DE BY E T EM PE RAT URE (KE LV IN) STRAIN LEAD MOLYBDNUM TUNASTEN GOLD PLATINUM TANTALUM
Figure 3: DEBYE TEMPERATURE PLOTTED AGAINST DEFORMATION
0.0 0.2 0.4 0.6 0.8 1.0 1.2 1.4 1.6 1.8 2.0 1.20E+008 1.40E+008 1.60E+008 1.80E+008 2.00E+008 2.20E+008 2.40E+008 2.60E+008 2.80E+008 3.00E+008 3.20E+008 3.40E+008 3.60E+008 3.80E+008 DE BY E F RE Q UE NCY (T Hz ) STRAIN POTASSIUM COPPER SILVER CHROMIUM IRON
0.0 0.2 0.4 0.6 0.8 1.0 1.2 1.4 1.6 1.8 2.0 1.80E+008 2.00E+008 2.20E+008 2.40E+008 2.60E+008 2.80E+008 3.00E+008 3.20E+008 3.40E+008 3.60E+008 3.80E+008 DE BY E F RE Q UE NCY (T Hz ) STRAIN BERYLLIUM MAGNESIUM NICKEL ZINC CADMIUM
0.0 0.2 0.4 0.6 0.8 1.0 1.2 1.4 1.6 1.8 2.0 210000000 220000000 230000000 240000000 250000000 260000000 270000000 280000000 290000000 300000000 310000000 320000000 330000000 340000000 350000000 360000000 370000000 380000000 DE BY E F RE Q UE NCY (T Hz ) STRAIN ALUMINIUM BISMUTH TITANIUM YTTRIUM TIN
0.0 0.2 0.4 0.6 0.8 1.0 1.2 1.4 1.6 1.8 2.0 2.00E+008 2.20E+008 2.40E+008 2.60E+008 2.80E+008 3.00E+008 3.20E+008 3.40E+008 3.60E+008 3.80E+008 4.00E+008 4.20E+008 4.40E+008 DE BY E F RE Q UE NCY (T Hz ) STRAIN LEAD MOLYBDNUM TUNASTEN GOLD PLATINUM TANTALUM
[image:4.595.74.268.59.173.2]International Journal of Innovative Technology and Exploring Engineering (IJITEE) ISSN: 2278-3075,Volume-8 Issue-12, October 2019
IV. CONCLUSION
A model for computing Debye temperature and Debye frequency of metals based on the Einstein model formalism is presented. The Debye temperature and Debye frequency obtained were in agreement with experimental results which show that Einstein model is useful in the theoretical prediction of some properties of metals. Also, the computed and experimental value of Debye temperature and Debye frequency of the undeformed metals are more concentrated in the high density region. This shows that the higher the valence electron in metals the higher the Debye temperature and Debye frequency. The Debye temperature and Debye frequency of all the metals decreases as deformation increases.
[image:5.595.303.549.60.418.2]Table 1: Debye Temperature of Deformed Metals (K)
Table 2: Debye Frequency of Deformed Metals (THz)
[image:5.595.304.550.380.795.2]Properties of Metals
REFERENCES
1. Adeshakin, G.E.and Osiele, O.M. (2012). Surface Energy and Surface Stress of Deformed Metals. Journal of the Nigerian Association of Mathematical Physics, Vol. 21, 421-428.
2. Adesakin, G.E., Osiele, O.M. and Oluyamo, S.S. (2012). Effects of Deformation on the Energies of Metals. Advances in Physics Theories and Applications.10, 11-19.U.K.
3. Adesakin, G.E., Osiele, O.M. and Oluyamo, S.S. (2015). Linear Deformation and the Electronic Properties ofMetals. International Research Journal of Pure and Applied Physics. Vol. 3. Pp15-26, UK. 4. Damaris, M., Orata, D. O., Jackson, G. E., & Kariuki, D. K. (2014).
Speciation of Some Heavy Metals in Ngong River using the Joint Expert Speciation System (JESS). BEST-IJHAMS, 2(10).
5. Adesakin, G.E. (2018). Effect of Linear Deformation on Electronic Heat Capacity of Metals.Journal of American Science, USA. Vol. 14(3), 22-28.
6. Zaki, G. A., Samuel, A. M., Doty, H. W., & Samuel, F. H. (2017). Effect of metallurgical parameters on the performance of Al-2% Cu-based alloys. International Journal of Metalcasting, 11(3), 581-597. 7. Animalu, A.O.E. (1977).Intermediate quantum Mechanics of crystalline
solids. Eagle wood Cliffs, New Jersey.
8. EfthimiosKaxiras (2003): Atomic and Electronic Structure of Solids. Published by the press syndicate of the University of Cambridge UK. 9. Elliott, S.R. (1997). The Physics and Chemistry of solids. Trinity
College, University of Cambridge UK. Pp 291-308.
10. Saravanan, S., Saravanan, M., & Jeyasimman, D. (2018). Study on Effects of Spring Back on Sheet Metal Bending Using Simulation Methods. International Journal of Mechanical and Production Engineering Research and Development (IJMPERD), 8(2), 923-932p. 11. James Patterson·Bernard Bailey, 2010: Solid-State Physics,
Introduction to the Theory. Second Edition. Springer, Springer Heidelberg Dordrecht London New York.
12. Kachhava, C.M. (1992): Solid State Physics. India: Tata McGraw Hill Publishing Company Ltd.
13. Kiejna A. and Pogosov V.V. (1999): Simple theory of elastically deformed metals: Physical Review, Vol.62, 10445-10450.
14. Kittel C. (1976): Introduction to solid state Physics. Fifth edition. John Wiley and sons. Inc. New York.
15. Patel, J. K., & Das, A. M. A. R. E. S. H. (2015). Assessing toxic metals contamination in soil, water and plant bodies around an industrial belt. Int J Res Appl Nat Soc Sci, 3(2), 5-20.
16. Madelung, O. (1995): Introduction to Solid State Theory (2 nd Springer series in Solid State Science). Publish by Spriger. Verlag Berlin Heidelberg.
17. Pillai, S.D. (2010). Solid State Physics. Published by New Age International (P) Ltd. New Revised Sixth Edition. 4835/24. Ansari Road. Daryaganji. New Delhi - 110002 pp 47-86.
18. Patil, S. S., Thakur, V. R., & Ghorade, I. B. (2014). Analysis of heavy metals in Jaikwadi dam water, Maharashtra (India). Int. j of res. & app, 2(5), 69-74.
19. Pogosov V.V. and Shtepa O.M. (2006): Effect of deformation on surface characteristics of finite metallic crystals. Zaporozhye, 69064, Ukraine 1065-1071.
20. Yun, K., Hirano, M., Yanase, S., & Ohya, Y. (2016). New Fabrication Method Suggestion of the Motor Core Using Ceramic Precursor. International Journal of Metallurgical & Materials Science and Engineering (IJMMSE) ISSN (P), 2278-2516.