Abstract: Understanding the customer sentiment is very important when it comes to advertising. To appeal to their current and potential customers, a company must understand the market interests. Companies can segment their customers by using surveys and telemetry data to get to know the customer’s interests. One way of segmenting the customer is by grouping or clustering them according to their interests and behaviors. In this study, the k-prototypes clustering algorithm, which is an improved combination of k-means and k-modes algorithm, will be used to cluster a behavioral data that contains both numerical and categorical attribute, obtained from a survey conducted on teenagers into clusters of 4, 5, and 6. Each cluster will contain teenagers with certain behavior different from other clusters. And then by analyzing the results, advertisers will be able to define a profile that indicates their interests regarding the internet, social media and text messaging, effectively revealing the kind of ad that would be relatable for them.
Keywords : Behavioral data, Cluster Analysis, Interest, K-Prototypes.
I. INTRODUCTION
I
nternet is now a major part of our lives. Nowadays it is very convenient and easily accessible for anyone, whatever their age is. One of the main reasons for people to access the internet is to use a social media to connect and socialize with other people. Teenagers is one of the biggest users of social media. According to a study by Pew Research Center [1], 92% of teens went online daily, one of the main reason is because of the widespread availability of smartphone. With so many teenagers using social media, it is now become a must for the companies to advertise or market their product on social media with the intention to appeal to these younger potential customers, so that their company does not lose against their competitor. The rising popularity of social media advertising forces companies to establish a more intimate relationships with their customers [2]. These companies need to learn more about their own customers inRevised Manuscript Received on November 05, 2019.
Kiefer Stefano Ranti, Computer Science Department, BINUS Graduate Program-Master of Computer Science, Bina Nusantara University,
Jakarta, Indonesia 11480, Email: [email protected]
Kelvin Salim, Computer Science Department, BINUS Graduate Program-Master of Computer Science, Bina Nusantara University,
Jakarta, Indonesia 11480, Email: [email protected]
Andary Dadang Yuliono, Computer Science Department, BINUS Graduate Program-Master of Computer Science, Bina Nusantara University,
Jakarta, Indonesia 11480, Email: [email protected] Abba Suganda Girsang, Computer Science Department, BINUS Graduate Program-Master of Computer Science, Bina Nusantara University,
Jakarta, Indonesia 11480, Email: [email protected]
order to make a more compelling ad that is relatable for their target market [3].
Advertising on social media can be done in many ways; such as using an official account on the social media platform to share information about their products, deals, and promotions or directly paying the social media platform to spread the ad, either in text, image, or video format targeted to specific individuals [2]. Either way, it is a necessity to segment and analyze their own customers sentiment [4], [5], because spreading ads randomly to users that might not be interested of their products in any way is not an effective way to market a product and some user will find it disturbing when they see the ads that they don`t like.
This need of doing a customer segmentation in order to inform companies on what, where, and how to market their products creates an internet-based strategy called Behavioral Targeting. This strategy analyses elements of an individual behavior to create a profile that determines the targeted ads that is going to be displayed to the specific individual [6]–[8]. In order to implement this strategy, a customer segmentation must be carried out by clustering customer data into categories where customers have similar interests.
There are few studies that have been done on clustering and analyzing behavioral data. [9] uses various unsupervised clustering algorithms to identify the consumption patterns of the customers, in order to form specific customer classes containing customers exhibiting similar patterns. [10] uses k-means to cluster bank customer data with high dimensionality and noise then comparing its effectiveness with other algorithms. They conclude that k-means algorithm is very efficient for large multidimensional datasets and it is heavily dependent on the parameter of k. [11] analyses the k-means clustering result of a large scale behavioral data of gamers in Steam platform in order to find an insight in the players behavior. Their cluster analysis shows that the players are dedicated to one game and shows preference towards certain genres.
In this study the customer segmentation will be carried out using the k-prototype algorithm [12]. The dataset used for the clustering process is taken from the result of a survey conducted towards teens aged 12 to 17 in United States by Pew Research Center Internet & Technology. The k-prototypes algorithm will be used as it integrates both k-means and k-modes algorithms to cluster objects with mixed numeric and categorical attributes. This specific algorithm is chosen because the dataset that are used contains both numeric and categorical attributes. Using this algorithm, the data is generated into few clusters. The number of clusters is 4, 5, and 6. These clustering results can be used as a method to analyze the teens’ habits and behaviors, e.g.
Clustering Behavioral Data for Advertising
Purposes using K-Prototypes Algorithm
how frequent they use social media and text messaging, in order to improve the marketing or targeted ads towards them.
II. LITERATUREREVIEW
Cluster analysis or clustering is a process of grouping a set of objects in a way that objects in the same cluster have more similarities with each other compared to those in other clusters [13]. The aim of performing a cluster analysis is to classify distinct information items into groups in such a way that the degree of connection between two objects is high when they belong to the same group and low when they belong to distinct groups [14].
K-means algorithm was first introduced in 1955. It is one of the oldest, most popular unsupervised learning methods to use for clustering data. K-means will group an object into a cluster and in each cluster will have a centroid that represents the cluster. Despite the fact that more than 50 years ago K-means were proposed, and the hundreds of clustering algorithms have since been developed, K-means is still widely used because it is a simple and easy algorithm to implement [15], [16]. The k-means algorithm is known for its clustering efficiency of large data sets. However, its limitation in only able to cluster a dataset containing numerical attributes makes it unusable in dealing with data that contains categorical attributes [17].
To make up for the k-means algorithm’s inability to cluster categorical attributes, [12] proposed the K-modes algorithm, a modification of the k-means algorithm that uses: 1. For categorical objects, a straightforward matching measure of dissimilarity; 2. Using modes for clusters instead of means; and 3. A frequency-based technique for updating methods in clustering to minimize the cost function of clustering [18]. Generally, the K-modes algorithm is faster than the K-means algorithm since the latter needs more iterations to converge [12], [19]. Although the k-modes is faster and can handle categorical attributes, a data containing both numerical and categorical attributes or a mixed attribute data, cannot be clustered using this algorithm. And since the dataset used in this study contains both numerical and categorical attributes, making it a mixed data attribute, the k-prototype algorithm can be a solution to this problem [20].
The k-prototypes algorithm is mainly a combination of k-means and k-modes to address mixed-type data containing both numerical and categorical attributes [21]. The scalability, simplicity and the speed of convergence make this algorithm popular. The clustering process for k-prototypes is similar to the k-means algorithm except that it uses the k-modes algorithm approach to update categorical attribute values [22], [23]. Because this algorithm utilizes the same method of clustering as k-means, it still maintains the effectiveness of the k-means algorithm even though it is still slower than the k-modes algorithm because k-prototypes need more iteration to converge. The k-prototypes algorithm is more helpful for real-world cases as found objects are generally a mixture of numerical and categorical objects or mixed-type items [22].
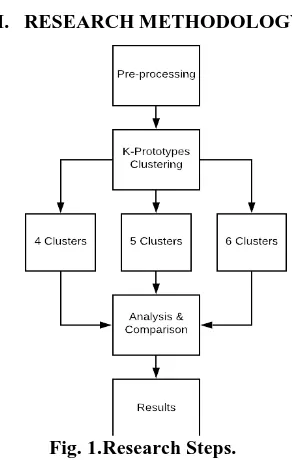
[image:2.595.355.501.230.460.2]III. RESEARCHMETHODOLOGY
Fig. 1.Research Steps.
[image:2.595.100.557.549.809.2]Figure 1 shows the steps that are taken in this study. The first step is to take the dataset from the source. The dataset used for the clustering process is the “Teens online behavior” dataset. It is available on the website BigML (http://www.bigml.com/), where it is taken from the result of a survey conducted towards teens aged 12 to 17 in United States by Pew Research Center Internet & Technology. Table 1: Data Samples
Sex Age Internet Smartphone Computer Texting Socmed Frequency
female 12 Several times a day yes yes 400 yes Every day
male 14 Several times a day yes yes 30 no Never
female 16 About once a day no no 50 yes Several times a week Table 2: Pre-processed data samples
Sex Age Internet Smartphone Computer Texting Socmed Frequency
f 12 severaladay yes yes 400 yes every
m 14 severaladay yes yes 30 no never
The dataset itself contains 612 rows of data from the result of the survey and it has many features, but our dataset consists of 8 of the most important features required for this analysis. Eight of the features that was selected are; “Sex”, “Age”, “How often do you use Internet?”, “Do you have a smartphone?”, “Do you have a computer”, “Do you use Social Networks?”, “How many text messages do you send & receive every day?”, and “How often do you use social media?”. The acquired data are parsed to a more readable format and the column labels are shortened to save space. Some sample of the data can be seen on Table 1.
The next step is to do some simple pre-processing to the dataset, such as setting all characters to lowercase, abbreviate some of the data, and removing punctuations and white spaces. This step is quite useful in order to minimize the time and resources needed to execute the clustering process. The pre-processing result can be seen on Table 2.
After being processed, the data is adequate for the clustering step using the k-prototypes algorithm. Huang proposed this algorithm in [12] with the aim of grouping a dataset into k clusters by minimizing the cost function as shown in here:
𝐸 𝑈, 𝑄 = 𝑘𝑙=1 𝑛𝑖=1𝑢𝑖𝑙𝑑(𝑥𝑖, 𝑄𝑙) (1)
In (1), 𝑄𝑙 is the prototype of the cluster 𝑙. 𝑢𝑖𝑙(0 ≤ 𝑢𝑖𝑙≤ 1) is part of the partition matrix 𝑈𝑛 × 𝑘; while 𝑑(𝑥𝑖, 𝑄𝑙) is the measure of dissimilarity which is given in (2):
𝑑(𝑥𝑖, 𝑄𝑙) = 𝑚𝑗 =1𝑑(𝑥𝑖𝑗, 𝑞𝑙𝑗) (2)
𝑑(𝑥𝑖𝑗, 𝑞𝑙𝑗) =
(𝑥𝑖𝑗 − 𝑞𝑙𝑗)2
𝜇𝑙𝛿(𝑥𝑖𝑗, 𝑞𝑙𝑗)
(3)
In (3), (𝑥𝑖𝑗 − 𝑞𝑙𝑗)2 is if the 𝑙th attribute is a numeric attribute, and 𝜇𝑙𝛿(𝑥𝑖𝑗, 𝑞𝑙𝑗) is if the 𝑙th attribute is a categorical attribute. Where 𝛿 𝑝, 𝑞 = 0 for 𝑝 = 𝑞, and
𝛿 𝑝, 𝑞 = 1 for 𝑝 ≠ 𝑞. The weight of categorical attributes in the cluster 𝑙 is 𝜇𝑙. If 𝑥𝑖𝑗 is a numeric attribute value, 𝑞𝑖𝑗 is the mean of the number attribute 𝑗th in the 𝑙 cluster. If 𝑥𝑖𝑗 is a categorical attribute value, 𝑞𝑖𝑗 is the mode of the number attribute 𝑗th in the 𝑙 cluster.
The process of k-prototype algorithm can be defined as below [22]:
1) Randomly pick k data objects as the initial cluster samples from the dataset.
2) Assign it to the cluster whose prototype is the nearest one to this data object for each data object in X. Update the cluster prototype after each assignment.
3) Recalculate the similarity of data objects to current prototypes after assigning all data objects to a cluster. If a data object is found that its nearest prototype belongs to another cluster rather than the current one, reassign that data object to that cluster and update both cluster prototypes.
4) If no data objects have changed clusters after a full circle test of X, end the algorithm; if there is a data object that changed cluster, repeat the third step.
IV. RESULTANDANALYSIS
These results can provide representation and summary on how the teenagers are grouped according to their survey response by clustering the data. The clusters will create a profile that will determine their habits on internet access, social media, and texting.
Since algorithms for clustering do not always have a general way of determining the number of clusters, the dataset will be grouped into 4, 5, and 6 clusters and each of the clustering results will be compared in order to find the best results that shows patterns and separability.
After executing the clustering process, it is apparent that grouping the data into 4 clusters shows the best result with interesting patterns and separability. While grouping into 5 clusters shows that most of the data are grouped only in one cluster, the result does not yield a pattern and not much can be learned from it. Grouping into 6 clusters creates the same pattern problem as before, with the difference that the data is evenly spread across each cluster, leaving so little to analyze. Therefore, the 4 clusters result will be discussed in this section.
Table 3 shows the number of male/females on the dataset and on each cluster. In the table it is apparent that cluster 3 have the highest number, followed by cluster 1, cluster 2, and cluster 4 respectively.
Table 3: Male-Female Percentage on clusters Clust
er
M
ale Male % Female Female %
Tot
al %
1 51 40% 77 60% 128 21%
2 36 39% 57 61% 93 15%
3 17
0 52% 157 48% 327 53%
4 28 44% 36 56% 64 10%
Tota l
28
Fig. 2. Social media usage on each clusters.
[image:4.595.109.500.307.540.2]Fig. 3. Internet usage on each clusters.
Figure 2 shows the usage of Social media on each cluster, and majority of the teenager in cluster 1, 2, and 4 uses social media every day while those who never use it get grouped on cluster 3. Figure 3 shows that in more than half of each cluster, the teenagers accessed the internet several times a day. The high numbers also present on cluster 3, which means by frequently accessing internet doesn’t necessarily mean that they are also a social media user.
Table 4: Computer ownerships. Cluster Yes No Total
1 80% 20% 21%
2 81% 19% 15%
3 79% 21% 53%
4 78% 22% 10%
Total 80% 20% 100%
80% of the teenagers uses a computer, as shown in Table 4. The result is the same in every cluster, around 78-80% responded with yes, and that leaves the rest that responded with no.
Table 5: Smartphone ownerships. Cluster Yes No Don't
Know Total
1 34% 51% 16% 21%
2 48% 41% 11% 15%
3 28% 61% 11% 53%
4 49% 46% 5% 11%
[image:4.595.324.562.632.834.2] [image:4.595.81.256.679.778.2]Table 5 shows that in cluster 3, 61% of the teenagers do not have their own smartphone. This could be a correlation on why most of them in cluster 3 is not a social media user, as stated before.
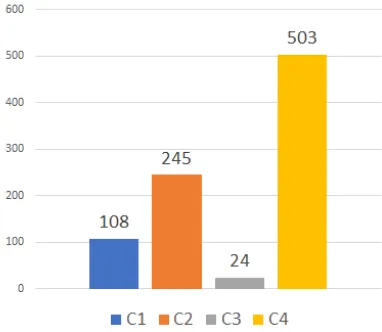
Fig. 4. Average of texts sent and received per day.
Figure 4 shows the average of text sent and received per day by each cluster. The figure shows that the fourth cluster is where all the teenagers that on average send and receive 500 text messages per day is grouped. Cluster 4 have the highest number of texts sent and received on average, followed by cluster 2, cluster 1, and lastly, cluster 3.
Using all these results, a profile can be determined for each of the clusters. Each cluster that was created will be named with the content that best represents them accordingly. For each cluster, descriptions are as follows:
1) First cluster; It contains 21% of the dataset, 60% of which is female. Most of which are in this cluster access the internet several times a day, and every day they use social media. Half of them do not own a smartphone, and the teenagers that got grouped here send and receive approximately 60-100 text messages a day.
2) Second cluster; Contains 15% of the dataset, 61% of which is female. Several times a day, more than half of them accessed the Internet. Every day, about 47 percent of the teenagers here use social media. Half of the teenager in this cluster own a smartphone. The ones that get grouped in this cluster send and receive approximately 200-300 text messages a day.
3) Third cluster; Includes most data from the dataset (53%), 52% of which is male. Several times a day, 62 percent of them accessed the internet. 29% of teenagers in this cluster say they never use social media, and more than 61% do not have a smartphone. This fact correlates with how much text they send and receive. The teenagers included in this cluster send and receive approximately 0-50 text messages a day.
4) Fourth cluster; contains 10% of the dataset, 44% of it are male. Majority of them accessed the internet several time a day. Around 25% of the teenagers grouped here use at least once a week. 49% of this cluster own a smartphone. The ones that included in this cluster send and receive around 400-500 text messages per day.
V. CONCLUSION
By using the k-prototypes algorithm to cluster a survey data
that contains eight features into a cluster of 4, 5, and 6, a result is obtained and it shows that using 4 clusters produces a better result with interesting patterns and separability compared to the other two.
In this study, behavioral data that contains mixed numeric and categorical attributes are clustered using the k-prototypes algorithm. The clustering results are used to create a profile to identify the teenagers’ interests regarding certain topics, in this case about internet usage, social media, and texting. The 4th cluster, for example, contains teenagers who text a lot of messages, making them a good target for smartphone advertising.
This proves that clustering is a practical method for defining a customer profile in a customer segmentation with the objective of making a better-targeted ad for an advertisers’ target market.
REFERENCES
1. A. Lenhart, “Mobile access shifts social media use and other online activities,” Teens, Social Media & Technology Overview, 2015.
[Online]. Available:
http://www.pewinternet.org/2015/04/09/mobile-access-shifts-social-m edia-use-and-other-online-activities/.
2. E. Wright, N. M. Khanfar, C. Harrington, and L. E. Kizer, “The Lasting Effects Of Social Media Trends On Advertising,” J. Bus. Econ. Res., vol. 14, no. 3, pp. 75–82, 2016.
3. A. Farahat, “How effective is targeted advertising?,” Proc. Am. Control Conf., pp. 6014–6021, 2013.
4. Y. K. Dwivedi, K. K. Kapoor, and H. Chen, “Social media marketing and advertising,” Mark. Rev., vol. 15, no. 3, pp. 289–309, Oct. 2015. 5. D. S. Rajagopal, “Customer Data Clustering using Data Mining
Technique,” Int. J. Database Manag. Syst., vol. 3, no. 4, Dec. 2011. 6. C. A. Summers, R. W. Smith, and R. W. Reczek, “An audience of one:
Behaviorally targeted ads as implied social labels,” J. Consum. Res., vol. 43, no. 1, pp. 156–178, 2016.
7. J. Yan, N. Liu, G. Wang, W. Zhang, Y. Jiang, and Z. Chen, “How much can Behavioral Targeting help online advertising?,” WWW’09 - Proc. 18th Int. World Wide Web Conf., pp. 261–270, 2009.
8. B. Ur, P. G. Leon, L. F. Cranor, R. Shay, and Y. Wang, “Smart, useful, scary, creepy: Perceptions of online behavioral advertising,” SOUPS 2012 - Proc. 8th Symp. Usable Priv. Secur., vol. 2012, 2012. 9. G. Chicco, R. Napoli, and F. Piglione, “Comparisons among clustering
techniques for electricity customer classification,” IEEE Trans. Power Syst., vol. 21, no. 2, pp. 933–940, 2006.
10. D. Zakrzewska and J. Murlewski, “Clustering algorithms for bank customer segmentation,” Proc. - 5th Int. Conf. Intell. Syst. Des. Appl. 2005, ISDA ’05, vol. 2005, pp. 197–202, 2005.
11. R. Sifa, A. Drachen, and C. Bauckhage, “Large-scale cross-game player behavior analysis on steam,” Proc. 11th AAAI Conf. Artif. Intell. Interact. Digit. Entertain. AIIDE 2015, vol. 2015-Novem, pp. 198–204, 2015.
12. Z. Huang, “Extensions to the k-means algorithm for clustering large data sets with categorical values,” Data Min. Knowl. Discov., vol. 2, no. 3, pp. 283–304, 1998.
13. P. Awasthi, M. Charikar, R. Krishnaswamy, and A. K. Sinop, “The Hardness of Approximation of Euclidean κ-Means,” Leibniz Int. Proc. Informatics, LIPIcs, vol. 34, pp. 754–767, 2015.
14. A. K. Jain, “Data clustering: 50 years beyond K-means,” Pattern Recognit. Lett., vol. 31, no. 8, pp. 651–666, 2010.
15. C. Slamet, A. Rahman, M. A. Ramdhani, and W. Dharmalaksana, “Clustering the verses of the holy qur’an using K-means algorithm,” Asian J. Inf. Technol., vol. 15, no. 24, pp. 5159–5162, 2016. 16. G. Gan and M. K. P. Ng, “K-Means Clustering With Outlier Removal,”
Pattern Recognit. Lett., vol. 90, pp. 8–14, 2017.
17. F. Jiang, G. Liu, J. Du, and Y. Sui, “Initialization of K-modes clustering using outlier detection techniques,” Inf. Sci. (Ny)., vol. 332, pp. 167–183, 2016.
Author-1 Photo
Author-3 Photo
Author-4 Photo
19. Q. Duan, Y. L. Yang, and Y. Li, “Rough K-modes clustering algorithm based on entropy,” IAENG Int. J. Comput. Sci., vol. 44, no. 1, pp. 13–18, 2017.
20. R. S. Sangam and H. Om, “An equi-biased k-prototypes algorithm for clustering mixed-type data,” Sadhana - Acad. Proc. Eng. Sci., vol. 43, no. 3, pp. 1–12, 2018.
21. J. Li, X. Gao, and L. C. Jiao, “A GA-based clustering algorithm for large data sets with mixed and categorical values,” Proc. - 5th Int. Conf. Comput. Intell. Multimed. Appl. ICCIMA 2003, pp. 102–107, 2003.
22. J. Ji, T. Bai, C. Zhou, C. Ma, and Z. Wang, “An improved k-prototypes clustering algorithm for mixed numeric and categorical data,” Neurocomputing, vol. 120, pp. 590–596, 2013.
23. P. Arora, Deepali, and S. Varshney, “Analysis of K-Means and K-Medoids Algorithm for Big Data,” Phys. Procedia, vol. 78, no. December 2015, pp. 507–512, 2016.
AUTHORSPROFILE
Kiefer Stefano Ranti is a magister student of Information Technology at Bina Nusantara University, Jakarta, Indonesia
Kelvin Salim is a magister student of Information Technology at Bina Nusantara University, Jakarta, Indonesia.
Andary Dadang Yuliyono is a magister student of Information Technology at Bina Nusantara University, Jakarta, Indonesia.