Browsing Large Scale Cheminformatics Data with Dimension Reduction
Jong Youl Choi, Seung-Hee Bae, Judy Qiu School of Informatics and Computing
Pervasive Technology Institute Indiana University Bloomington IN, 47408, USA
{jychoi,sebae,xqiu}@indiana.edu
Bin Chen, David Wild
School of Informatics and Computing Indiana University
Bloomington IN, 47408, USA
{binchen,djwild}@indiana.edu
Abstract
Visualization of large-scale high dimensional data is highly valuable for data analysis facilitating scientific discovery in many fields. We present PubChemBrowse, a customized visualization tool for cheminformatics research. It provides a novel 3D data point browser that displays complex properties of massive data on commodity clients. As in GIS browsers for Earth and Environment data, chemical compounds with similar properties are nearby in the browser. PubChemBrowse is built around in-house high performance parallel MDS (Multi-Dimensional Scaling) and GTM (Generative Topographic Mapping) services and supports fast interaction with an external property database. These properties can be overlaid on 3D mapped compound space or queried for individual points. We prototype the integration with Chem2Bio2RDF system using SPARQL endpoint to access over 20 publicly accessible bioinformatics databases. We describe our design and implementation of the integrated PubChemBrowse application and outline its use in drug discovery. The same core technologies are generally applicable to develop high performance scientific data browsing systems for other applications.
1. Introduction
The scale of public scientific data generated by new techniques makes data utilization really challenging. Volumes of PubChem1 data in cheminformatics, for example, need to be visualized towards the end of capture, curation, and analysis pipeline to support interactive studies. However, because browsing tens of millions of intrinsically high-dimensional PubChem data in one platform is not easy due to the high dimensionality and large volumes of data, we have developed a 3D data point visualization tool for drug discovery, named PubChemBrowse, to display chemical structures with various properties such as relationships among chemical, gene, and disease established through querying Chem2Bio2RDF system [1], which we shall discuss shortly.
We are applying parallel Multidimensional Scaling (MDS) and Generative Topographic Mapping (GTM) algorithms to reduce 166 structural descriptors (known as MACCS keys) of around 60 million chemical compounds in PubChem into three, aiming at providing three-dimensional graphical plot representations of the structural diversity of nearly all of the known public compounds [2, 3]. By labeling these plots with the properties of compounds, ranging from simple properties like molecular
1
weights to complex properties such as chemical-disease relationships established through querying Chem2Bio2RDF system, we can investigate the overall properties of regions of chemical space inhabited by PubChem compounds, as well as embed new compounds into this framework.
In section 2, we give a brief overview of related work and our high performance parallel dimension reduction technologies including MDS and GTM and relational biochemical repository framework – Chem2Bio2RDF and its SPARQL query interface. Section 3 presents details of our design and implementation of an integrated system PubChemBrowse that plots a 3D scattered distribution of PubChem compounds, as well as embed new compounds retrieved in real time with various labeling capabilities. Several case studies are given in section 4 with a data set of up to 930,000 data points followed by a summary of our work and future improvements.
2. Data visualization and remote data access
Large scale data visualization is an active research area in many fields of science: The Sloan Digital Sky Survey (SDSS) project [4] for astronomy, UCSC [5] and Ensemble [6] for genomics, and Google Earth for geology. Although designed with different technologies, they share one common concept: users need only a lightweight client but can access huge data that are curated and processed through intensive computation. We have used a multi-stage pipeline model to explore natural data parallelism for large-scale scientific problems. This has been demonstrated in our biological gene sequencing application from data acquisition, analysis, reduction and aggregation for visualization and implemented with both classic HPC and Cloud technologies [7]. We are taking a similar approach for the cheminformatics research, assisting drug discovery from large dataset.
In the field of modern drug discovery aiming at mining cause-and-effect relationships among chemicals, genes and diseases from a large number of data sources, using various kinds of public databases, such as PubChem for chemical compounds and structures, Comparative Toxicogenomics Database (CTD) for chemical gene information, DrugBank database for drug target association to name a few, is an interesting researching topic and high-dimensional data visualization is gaining more importance in understanding complex datasets. It is worth mentioning that D. M. Maniyar et al. [8] have introduced the use of data visualization for drug discovery and their visualization tool. We present the same type of tool for drug discovery but we integrate our system with more cutting-edge technologies: high-performance visualization algorithms based on HPC and Cloud environments, large data access by using semantic web technologies, and a lightweight 3D visualization client.
More specifically, such process typically involves three main tasks: i) visualizing multi-dimensional PubChem data in 3D space, ii) finding relationships by using various public databases, such as genes-compounds and/or diseases-compounds, and assigning labels to chemical compounds, and iii) displaying labels by using different colors or symbols in the previous 3D visualization and exploring the results. The last two steps can be repeated until we have meaningful discovery.
Issues in dealing with various types of databases in drug discovery are that databases are often too big to store in local storage and it is hard to maintain consistency with the original datasets if there are frequent updates. Other issues can arise due to non-uniform data structures. Typically those databases are not compatible to each other so that elaborated work needs to be done to use them together. To overcome such problems, Chem2Bio2RDF system has been developed as an integrated repository of chemogenomic and systems chemical biology data [1]. Chem2Bio2RDF aggregates over 20 publicly accessible databases in Resource Description Framework (RDF) format and allows users to access them by using SPARQL which is a standard query language for RDF data and is a part of semantic web technology. PubChemBrowse can interact with Chem2Bio2RDF system remotely by using SPARQL query to access various databases and large number of properties in an online and uniform way.
2.1. Data visualization algorithms
Among many dimension reduction algorithms, we focus on MDS [9, 10] and GTM [11] due to their popularity and theoretical strength. Although both GTM and SOM share the same objective which is to find an optimal mapping or embedding in low-dimensional space out of the data in high-dimensional space, GTM, however, finds a mapping based on probability density model, which SOM lacks of. On the other hand, MDS tries to construct a mapping in target dimension with respect to the pairwise proximity information, mostly dissimilarity or distance [2]. The details of those algorithms are beyond the scope of this paper. Users are encouraged to refer to the original papers [9-11] and our previous work [2, 3]. In the following, we briefly describe the algorithms which we used for visualization in PubChemBrowse.
MDS : This is a general term of the techniques to configure low dimensional mappings of the given high-dimensional data with respect to the pairwise proximity information, while the pairwise Euclidean distance within the target dimension between two points is approximated to the corresponding original proximity value. In other words, MDS is a non-linear optimization problem with respect to the mapping in the target dimension and the original proximity information. The STRESS [12] value is a well-known objective function of MDS, and Eq (1) represents STRESS function (σ):
(1)
where wij is weight for distance between point i (xi) and j (xj), dij(X) represents mapping distance
between xi and xj, δij represents the given original pairwise dissimilarity value between xi and xj, and X denotes current low dimensional mapping set.
Among many MDS solutions, we use SMACOF algorithm which is based on Expectation Maximization (EM)-like iterative majorization method. For details of the SMACOF algorithm, please refer to [13].
principled alternative to Self-Organizing Map (SOM) which does not have any density model. In a nutshell, GTM aims at maximizing the following objective function:
(2)
where yk is a prototype point in the data space mapped by a non-linear function f with respect to a latent point zk in the target space and a parameter set W such that yk=f(zk, W), xn represents a data point in the data space, and N(x|y,b) denotes an isotropic Gaussian probability of x centered on y
with variance b.
MDS and GTM Interpolation : Both are extensions to the original MDS and GTM algorithms, designed to process much larger data sets with sampling approaches. In short, we compute the mapping based on n samples out of total N data points followed by interpolating the embedding of the remaining (N-n) out-of-sample data, which allows us to save computational time. Furthermore, we can build this approach as a pleasingly parallel application [3]. With minor trade-off of approximation, the interpolation approach for MDS and GTM can compute mappings of millions of data points with modest amount of computations and memory requirement. In [3], up to 2 million PubChem data points has been visualized by using parallelized MDS and GTM interpolation algorithms.
2.2. Remote Data Access
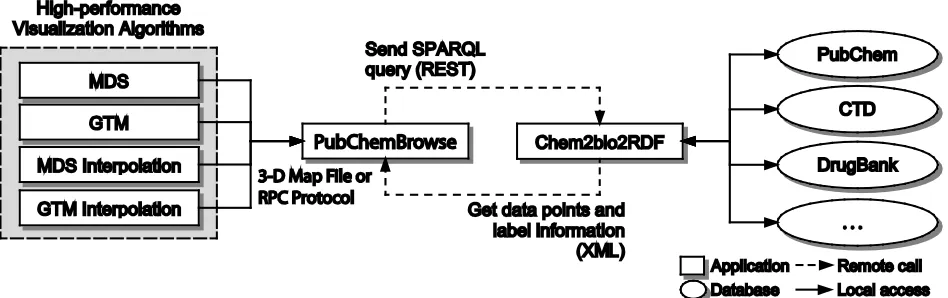
[image:4.612.71.545.451.600.2]We can take an advantage of Chem2Bio2RDF system for accessing multiple data sources in an online manner by sending SPARQL query and fetching results in RDF format. In this way, users can visualize data with more information-rich contexts that combine with other data sources.
3. The PubChemBrowse system
We have developed PubChemBrowse that can visualize 3D data output from high-performance visualization algorithms, as well as interact with external data sources via Chem2Bio2RDF system in order to provide rich and on-line information by utilizing semantic web interfaces.
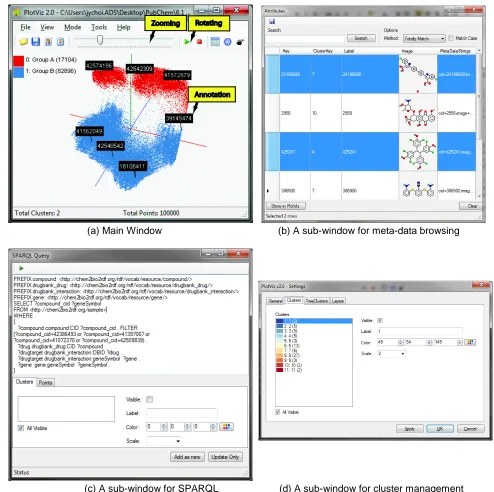
Figure 1 illustrates our PubChemBrowse architecture. It consists of mainly 3 components: i) high-performance visualization algorithms, such as parallel MDS and GTM, which generate 3D maps for (a) Main Window (b) A sub-window for meta-data browsing
[image:5.612.52.546.69.561.2](c) A sub-window for SPARQL (d) A sub-window for cluster management
large and high-dimensional data by utilizing parallel clustering infrastructure [2, 3], ii) an user-friendly 3D data browser which supports 3D interactions including rotation, panning and zooming and displays annotations and meta-data, and iii) SPARQL query interface which allows users to access the remote data repository Chem2Bio2RDF in order to augment new data points or update existing information in an on-line manner. More details of each component are as follows:
High-performance visualization algorithms : Currently PubChemBrowse can visualize the outputs from our in-house parallel implementations of 4 main dimension reduction algorithms: MDS, GTM, MDS interpolation, and GTM interpolation. All of them can run in high-throughput clustering infrastructure by maximally utilizing multi-core environments. Mostly those algorithms run in a batch mode but interpolation algorithms can run in an online mode too.
3D data browser : As shown in Figure 2 (a) and (b), one can visualize 3D data points and browse them in various ways: rotating, zooming, and viewing meta-data including chemical structures available from PubChem database.
SPARQL query : As shown in Figure 2 (c), our system has an interface for users to compose SPARQL query and send to Chem2Bio2RDF system remotely by using REST which is one of standard web service protocols. Then, the Chem2Bio2RDF system will process the query and return back results in XML format. Our system will parse the XML information and update or overlay the results in user's working plot.
4. Applications
We have been using PubChemBrowse in various cheminformatics data mining research projects aiming at exploring and discovering compound-gene-disease relationships from a large number of datasets. In the following we will show examples of usages of our system in those projects.
[image:6.612.66.551.462.676.2]
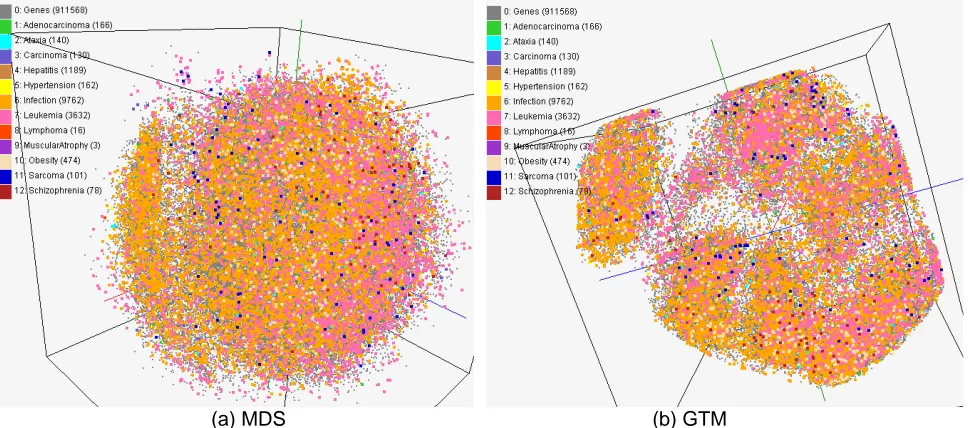
(a) MDS (b) GTM
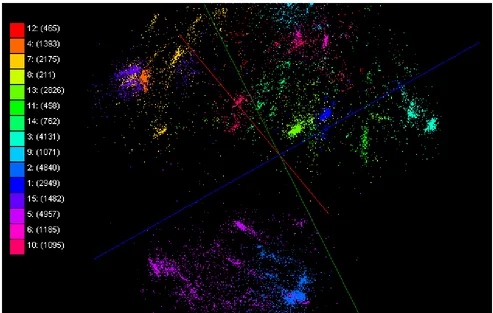
Figure 3. Visualization of chemical-disease relationships based on the data in Comparative Toxicogenomics Database (CTD). About 930,000 chemical compounds are visualized as points in 3D
CTD data for chemical and disease relations: The environment plays an important role in the etiology of many human diseases and chemicals are one component of environment. However, the relation between chemicals and diseases are poorly known [14]. As a part of a research process to find cause-and-effect correlation between chemical compounds and diseases by using public databases, we visualized about 930,000 biologically interesting compounds as points in a 3D space by using our system. Figure 3 shows an example of usages of PubChemBrowse in this study for finding potential correlations. More specifically, we computed X-Y-Z positions processed by either MDS (a) or GTM (b) by using MACCS keys, so that the distance between any two points in the 3D plot reflects structural similarities of two compounds. On top of this bare map which has no additional information except positions, we overlaid disease information mined from CTD with different colors as labels by using SPARQL queries to Chem2Bio2RDF system.
The relation between diseases based on their associated chemicals could be observed from the visualization. It is not surprising that the disease chemicals in Figure 3 are scattered in the chemical spaces instead of being clustered in a particular area, as chemicals have a variety of ways to cause disease via directly or indirectly interacting with disease related genes and their structures are not necessarily similar.
[image:7.612.69.549.318.569.2]
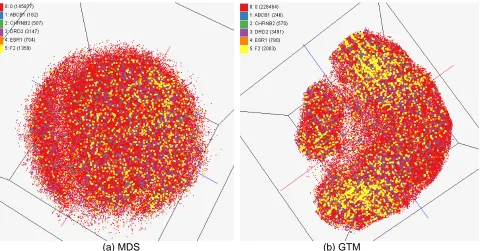
(a) MDS (b) GTM
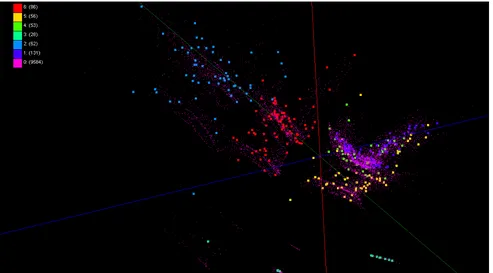
Figure 4. Visualization of target relations by using multiple data sources in Chem2Bio2RDF. About 234,000 points are visualized in 3D space. Each point represents a chemical compound in PubChem
database and its configuration is computed by using MDS (a) and GTM (b).
differences of chemicals between different targets. Chemicals with similar structures are prone to interact with same targets. The study of relations between targets based on their active compounds could act as a complementary tool to study biological function [16]. These differences could be observed from our system, in which all the compounds are projected into 3D space based on their structural similarity and they are labeled (or colored) either by their original data databases or by their targets that would be retrieved via SPARQL.
Figure 4 shows an example to study the target relations. We visualized 234,000 chemical compounds reported in major journal literature as compounds possibly related to one of 5 targets (ABCB1, CHRNB2, DRD2, ESR1, and F2). Positions of compounds are computed by MDS (a) or GTM (b) with the same method used in the previous work and colors are assigned based on their targets retrieved remotely through Chem2Bio2RDF system.
[image:8.612.73.541.265.462.2]
(a) MDS (b) GTM
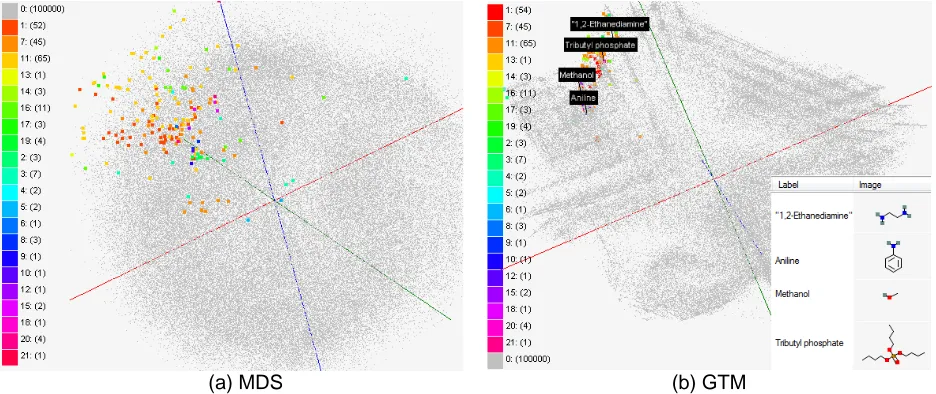
Figure 5. MDS (a) and GTM (b) visualization of 215 solvents (colored and/or labeled) with 100k PubChem dataset (colored in grey) to navigate chemical space. Users can see images of compound
sturctures in PubChemBrowse. 4 structures of solvents are shown as an example.
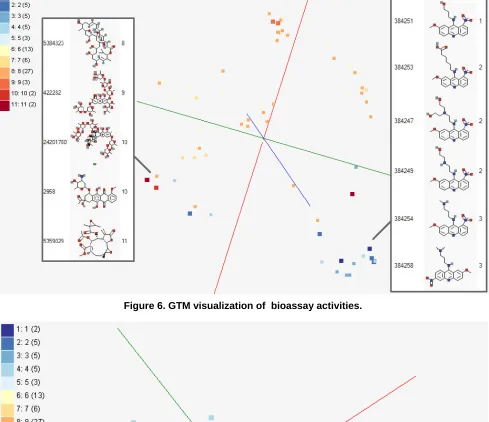
Figure 6. GTM visualization of bioassay activities.
Activity Cliffs : This is a research project to study activity cliffs with SALI index [19] for applications in polypharmacology and chemogenomics. In this study, visualization of bioassay activities and SALI values in 3D chemical space is necessary. Figure 6 shows a visualization example of bioassay activities of 73 chemical compounds in 3D chemical space by using MACCS keys, processed by GTM. Figure 7 depicts the MDS result showing 3D SALI space, based on pairwise SALI indices. Note that SALI space mapping can be only generated by MDS. Unlike GTM, MDS can generate a mapping based on pairwise proximity information.
[image:10.612.61.554.374.647.2]Other Life Science Applications : Although PubChemBrowse is mainly developed to provide special functions for cheminformatics applications, it can process and visualize various other life science datasets. As examples, we present two life science applications. One is the visualization of health data to study child obesity by using the PubChemBrowse system. The dataset consists of children's health-related features, such as Body Mass Index (BMI), blood pressures, and so on, as well as environmental factors, like greenness of neighborhoods, incomes of households, etc. We prepare a pairwise dissimilarity matrix of 10 thousand points based on 98 features as an input and generate a 3D mapping constructed by MDS as shown in Figure 8. Another example is the visualization of biological sequence data. We produce a 3D mapping of 30 thousand metagenomics sequence data based on the pairwise sequence alignment scores measured by a well-known sequence alignment algorithm called Smith-Watermann [20]. Figure 9 shows the 3D mapping result of 30 thousand sequence data for the metagenomics study, also configured by MDS algorithm.
Figure 9. A 3D mapping result of the 30 thousand metagenomics sequences.
5. Conclusion
In this paper we discuss our design and implementation of PubChemBrowse, an integrated 3D data point visualization tool customized for browsing massive cheminformatics data. PubChemBrowse is designed to utilize our in-house high-performance visualization algorithms and be able to interact with external Chem2Bio2RDF system by using SPARQL to overlay information available from publicly accessible multiple bioinformatics databases. Further, we can embed new points and label various bioinformatics related datasets to assist on-going data mining research projects for drug-discovery.
6. Acknowledgement
We appreciate Microsoft for their technical support. This work was made possible using the computing use grant provided by Amazon Web Services which is titled "Proof of concepts linking FutureGrid users to AWS". This work is partially funded by Microsoft "CRMC" grant and NIH Grant Number RC2HG005806-02. This document was developed with support from the National Science Foundation (NSF) under Grant No. 0910812 to Indiana University for "FutureGrid: An Experimental, High-Performance Grid Test-bed." Any opinions, findings, and conclusions or recommendations expressed in this material are those of the author(s) and do not necessarily reflect the views of the NSF.
7. References
[1] B. Chen, et al., "Chem2Bio2RDF: a semantic framework for linking and data mining chemogenomic and systems chemical biology data," BMC Bioinformatics, vol. 11, p. 255, 2010.
[2] J. Y. Choi, et al., "High Performance Dimension Reduction and Visualization for Large High-dimensional Data Analysis," presented at the The 10th IEEE/ACM International Symposium on Cluster, Cloud and Grid Computing (CCGrid2010), Melbourne, Australia, 2010.
[3] S.-H. Bae, et al., "Dimension Reduction and Visualization of Large High-dimensional Data via Interpolation," presented at the HPDC'10, Chicago, Illinois USA, 2010.
[4] D. G. York, et al., "The Sloan Digital Sky Survey: Technical summary," Astronomical Journal, vol. 120, pp. 1579-1587, Sep 2000.
[5] R. M. Kuhn, et al., "The UCSC Genome Browser Database: update 2009," Nucleic Acids Research, vol. 37, pp. D755-D761, Jan 2009.
[6] T. Hubbard, et al., "The Ensembl genome database project," Nucleic Acids Research, vol. 30, pp. 38-41, Jan 1 2002. [7] J. Qiu, et al., "Data Intensive Computing for Bioinformatics," Technical Report, December 29 2009.
[8] D. M. Maniyar, et al., "Data visualization during the early stages of drug discovery," Journal of Chemical Information and Modeling, vol. 46, pp. 1806-1818, Jul 24 2006.
[9] J. B. Kruskal and M. Wish, Multidimensional Scaling: Sage Publications Inc., 1978.
[10] I. Borg and P. J. Groenen, Modern Multidimensional Scaling: Theory and Applications: Springer, 2005. [11] C. M. Bishop and M. Svensén, "GTM: A principled alternative to the self-organizing map," Advances in Neural
Information Processing Systems, pp. 354--360, 1997.
[12] J. B. Kruskal, "Multidimensional scaling by optimizing goodness of fit to a nonmetric hypothesis," Psychometrika,
vol. 29, pp. 1-27, 1964.
[13] J. de Leeuw, "Applications of convex analysis to multidimensional scaling," Recent Developments in Statistics, pp. 133-145, 1977.
[14] C. M. McHale, et al., "Toxicogenomic profiling of chemically exposed humans in risk assessment," Mutation Research-Reviews in Mutation Research, vol. 705, pp. 172-183, Dec 2010.
[15] C. Southan, et al., "Quantitative assessment of the expanding complementarity between public and commercial databases of bioactive compounds," Journal of cheminformatics, vol. 1, pp. 1 -- 17, 2009.
[16] M. J. Keiser, et al., "Relating protein pharmacology by ligand chemistry," Nature Biotechnology, vol. 25, pp. 197-206, Feb 2007.
[17] C. Lipinski and A. Hopkins, "Navigating chemical space for biology and medicine," Nature, vol. 432, pp. 855-861, Dec 16 2004.
[18] M. Alleso, et al., "Solvent diversity in polymorph screening," Journal of Pharmaceutical Sciences, vol. 97, pp. 2145-2159, Jun 2008.
[19] R. Guha and J. H. Van Drie, "Structure-activity landscape index: Identifying and quantifying activity cliffs,"
Journal of Chemical Information and Modeling, vol. 48, pp. 646-658, Mar 2008.