InTrans Project Reports Institute for Transportation
6-2008
Feasibility of Visualization and Simulation
Applications to Improve Work Zone Safety and
Mobility
Manop Kaewmoracharoen
Iowa State University, [email protected] Kelly Strong
Iowa State University, [email protected]
Follow this and additional works at:http://lib.dr.iastate.edu/intrans_reports
Part of theCivil Engineering Commons
This Report is brought to you for free and open access by the Institute for Transportation at Iowa State University Digital Repository. It has been accepted for inclusion in InTrans Project Reports by an authorized administrator of Iowa State University Digital Repository. For more information, please [email protected].
Recommended Citation
Kaewmoracharoen, Manop and Strong, Kelly, "Feasibility of Visualization and Simulation Applications to Improve Work Zone Safety and Mobility" (2008).InTrans Project Reports. 180.
Feasibility of Visualization and Simulation Applications to Improve Work
Zone Safety and Mobility
Abstract
Visualization is a relatively recent tool available to engineers for enhancing transportation project design through improved communication, decision making, and stakeholder feedback. Current visualization techniques include image composites, video composites, 2D drawings, drive-through or fly-through animations, 3D rendering models, virtual reality, and 4D CAD. These methods are used mainly to
communicate within the design and construction team and between the team and external stakeholders. Use of visualization improves understanding of design intent and project concepts and facilitates effective decision making. However, visualization tools are typically used for presentation only in large-scale urban projects. Visualization is not widely accepted due to a lack of demonstrated engineering benefits for typical agency projects, such as small- and medium-sized projects, rural projects, and projects where external stakeholder communication is not a major issue. Furthermore, there is a perceived high cost of investment of both financial and human capital in adopting visualization tools. The most advanced visualization technique of virtual reality has only been used in academic research settings, and 4D CAD has been used on a very limited basis for highly complicated specialty projects. However, there are a number of less intensive visualization methods available which may provide some benefit to many agency projects. In this paper, we present the results of a feasibility study examining the use of visualization and simulation applications for improving highway planning, design, construction, and safety and mobility.
Keywords
Feasibility analysis, Project management, Simulation, Visualization, Work zone safety, Work zone traffic control, 4D CAD, Scheduling
Disciplines
Civil Engineering
Comments
For this and other reports from InTrans and the Smart Work Zone Deployment Initiative please go to http://www.intrans.iastate.edu/smartwz/projects/details.cfm?projectID=70
Feasibility of Visualization and
Simulation Applications to Improve
Work Zone Safety and Mobility
Final Report
June 2008
Sponsored by
the Smart Work Zone Deployment Initiative
a Federal Highway Administration pooled fund study and
the Iowa Department of Transportation (CTRE Project 07-300)
About CTRE
The mission of the Center for Transportation Research and Education (CTRE) at Iowa State University is to develop and implement innovative methods, materials, and technologies for improving transportation efficiency, safety, and reliability while improving the learning environment of students, faculty, and staff in transportation-related fields.
Disclaimer Notice
The contents of this report reflect the views of the authors, who are responsible for the facts and the accuracy of the information presented herein. The opinions, findings and conclusions expressed in this publication are those of the authors and not necessarily those of the sponsors.
The sponsors assume no liability for the contents or use of the information contained in this document. This report does not constitute a standard, specification, or regulation.
The sponsors do not endorse products or manufacturers. Trademarks or manufacturers’ names appear in this report only because they are considered essential to the objective of the document.
Non-discrimination Statement
Technical Report Documentation Page
1. Report No. 2. Government Accession No. 3. Recipient’s Catalog No.
CTRE Project 07-300
4. Title and Subtitle 5. Report Date
June 2008
6. Performing Organization Code
Feasibility of Visualization and Simulation Applications to Improve Work Zone Safety and Mobility
7. Author(s) 8. Performing Organization Report No.
Manop Kaewmoracharoen and Kelly Strong
9. Performing Organization Name and Address 10. Work Unit No. (TRAIS) 11. Contract or Grant No.
Center for Transportation Research and Education Iowa State University
2711 South Loop Drive, Suite 4700 Ames, IA 50010-8664
12. Sponsoring Organization Name and Address 13. Type of Report and Period Covered
Final Report
14. Sponsoring Agency Code
Iowa Department of Transportation 800 Lincoln Way
Ames, IA 50010
15. Supplementary Notes
Visit www.ctre.iastate.edu for color PDF files of this and other research reports.
16. Abstract
Visualization is a relatively recent tool available to engineers for enhancing transportation project design through improved communication, decision making, and stakeholder feedback. Current visualization techniques include image composites, video composites, 2D drawings, drive-through or fly-through animations, 3D rendering models, virtual reality, and 4D CAD. These methods are used mainly to communicate within the design and construction team and between the team and external stakeholders. Use of visualization improves understanding of design intent and project concepts and facilitates effective decision making. However, visualization tools are typically used for presentation only in large-scale urban projects. Visualization is not widely accepted due to a lack of demonstrated engineering benefits for typical agency projects, such as small- and medium-sized projects, rural projects, and projects where external stakeholder communication is not a major issue. Furthermore, there is a perceived high cost of investment of both financial and human capital in adopting visualization tools. The most advanced visualization technique of virtual reality has only been used in academic research settings, and 4D CAD has been used on a very limited basis for highly complicated specialty projects. However, there are a number of less intensive visualization methods available which may provide some benefit to many agency projects. In this paper, we present the results of a feasibility study examining the use of visualization and simulation applications for improving highway planning, design, construction, and safety and mobility.
17. Key Words 18. Distribution Statement
4D CAD—scheduling—traffic work zone—visualization No restrictions.
19. Security Classification (of this report)
20. Security Classification (of this page)
21. No. of Pages 22. Price
ii
F
EASIBILITY OF
V
ISUALIZATION AND
S
IMULATION
A
PPLICATIONS TO
I
MPROVE
W
ORK
Z
ONE
S
AFETY AND
M
OBILITY
Final Report May 2008
Principal Investigator Kelly Strong Associate Professor
Civil, Construction, and Environmental Engineering Iowa State University
Co-Principal Investigators Charles Jahren Associate Professor
Civil, Construction, and Environmental Engineering Iowa State University
Ed Jaselskis Professor
Civil, Construction, and Environmental Engineering Iowa State University
Amr Kandil Associate Professor
Civil, Construction and Environmental Engineering Iowa State University
Research Assistant Manop Kaewmoracharoen
Authors
Manop Kaewmoracharoen and Kelly Strong
Sponsored by
The Smart Work Zone Deployment Initiative and the Iowa Department of Transportation
Preparation of this report was financed in part
through funds provided by the Iowa Department of Transportation through its research management agreement with the
Center for Transportation Research and Education. CTRE Project 07-300.
Center for Transportation Research and Education Iowa State University
2711 South Loop Drive, Suite 4700 Ames, IA 50010-8664
v
TABLE OF CONTENTS
Acknowledgments... ix
1. Introduction... 1
2. Literature Review and Existing Research Studies... 2
3. Methodology... 3
3.1 Project Study... 3
3.1.1 Project Site Analysis ... 4
3.2 Technology and Software Study... 4
3.3 Commercial 4D Packages... 4
3.3.1 JetStream... 4
3.3.2 ProjectWise ... 5
3.3.3 Project 4D ... 5
3.3.4 FourDscape ... 5
3.4 Adaptation of Software with 3D Environment ... 6
3.4.1 Adobe Acrobat 3D ... 6
3.4.2 Second Life ... 6
3.4.3 Google SketchUp and Google Earth... 6
3.4.4 Walkinside ... 7
3.5 Other Approaches ... 7
3.5.1 Handheld Device Animations ... 7
3.5.2 2D Overlay Images ... 7
3.6 Software Comparison ... 8
3.6.1 Data Requirements... 9
3.7 Focus Group... 9
3.8 Survey ... 10
3.8.1 Government and Non-government Agency (Contractors/Consultants)... 12
3.8.2 Individuals with More or Less Than 20 Years’ Experience ... 13
3.8.3 CAD Users and Non-users... 13
3.8.4 GIS Users and Non-users... 14
3.8.5 2D Drawing Users and Non-users of 2D Drawings... 14
3.8.6 Regular Users of Scheduling Software and Non-users... 15
vi
4.1 3D SketchUp Models... 16
4.1.1 Project-Specific Models... 17
4.1.2 3D Library Models... 19
4.2 Scheduling Data... 20
4.3 Models and Schedule Linkage... 21
4.4 Google Earth KML ... 22
4.5 Estimated Development Time ... 24
4.6 Deployment... 25
5. Summary and Recommendations ... 26
5.1 Summary... 26
5.2 Recommendations... 26
vii
LIST OF FIGURES
Figure 1. The location of the new bridge during stage 1 (looking west from the existing bridge) 3 Figure 2. Original ramp (left) and traffic image retouched (right) on southwest ramp merging
onto 24th Street...7
Figure 3. Traffic control for one-lane closure on divided highway...10
Figure 4. Traffic control for two-lane closure, head-to-head operation ...10
Figure 5. Traffic control for full closure with temporary detour via exit/entrance ramps...11
Figure 6. SketchUp proposed bridge model—Created on top of PDF/JPG drawing ...17
Figure 7. SketchUp wing wall model—converting from 2D outline into 3D model ...18
Figure 8. SketchUp wing wall model—without material (left) and with material (right)...18
Figure 9. SketchUp Models—safety fence in plain material (left) and transparent material (right)18 Figure 10. 3D library models–from left to right tabular marker, electronic sign, barricade, and flagger ...19
Figure 11. Library models setup illustrating work zone installation ...20
Figure 12. COLLADA file code example...20
Figure 13. Google Earth Simulation—displaying time navigation ...22
Figure 14. KML code—an example of TimeSpan tag...22
Figure 15. KML code—an example of a box-shaped polygon...23
Figure 16. A box-shaped polygon created from KML displayed in Google Earth ...23
Figure 17. KML code—an example of each model...24
Figure 18. Visualization of 24th Street Bridge northbound during stage 6—displayed in Google Earth...24
Figure 19. Rendered image of proposed 24th Street Bridge looking toward the west ...25
Figure 20. Rendered image of proposed 24th Street Bridge in bird's-eye view ...25
Figure C.1. Bird’s-eye view over the bridge—looking north from project start to finish...C-1 Figure C.2. Driver’s view at the south of the bridge—looking north from project start to finishC-1 Figure C.3. Bird’s-eye view over Interstate 29/80—looking west from project start to finish...C-1 Figure C.4. Bird’s-eye view over the bridge—different perspectives during stage 5 ...C-2 LIST OF TABLES Table 1. Comparison of Software ...8
Table 2. The average score of the survey results...12
Table 3. T-Test data of survey results between government and non-government...13
Table 4. T-Test data of survey results between people with more than 20 years experience and those with less than 20 years experience ...13
Table 5. T-Test data of survey result between CAD users and non-CAD users ...14
Table 6. T-Test data of survey result between GIS users and non-GIS users ...14
Table 7. T-Test data of survey results between 2D drawings users ...15
ix
ACKNOWLEDGMENTS
The authors would like to thank the Smart Work Zone Deployment Initiative (SWZDI) and the Iowa Department of Transportation (DOT) for their financial support of this research. In addition, the authors acknowledge the following individuals and organizations for their support and participation in this research project:
• Technical Advisory Committee members—Dan Sprengeler, Mark Bortle, Jeff Koudelka, Troy German, LaDon Jones, Willy Sorenson, Jerry Roche
• Iowa DOT 24th Street Project team members—Dave Skogerboe, Orest Lechnowsky (Resident Construction Engineer), Jim Nelson
• Iowa DOT Walkinside development team members—Kent Nicholson, Chad Hightshoe, Brandon Kimble
• HDR—Jennifer D. Crumbliss (Senior Transportation Engineer)
1
1. INTRODUCTION
Highway construction projects typically involve a large number of stakeholders with varying degrees of knowledge and experience regarding interpretation of design drawings. Although transportation project designs frequently do not have the spatial complexity of building construction, project complexity and stakeholder communication is often more of a challenge due to extensive public involvement. In addition, minimal delays in transportation projects can affect public interests drastically.
Visualization is a relatively recent tool available to engineers for enhancing transportation project design through improved communication, decision making, and stakeholder feedback. Current visualization techniques include image composites, video composites, 2D drawings, drive-through or fly-through animations, 3D rendering models, virtual reality, and 4D CAD. These methods are used mainly to communicate within the design and construction team and between the team and external stakeholders. Use of visualization improves understanding of design intent and project concepts and facilitates effective decision making. However, visualization tools are typically used for presentation only in large-scale urban projects. Visualization is not widely accepted due to a lack of demonstrated engineering benefits for typical agency projects, such as small- and medium-sized projects, rural projects, and projects where external stakeholder communication is not a major issue. Furthermore, there is a
2
2. LITERATURE REVIEW AND EXISTING RESEARCH STUDIES
Different visualization techniques used in transportation projects have been analyzed to identify cost and benefits in public projects (Bailey et al. 2002). Image composites have been used frequently to facilitate public involvement in the planning phase (Garrick et al. 2005). Highway work zones have been the subject of several recent research studies. Innovative practices and areas of improvement for work zones have been identified using industry surveys (Schrock et al. 2002). Intelligent Transportation Systems providing information to drivers before entering work zones showed effectiveness by reducing traffic congestion and improving safety (Fontaine 2003). Driving simulators using 3D models to replicate road signs, construction equipment, and wildlife have been used to study drivers’ behavior in a laboratory setting (Stanley 2006).
Accident and work zone database displays overlaid on state highway maps have proven useful in illustrating statistical data in a graphical format (Shi 2008).
4D CAD has demonstrated numerous benefits, especially in building and industrial construction (Fischer et al. 2003). 4D CAD is a technique that visualizes scheduling data through 3D
animations instead of static Gantt charts or CPM schedules. It has been used successfully in several projects such as Disney's California Adventure theme park in Anaheim, California and Disneyland theme park in Hong Kong with significant benefits to designers, general contractors, subcontractors, and owners. 4D CAD enhanced communication between project partners and facilitated understanding of design intent while minimizing delays during the construction
phrase. The owner was able to review alternate designs for the project and make timely decisions without a deep knowledge of architecture or engineering. Benefits to the general contractor and subcontractors included productivity improvements, fewer requests for information (RFI), reductions in change orders, and less reworking. Unforeseen conditions caused by interference and conflicts on site were discovered earlier in the design phase, allowing designers and engineers to develop constructability solutions for some circumstances such as working under cranes and in confined spaces.
Few transportation projects have utilized 4D CAD. The High Five Interchange project in Dallas, Texas used 4D CAD to facilitate the coordination on multilevel bridge construction (Liapi 2003). The researchers studied different traffic control scenarios for each construction phase. A similar approach was used for a tunnel construction project by a private company in Sydney, Australia. The project team used 4D CAD visualization techniques for communication and presentation of design and construction.
3
3. METHODOLOGY
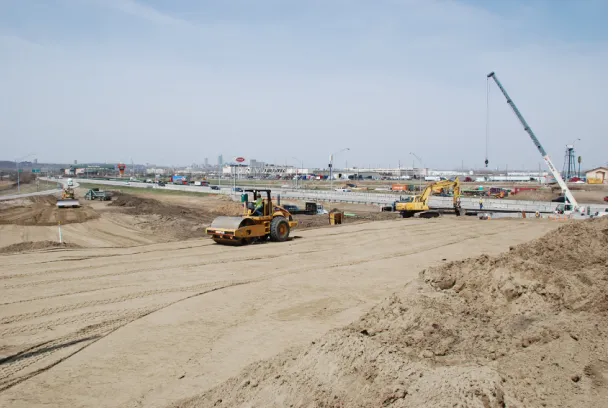
For the feasibility study using visualization and simulation in highway work zone safety and mobility, the research team investigated current technologies, collected suggestions from academic and industry focus groups, conducted an industry survey, and developed a simulation prototype. The 24th Street Bridge Renovation Project in Council Bluffs, Iowa was selected to be the sample study project.
3.1 Project Study
In this research, the 24th Street Bridge Renovation Project in Council Bluffs was used as a project study. The renovation project is located at the existing 24th Street Bridge in Council Bluffs, Pottawattamie County, Iowa. It is a part of the Council Bluffs Interstate System (CBIS) improvements project. The project scope is to replace an existing four span 215 ft 5 in. by 53 ft pretensioned, prestressed concrete beam bridge with a two span 350 ft by 105 ft steel welded girder bridge. 24th Street itself is to be widened and the highway ramps are to be reconstructed. The interstate I-29/I-80 is to be diverted. During the construction phases, 24th Street will provide one-lane traffic in each direction with a shared center lane for left-hand turns.
[image:17.612.155.461.425.629.2]The project was designed by HDR of Omaha, Nebraska. In November 2007 it was awarded to Cramer & Associates of Grimes, Iowa for $12.5 million. The daily traffic on I-80/I-29 is 81,900 vehicles per day with 11% of the traffic being trucks (2004). The traffic on 24th Street is 15,000 vehicles per day with 19% of the traffic being trucks (2004).
4
3.1.1 Project Site Analysis
The reasons for selection of the site used in this research are (1) public attention, (2) location, and (3) work zone settings. The bridge renovation project has gained attention from local businesses due to periods of road closures which potentially affect their customers. In order to communicate between engineers and non-engineers, visualization and simulations are most likely to be a major and better tool for communication than typical construction drawings. The location of the construction site is also near the Iowa-Nebraska border. There is high traffic merging from two interstate highways, I-29 and I-80, into one highway I-29/I-80 underneath the project site. 24th Street itself also has high traffic with 19% of the traffic being trucks. One of the potential uses of the visualization and simulation program is to improve mobility through the work zone. For the work zone settings, the construction planning divides the traffic work zone into six different settings in six stages from stage 1 to 6 (with three sub-stages in stage 4). The traffic has significantly changed several times during construction periods. On both 24th Street and the bridge itself there are different settings of traffic devices, traffic signs, and lane striping which change from stage to stage. To summarize, use of a visualization and simulation program may improve the safety, mobility, planning, and construction processes within the work zone. Moreover, it can be used to better communicate with the public about upcoming road closures.
3.2 Technology and Software Study
The research team studied the wide range of current visualization techniques emphasizing 4D CAD. The highway work zone is defined as a 4D CAD-type simulation since the time dimension is of interest. 4D CAD is an approach which visualizes a project schedule by evolving 3D
construction models over time. The 4D CAD concept has been used in the construction industry since early 2000. It is mainly used to visualize and prevent construction interference and
working space conflict. Several 4D CAD programs have been used on building and industrial construction projects. To develop a 4DCAD approach for transportation construction, the team studied the feasibility of two possible techniques: (1) using a commercial 4D software package or (2) adapting current 3D environment software.
3.3 Commercial 4D Packages
The most common 4D software programs currently available on the market are JetStream (Autodesk), ProjectWise (Bentley), Project 4D (Common Point), and fourDscape (Balfour).
3.3.1 JetStream
5
major CAD or 3D model files including AutoCAD 2007, MicroStation, ArchiCAD, Viz 2007, Revit, SketchUp 6, and 3ds Max. JetStream TimeLiner supports major project schedule software including Primavara P3 and Microsoft Project. The software can export into Acrobat PDF and video files in Windows AVI format. JetStream can be used during the design and preconstruction phase to identify potential conflicts in physical space (e.g., two utility pipes occupying the same space) or work space interference (e.g., lack of overhead clearance for crane booms).
3.3.2 ProjectWise
ProjectWise is a 3D package from Bentley Systems. The current version is V8 XM edition. The core software is ProjectWise Navigator (formerly Bentley Navigator) 3D navigation software. It requires ProjectWise Schedule Simulation to support integration of project scheduling data and ProjectWise Interference Manager for clash detection. It supports major CAD and 3D model files including DGN, DWG, PDF, AutoPlant, TriForma, PlantSpace, PDS, Google SketchUp 5 (only), GoogleEarth, IGES, STEP, JPEG, TIFF and 3DS. ProjectWise Schedule Simulation works with Microsoft Project, Primavera, Excel, and other XML formats. It provides tools for reviews and comments using both 2D and 3D models. Besides the 4D purpose, ProjectWise can be used for 3D online collaboration by using ProjectWise Integration Server and ProjectWise StartPoint.
3.3.3 Project 4D
Project 4D is an all-in-one 4D design software from Common Point Inc. It was developed by The Walt Disney Company and Stanford University. The current version is Project 4D 1.96. It was first used for California Screamin', a steel roller coaster at Disney's California Adventure theme park, and then subsequently used in the Disney Concert Hall in downtown Los Angeles. Project 4D supports CAD files including AutoCAD, Architectural Desktop, ArchiCAD, MicroStation, and AllPlan. It supports 3D model files from 3D Studio Max/VIZ, FormZ, Rhino, XSteel and schedule files from SureTrak, Expedition, MS Project, and Excel comma or tab-delimited files. Besides Project 4D, Common Point Inc. provides add-on packages such as ConstructSim and OpSim for use in construction simulation.
3.3.4 FourDscape
FourDscape is an all-in-one 4D visualization design software from Balfour Technologies which is partnering with New York State Applied Science Center of Innovation and Excellence in Homeland Security. It has been used in several projects including Huntsville Airport Intermodal Transportation Simulation, AL (TRB 2001) and 4D Interactive Roadway Traffic Simulation, Long Island, NY (NYSDOT). The software supports AutoCAD, MicroStation, MultiGen and Geo. The software itself can work on both Windows and Linux.
6
providing 4D service), VirtualSTEP (VirtualSTEP), and Visual Project Scheduler (Visual Engineering developed from research project from Boise State University).
3.4 Adaptation of Software with 3D Environment
To simulate a 4D-like system, working with a 3D environment application along with short programming codes is a viable alternative. This approach is able to create visualization and simulation without coding from scratch like working on C++ programming language with OpenGL. Some examples and brief descriptions of this type of software are Acrobat 3D
(Adobe),Second Life (Linden Lab), SketchUp and Earth (Google), and Walkinside (VRcontext).
3.4.1 Adobe Acrobat 3D
Adobe Acrobat 3D is an enhancement of typical Adobe Acrobat PDF which supports 3D models. The current version is Adobe Acrobat 3D 8. Acrobat 3D supports several 3D modeling systems including AutoCAD, MicroStation, 3ds Max, and SketchUp. The software includes pre-built navigation tools so the software can run as a stand-alone 3D environment. Users can view either online or offline similar to typical Adobe PDF files by using Adobe Reader. The software can work with short scripts called Acrobat JavaScript which is based on JavaScript. The script for working with scheduling information can be done by exporting a scheduling file in XML format and synchronizing with Adobe Acrobat 3D. The benefit of using Acrobat 3D is that it is readily available without requiring additional software beyond Adobe Reader.
3.4.2 Second Life
Second Life is an online application gaining in popularity. It provides real-time 3D navigation similar to multiplayer online video games. Users can create 3D models in an online environment which can be imported from external applications; however, Second Life is currently not fully compatible with several applications. The script can use LSL (Linden Script Language), an internal script for the Second Life itself based on C++ language. The software is available free for users; however, builders operating in Second Life pay a fee for creating any item in the shared platform.
3.4.3 Google SketchUp and Google Earth
7
3.4.4 Walkinside
Walkinside is an application displaying 3D real-time visualization and simulation from VRcontext. It allows users to walk or fly around the pre-built 3D models which are converted from either CAD files such as AutoCAD, MicroStation, or point cloud laser scan data.
3.5 Other Approaches
Besides 4D-like visualization approaches, the research team studied these other techniques.
3.5.1 Handheld Device Animations
An example of work zone animation for handheld devices was created for analysis purposes. The pre-set animation shows drive-through simulation of the work zone. Such animations can be used with a cell phone or palmtop computer. The goal is to improve usage by people without computer access or those currently on the road. A few limitations of this approach are the smaller screen and device availability. This approach disregards real-time navigation, using instead several pre-set videos from 3D simulations. The files are encoded and saved in available format for each device. The accessibility of this approach is satisfactory, but the simulation functionality is very limited.
3.5.2 2D Overlay Images
[image:21.612.93.518.526.667.2]This approach visualizes the work zone by overlaying traffic devices on top of current site condition photos. The research team collected highway photos of I-29/I-80 and 24th Street from a driver’s perspective. Then the photos were retouched using graphic software (Adobe Photoshop) as shown in Figure 2. The left photo is a current highway ramp condition, while the right photo shows a future work zone condition. This approach has the benefit of not needing the time to develop 3D models. However, it can be excessively time-consuming if there are several retouched images needed. The work time is about 30 minutes per image.
8
3.6 Software Comparison
To compare the software mentioned in the previous sections, three major issues are examined:
• Costs–The costs of developing the system including software, development, and maintenance costs
• Real-time navigation–The degree to which the software allows users to browse 3D models in any angle, The most constraining is the pre-set navigation in which users can see only the restricted views such as in a drive-through animation.
[image:22.612.67.556.289.643.2]• Availability–End-user benefit, hardware/software requirements, and ease of use All 4D software packages besides JetStream are grouped together since they share common values of the key issues listed above. Table 1 shows a comparison of the software.
Table 1. Comparison of Software
Issues 4D software
packages
JetStream Acrobat 3D
Second Life
SketchUp and Earth
Walkinside
Software cost High High Medium Low Free High
Maintenance
cost Yes Yes No No No Yes
3D
development cost and time
High High High Medium Low High
Real-time
navigation Yes No Yes Yes Yes Yes Yes
Availability to
end-users No Yes Yes Yes Yes Yes No
Internet connection required
No No No Yes Optional No
9
3.6.1 Data Requirements
After reviewing the software there are two types of data required to create visualization and simulation programs. These are 3D modeling data and scheduling data. 3D models are data that represent real construction objects. Each model must be composed of at least model name and model properties (polygon or face). Scheduling data comes from traffic work zone schedule information. Each schedule data point must be composed of task name, staging number, and start and end dates. These two data types are linked together by their reference names to visualize the schedule by 3D models.
Existence of scheduling data is common in highway projects. However, the major obstacle is that in general, 3D models are never created as part of the design process for transportation projects. They are typically only created for major construction projects requiring public involvement or multijurisdictional approvals. Therefore, the cost to develop 3D models is typically not included in the original design proposal, and there are currently no methods to generate 3D models from 2D drawings. The feasibility of overcoming this data gap is the subject of this study.
To identify state departments of transportation’s (DOT’s) data needs and implementation
constraints for work zone visualization and simulation programs, the research team conducted an industry survey and focus group discussion.
3.7 Focus Group
Prior to developing the simulations, the research team convened a nine-person focus group of knowledgeable industry leaders from academia, the Iowa DOT, U.S. Federal Highway
Administration (FHWA), and traffic control contractors. Focus group participants viewed the simulations and were asked their opinions regarding what aspects of transportation planning, design, and construction could benefit from the use of such simulations. The focus group used open-ended questions facilitated by the principal investigator. Areas of benefit receiving general consensus among the focus group participants included communication with the public during planning, internal traffic control during construction, drainage and utility coordination, driver education, driver preparedness, and safety training for construction workers. Potential barriers included lack of common software among project partners, variations in familiarity and computer usage within the project team, and limited resource availability for implementation. The research team used the results of the focus group dialogue to create a survey as described in the following section.
10
separate simulation for project team members. Some information such as detailed task schedules should not be exposed to the public.
3.8 Survey
As part of the feasibility study, the researchers developed a set of simple work zone simulations for a large, urban interstate expansion project in order to create a common context for survey respondents. The simulations were intended to help establish a common baseline for the definition of “visualization,” and represented a program in the middle of the sophistication continuum. The research team created three work zone configurations, each represented in ideal conditions and in poor visibility conditions, for a total of six simulations. The simulations were created in Google SketchUp Pro and Adobe Flash. Screen captures from the different
[image:24.612.124.491.274.461.2]visualizations are shown in Figure 3–5.
Figure 3. Traffic control for one-lane closure on divided highway
[image:24.612.129.487.510.685.2]11
Figure 5. Traffic control for full closure with temporary detour via exit/entrance ramps
12
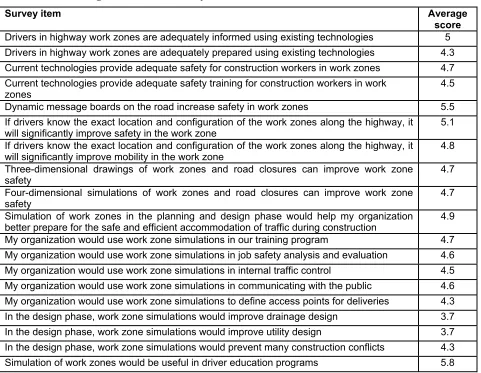
Table 2. The average score of the survey results
Survey item Average
score Drivers in highway work zones are adequately informed using existing technologies 5 Drivers in highway work zones are adequately prepared using existing technologies 4.3 Current technologies provide adequate safety for construction workers in work zones 4.7 Current technologies provide adequate safety training for construction workers in work
zones 4.5
Dynamic message boards on the road increase safety in work zones 5.5 If drivers know the exact location and configuration of the work zones along the highway, it
will significantly improve safety in the work zone 5.1
If drivers know the exact location and configuration of the work zones along the highway, it
will significantly improve mobility in the work zone 4.8
Three-dimensional drawings of work zones and road closures can improve work zone
safety 4.7
Four-dimensional simulations of work zones and road closures can improve work zone
safety 4.7
Simulation of work zones in the planning and design phase would help my organization
better prepare for the safe and efficient accommodation of traffic during construction 4.9 My organization would use work zone simulations in our training program 4.7 My organization would use work zone simulations in job safety analysis and evaluation 4.6 My organization would use work zone simulations in internal traffic control 4.5 My organization would use work zone simulations in communicating with the public 4.6 My organization would use work zone simulations to define access points for deliveries 4.3 In the design phase, work zone simulations would improve drainage design 3.7 In the design phase, work zone simulations would improve utility design 3.7 In the design phase, work zone simulations would prevent many construction conflicts 4.3 Simulation of work zones would be useful in driver education programs 5.8
Several t-tests were conducted to identify differences in respondents based on attributes. Comparisons were made between six different demographics factors as described in the following sections
3.8.1 Government and Non-government Agency (Contractors/Consultants)
There are five answers showing significant difference in values between responders of
13
Table 3. T-Test data of survey results between government and non-government
Survey item
Non-government Government Significant
Drivers in highway work zones are adequately
prepared using existing technologies 3.875 4.857 2.1%
Current technologies provide adequate safety for
construction workers in work zones 4.375 5.286 2.9%
Simulation of work zones in the planning and design phase would help my organization better prepare for the safe and efficient accommodation of traffic during
construction 4.375 5.500 2.8%
In the design phase, work zone simulations would
improve drainage design 3.250 4.214 5.5%
In the design phase, work zone simulations would
improve utility design 3.250 4.071 8.1%
3.8.2 Individuals with More or Less Than 20 Years’ Experience
There are four answers showing significant difference in values between responders with more than 20 year experience and less than 20 years experience. People with less than 20 years
experience tend to believe the usage of 3D and 4D visualization improves work zone safety more than people with more experience. People with less experience consider the use of simulations to communicate with the public more valuable than those with more experience. In contrast, people with more experience believe that the simulation can be used to prevent possible construction conflicts more than the people with less experience.
Table 4. T-Test data of survey results between people with more than 20 years experience and those with less than 20 years experience
Survey item Less than 20
years More than 20 years Significant
Three-dimensional drawings of work zones and road
closures can improve work zone safety 5.000 4.368 7.3%
Four-dimensional simulations of work zones and road
closures can improve work zone safety 4.889 4.368 9.7%
My organization would use work zone simulations in
communicating with the public 4.889 4.158 6.0%
In the design phase, work zone simulations would
prevent many construction conflicts 4.000 4.737 8.7%
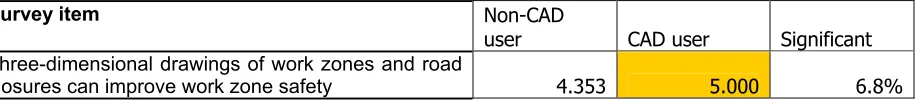
3.8.3 CAD Users and Non-users
[image:27.612.71.545.447.571.2]14
Table 5. T-Test data of survey result between CAD users and non-CAD users
Survey item Non-CAD
user CAD user Significant
Three-dimensional drawings of work zones and road
closures can improve work zone safety 4.353 5.000 6.8%
3.8.4 GIS Users and Non-users
There are three answers showing significant difference in values between responders who are familiar with Geographic Information Systems (GIS) and those who are not. For the perception of the current technologies, people who are familiar with GIS have more satisfaction than people who are not familiar. People familiar with GIS systems believe that the simulation will be useful for driver education programs more than those who are not familiar.
Table 6. T-Test data of survey result between GIS users and non-GIS users
Survey item Non-GIS user GIS user Significant
Drivers in highway work zones are adequately
prepared using existing technologies 4.095 4.706 5.2%
Current technologies provide adequate safety for
construction workers in work zones 4.429 5.000 8.7%
Simulation of work zones would be useful in driver
education programs 5.350 6.118 3.5%
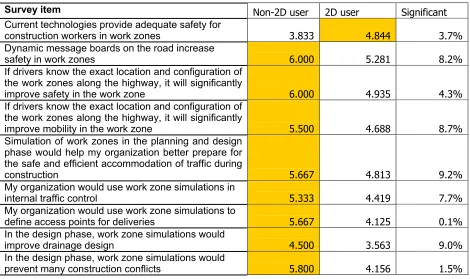
3.8.5 2D Drawing Users and Non-users of 2D Drawings
[image:28.612.78.543.301.395.2]15
Table 7. T-Test data of survey results between 2D drawings users
Survey item Non-2D user 2D user Significant
Current technologies provide adequate safety for
construction workers in work zones 3.833 4.844 3.7%
Dynamic message boards on the road increase
safety in work zones 6.000 5.281 8.2%
If drivers know the exact location and configuration of the work zones along the highway, it will significantly
improve safety in the work zone 6.000 4.935 4.3%
If drivers know the exact location and configuration of the work zones along the highway, it will significantly
improve mobility in the work zone 5.500 4.688 8.7%
Simulation of work zones in the planning and design phase would help my organization better prepare for the safe and efficient accommodation of traffic during
construction 5.667 4.813 9.2%
My organization would use work zone simulations in
internal traffic control 5.333 4.419 7.7%
My organization would use work zone simulations to
define access points for deliveries 5.667 4.125 0.1%
In the design phase, work zone simulations would
improve drainage design 4.500 3.563 9.0%
In the design phase, work zone simulations would
prevent many construction conflicts 5.800 4.156 1.5%
3.8.6 Regular Users of Scheduling Software and Non-users
There are five answers showing significant difference in values between responders who are familiar with scheduling software and those persons who are not. Persons familiar with the scheduling software have higher satisfaction with the current safety technologies but less satisfaction with the dynamic message boards. The people who are not familiar with scheduling software have higher acceptance of the usage of simulations during the design phase on drainage and utility designs including those that can prevent construction conflicts.
Table 8. T-Test data of survey result between scheduling software users
Survey item
Non-scheduling familiarity
Scheduling
familiarity Significant
Current technologies provide adequate safety for
construction workers in work zones 4.385 5.400 1.6%
Dynamic message boards on the road increase
safety in work zones 5.577 4.700 1.9%
In the design phase, work zone simulations would
improve drainage design 3.808 3.000 7.5%
In the design phase, work zone simulations would
improve utility design 3.885 3.000 5.7%
In the design phase, work zone simulations would
[image:29.612.71.543.526.687.2]16
4. VISUALIZATION AND SIMULATION DEVELOPMENT
From the software feasibility review, the focus group input, and survey responses from the industry, the research team developed a traffic highway visualization and simulation by using a combination of Google SketchUp and Google Earth software. The simulation was created from scratch starting from digitized 2D drawings from the 24th Street Bridge Project. Then 3D models were constructed based on the 2D layout. After that, the models were coded in Keyhole Markup Language (KML) to work with schedule data in Google Earth. Additionally, the photo-realistic image was created as a by-product result from the simulation. The development time was tracked and analyzed for estimation of labor hours required for development of similar visualizations on future projects. All the software development is freeware, so there is no cost for the software.
For the users’ side, the simulation and visualization is designed to use without the need for installing special, costly software. The only software needed to run the simulation is Google Earth, which is a free download from the Internet. It is available in Windows, Macintosh, and Linux operating systems. The minimum requirements are explained in the Appendix.
To develop the example for this feasibility study, the research team used a desktop computer with the following specifications:
• Operating System: Windows XP SP2
• CPU: 2.8 GHz, Pentium 4
• System Memory (RAM): 1024 MB
• Hard Disk: 70GB
• Graphics Card: NVIDIA Quadro4 900XGL 128MB of VRAM Three freeware computer applications were used which are:
• Google SketchUp–A 3D modeling application creating whole construction items, traffic signs, and traffic devices in 3D models.
• Notepad++ (Notepad plus plus)–A text editor coding the programming language to use 3D models with scheduling data working in Google Earth.
• Google Earth–3D navigation tool with aerial and satellite photographs supported.
4.1 3D SketchUp Models
17
4.1.1 Project-Specific Models
Project-specific models are those models which are tailored to specific parts of the project, including different types of roads, bridges, intersections, ramps, and so forth. In the 24th Street
Bridge Renovation Project, the following models were made according to proposed and existing construction objects:
• Existing 24th Street Bridge–Four-lane undivided roadway
• Proposed 24th Street Bridge–Six-lane undivided roadway with two-lane left turn
• Existing 24th Street
• Proposed widening of 24th Street
• Interstate 80–Five-lane divided highway
• Existing ramps
• Proposed ramps
• Surrounding buildings
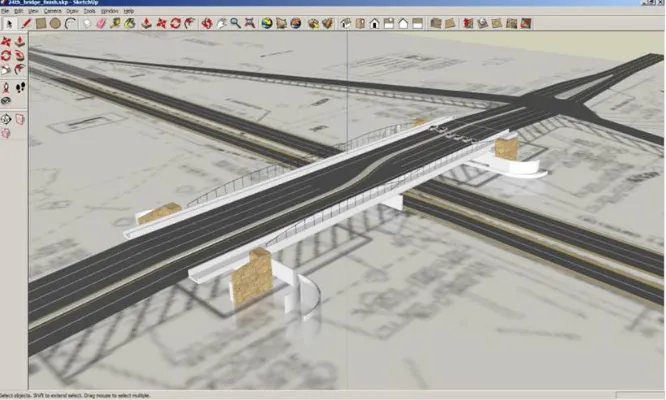
[image:31.612.140.473.401.601.2]The models were created based on 2D drawings retrieved from the bridge designer. The PDF drawings were converted into 2D JPG images to use as a base for 3D models. Figure 6 shows the completed 3D model of a six-lane bridge on top of the base 2D drawings.
Figure 6. SketchUp proposed bridge model—Created on top of PDF/JPG drawing
The simulation was created from scratch starting from digitized 2D PDF/JPG drawings;
18
Figure 7. SketchUp wing wall model—converting from 2D outline into 3D model
[image:32.612.112.496.317.444.2]Colors and textures, called materials, were added to the models’ faces. Figure 8 shows wing wall models with and without stone material applied. Figure 9 shows a material in a transparent type of safety fence using PNG image.
Figure 8. SketchUp wing wall model—without material (left) and with material (right)
[image:32.612.97.512.509.656.2]19
The accuracy of the project-specific models can be varied depending on the purpose. Since the highway work zone is the main purpose in this research, some details such as crown slopes were omitted.
4.1.2 3D Library Models
[image:33.612.90.503.369.525.2]3D library models were created separately from the project-based models. The library models are defined as 3D models which are reusable in any project. Most of the objects in the 3D library are traffic signs and temporary control devices. The library was also created and saved in SketchUp native format for reuse. In this project they were created following specifications from the Manual on Uniform Traffic Control Devices (MUTCD) from the FHWA. The accuracy of the library models are exactly the same as shown in the specifications. Other than MUTCD signs and devices, some models such as a flagger were created to be reused. Figure 10 shows examples of 3D library models created and used in this research; from left to right are tabular marker, electronic sign (chevron sign), barricade, and flagger. Note that these icons are not to scale below, but would be at-scale when incorporated into a visualization program.
Figure 10. 3D library models–from left to right tabular marker, electronic sign, barricade, and flagger
20
Figure 11. Library models setup illustrating work zone installation
To use 3D models with different applications, they were saved in COLLADA (COLLAborative Design Activity) interoperable format. COLLADA is a text-based format file arranged in XML style with the extension .dae; example of codes are shown in Figure 12. This type of file is able to be opened in any text editor. The .dae files can be retrieved from a temporary folder in SketchUp and transferred to models developed in Google Earth. Google SketchUp Pro (paid version) has a slight benefit which is the ability to save files in extension .dae directly.
<?xml version="1.0" encoding="utf-8"?>
<COLLADA xmlns="http://www.collada.org/2005/11/COLLADASchema" version="1.4.1">
<asset>
<contributor>
<authoring_tool>Google SketchUp 6.4.112</authoring_tool> </contributor>
<created>2008-03-04T23:24:39Z</created> <modified>2008-03-04T23:24:39Z</modified> <unit name="inches" meter="0.0254"/> <up_axis>Z_UP</up_axis>
</asset>
<library_images>
<image id="material0-image" name="material0-image"> <init_from>../images/drawing.png</init_from> </image>
</library_images> <library_materials>
<material id="material0ID" name="material0"> <instance_effect url="#material0-effect"/> </material>
. . .
Figure 12. COLLADA file code example
4.2 Scheduling Data
21
Cramer Construction Inc. provided the research team with a preliminary schedule. For the highway construction schedule, in addition to the typical construction schedule, tasks are
grouped into stages for traffic control. Work zone stages are also used as schedule milestones. In this research, instead of using start and end dates for separate tasks, start and end dates of traffic work zone stages were used. Each stage schedule is linked to a 3D model representing the work zone configuration under that stage of construction.
4.3 Models and Schedule Linkage
3D models and schedule data were linked by KML code. The code controls the appearance of the models according to the defined schedule. When the specified time is in-between the start and end dates, the models appear on the screen. At the same time, if the specified time is outside the range of the start and end date, the model specific to that stage disappears.
3D models in each type have different start and end dates listed below:
New construction to be built
• The start date is set according to the contractor’s schedule.
• The end date is set from the estimated duration. Existing structures to be demolished
• The start date is set as the project start date.
• The end date is set according to the scheduled duration for demolition. Temporary construction objects
• The start date is set according to the scheduled installation date.
• The end date is set according to the scheduled date of removal of the temporary objects. Surrounding environment objects
• The start date is set as the project start.
• The end date is set as the project finish.
22
Figure 13. Google Earth Simulation—displaying time navigation
The visualization program is available for view at ftp://www.ctre.iastate.edu/, under the
WorkZoneVisual directory. The site requires a Username (ctreftp) and Password (ftpctre). Once in the WorkZoneVisual directory, download the 24stbridge.kzm file. Figure 14 shows an
example of what the code looks like in KML. Time value is arranged in year-month-date format (YYYY-MM-DD) i.e. 2008-14-01; which can go into details of hours, minutes, and seconds depending on the accuracy needed.
<name>Stage 1</name> <TimeSpan>
<begin>2008-04-01</begin> <end>2008-04-28</end> </TimeSpan>
.
.
.
Figure 14. KML code—an example of TimeSpan tag
4.4 Google Earth KML
Keyhole Markup Language, known as KML, is a markup language used in Google Earth. Unlike a programming language, the markup language is a language type running directly in the
software without additional compiling. In this research, Notepad++ was used as a text editor.
The KML file, with a native extension of .kml, is a markup code in XML format. The current standard is KML 2.1. It was first developed by Keyhole and now Google. Similar to other markup languages, text in angle brackets represents functions and identifiers, while text outside the brackets are values. An example of KML code shown in Figure 15 creates an illustration of the box-shaped polygon shown in Google Earth in Figure 16. The locations are defined in latitude and longitude in <coordinate> with the height defined in <extrude>.
<Placemark>
23
<GeometryCollection> <Polygon>
<extrude>1</extrude>
<altitudeMode>relativeToGround</altitudeMode> <outerBoundaryIs>
<LinearRing> <coordinates>
-95.87880425187282,41.23544760697231,17 -95.87881741416284,41.2357473556454,17 -95.87868505197329,41.23575066753321,17 -95.8786718902864,41.23545091882539,17 -95.87880425187282,41.23544760697231,17 </coordinates>
</LinearRing> </outerBoundaryIs> </Polygon>
[image:37.612.117.479.72.260.2]</GeometryCollection> </Placemark>
Figure 15. KML code—an example of a box-shaped polygon
Figure 16. A box-shaped polygon created from KML displayed in Google Earth
A set of data in KML is composed of different models and their functions in separate sets, called placemarks. Each placemark consists of several functions, primarily models, location, and style. An example of a KML placemark is displayed in Figure 17. To explain the code, the 3D file
model6.dae displays at the location of the longitude and latitude at -95.879033808603 and 41.232260364904, respectively. The model will appear if the date cursor is in-between the periods of October 29, 2008, through November 26, 2008, as shown in Figure 18.
<Placemark id="Stage 6"> <name>Stage 6</name> <TimeSpan>
<begin>2008-10-29</begin> <end>2008-11-26</end> </TimeSpan>
[image:37.612.173.439.300.495.2]24
<longitude>-95.879033808603</longitude> <latitude>41.232260364904</latitude> <altitude>0.000000000000</altitude> </Location>
<Link>
<href>models/model6.dae</href> </Link>
[image:38.612.168.450.208.377.2]</Model> </Placemark>
Figure 17. KML code—an example of each model
Figure 18. Visualization of 24th Street Bridge northbound during stage 6—displayed in Google Earth
4.5 Estimated Development Time
The research team kept track of the work hours required to develop the 3D models and KML codes for visualization and simulation of the 24th Street Bridge project. A total of 44 hours were required in the following categories:
• Review project document (10 hours)
• Create 3D project models–bridges, ramps, and roads (5 hours)
• Create 3D library models–traffic signs and devices used in the project (10 hours– reusable)
• Setup traffic zone simulations for 6 stages and 2 substages–lane striping, signs, and devices (15 hours)
• Code in KML for Google Earth (2 hours)
• Demonstrate to retrieve feedback (2 hours)
25
4.6 Deployment
The KML file can be deployed separately as several .kml files or a single-file package as .kmz, which is more convenient to send over the network. The file .kmz is a typical zipped format. It contains several .kml files.
To open either the .kml or .kmz file, end users can open the file directly in Google Earth. The simulation will appear in the middle of the screen. If the internet connection is available, aerial and satellite images will display underneath the models. However, to use the models with aerial and satellite images without internet connection, users can pre-load those images into the software temporary storage.
[image:39.612.203.410.307.414.2]Besides work zone visualization and simulation, the existing 3D proposed bridge was rendered by software named Kerkythea as a by-product result. The photo realistic images of the bridge are displayed in Figure 19 and Figure 20.
Figure 19. Rendered image of proposed 24th Street Bridge looking toward the west
[image:39.612.203.411.449.579.2]26
5. SUMMARY AND RECOMMENDATIONS
5.1 Summary
The survey results indicated that responders’ opinions are neutral toward the work zone
simulation initiative. The simulation’s potential benefits are not noticeable over the current work zone system. However, analyzed t-test survey results showed that people from government agencies favor simulation benefits more than non-government people. At the same time, people with less than 20 years experience in highway construction favor simulation benefits more than those who have more experience in construction. In general, those respondents who had less experience and more knowledge of CAD and GIS held different perceptions of the benefits of visualization than those with more experience and less familiarity with CAD and GIS
technologies. In short, there may be a generational effect in perception of the value of visualizations
The simulation also shows that it is feasible to use relatively simple programs as tools for public communication and 4D visualization of traffic work zones at different construction phases. From the meetings with focus groups and Council Bluffs engineers and contractors, people prefer 3D simulation over the typical 2D drawings for communication purposes. Some suggest using it via the project website. For the planning phase it can be useful to communicate between
stakeholders showing how the current and future traffic work zone looks without causing other interference and construction conflicts. The ease of use and the availability to everyone are major keys to developing the system further.
The visualization of the 24th Street Bridge work zone is available on a CD attached to this final report.
5.2 Recommendations
Future research should examine how the simulation can be improved in the level of detail. The approach can be altered depending on the visualization and simulation purposes. Some
recommendations are as follows.
• 3D model details—The visualization can be improved by increasing the accuracy or dimensional scale of the models themselves. However, development cost will likely be increased accordingly. In the future, if the highway construction design process moves from 2D to 3D design, the 3D models can be available without recreating them. For instance, in the building construction sector of the industry, several firms have migrated from CAD to building information modeling (BIM) which is a 3D model-based design. Returning to highway construction, some software such as Autodesk Civil 3D provides 3D designs which can be used in Google Earth. An example of application for higher model details is to simulate drive-through on the real time geometric design measuring driver reactions, truck turning radius, and drainage design, for example.
27
schedule from a day to an hour or a minute. To do this can be as simple as modifying code in KML to a specific time period. An example of application for higher time details is to simulate task traffic control or quality control such as installation of the traffic devices in a specific time period.
28
6. REFERENCES
Bailey, K., Brumm, J., and Grossardt, T. 2002. Integrating Visualization into Structured Public Involvement, Journal of the Transportation Research Board, Transportation Research Record, 1817: 50-57.
Fischer, M., Haymaker, J., and Liston, K. 2003. Benefits of 3D and 4D Models for Facility Managers and AEC Service Providers, in book 4D CAD and Visualization in Construction: Developments and Applications. A.A. Balkema Publishers, Leiden, The Netherlands. Fontaine, M.D. 2003. Guidelines for Application of Portable Work Zone Intelligent
Transportation Systems, Journal of the Transportation Research Board, Transportation Research Record, 1824: 15-22.
Liapi, K.A. 2003. 4D visualization of highway construction projects. Information Visualization, 2003, IEEE, London, United Kingdom, 1: 639-644.
Muller, J., How to Build A Mountain : Disney's 4-D technology aims to take the adventure out of building roller coasters. Forbes Magazine.
Schrock, S.D., Ullman, G.L., and Trout, N.D. 2002. Survey of State Law Enforcement Personnel
on Work Zone Enforcement Practices, Journal of the Transportation Research Board, Transportation Research Record, 1818: 7-11.
Shi, J. 2007. Live and Let Live, iit Magazine, IIT Center for Work Zone Safety and Mobility. Center for Work Zone Safety and Mobility, (accessed January, 20, 2008).
A-1
APPENDIX A: LIST OF SOFTWARE AND VERSIONS USED IN THE RESEARCH PROJECT
Animation for survey
• Adobe Flash CS3 (9.0.2)–multimedia authoring software for the Internet
• Google SketchUp Pro 6 (6.4.112)–3D modeling and animation software 4D-like visualization and simulation
• Google Earth 4.2 (4.2.0205.5730)–virtual globe software
• Google SketchUp 6 (6.4.112)–3D modeling software
• Notepad++ 4.82–text editor Rendering
• Adobe Photoshop CS3 (10.0)–graphics editor
B- 1
APPENDIX B: END-USERS SYSTEM MINIMUM REQUIREMENT
Windows
• Operating System: Windows 2000, Windows XP, Windows Vista
• CPU: 500Mhz, Pentium 3
• System Memory (RAM): 256MB minimum, 512MB recommended
• Hard Disk: 400MB free space
• Network Speed: 128 Kbits/sec
• Graphics Card: 3D-capable with 16MB of VRAM
• Screen: 1024x768, "16-bit High Color" screen
• DirectX 9 (to run in Direct X mode) Macintosh
• Operating System: Mac OS X 10.4 or later
• CPU: G4 CPU, 1GHz or faster
• System Memory (RAM): 256MB minimum, 512MB recommended
• Hard Disk: 400MB free space
• Network Speed: 128 Kbits/sec
• Graphics Card: 3D-capable with 32MB of VRAM
• Screen: 1024x768, "Thousands of Colors" Linux
• CPU: 500Mhz, Pentium 3
• System Memory (RAM): 256MB RAM
• Hard Disk: 500MB free space
• Network Speed: 128 Kbits/sec
• Graphics Card: 3D-capable with 16MB of VRAM
• Screen: 1024x768, "16-bit High Color" screen"
C-1
APPENDIX C: SIMULATION EXAMPLES OF THE 24TH STREET BRIDGE
[image:47.612.77.508.155.262.2]RENOVATION PROJECT
[image:47.612.84.506.344.455.2]Figure C.1. Bird’s-eye view over the bridge—looking north from project start to finish
Figure C.2. Driver’s view at the south of the bridge—looking north from project start to finish
[image:47.612.80.506.554.664.2]C-2
D-1
APPENDIX D: SURVEYS RESULTS
Survey item Average
score
Drivers in highway work zones are adequately informed using existing technologies 5 Drivers in highway work zones are adequately prepared using existing technologies 4.3 Current technologies provide adequate safety for construction workers in work zones 4.7 Current technologies provide adequate safety training for construction workers in work zones 4.5 Dynamic message boards on the road increase safety in work zones 5.5 If drivers know the exact location and configuration of the work zones along the highway, it will
significantly improve safety in the work zone 5.1
If drivers know the exact location and configuration of the work zones along the highway, it will
significantly improve mobility in the work zone 4.8
Three-dimensional drawings of work zones and road closures can improve work zone safety 4.7 Four-dimensional simulations of work zones and road closures can improve work zone safety 4.7 Simulation of work zones in the planning and design phase would help my organization better prepare for the safe and efficient accommodation of traffic during construction 4.9 My organization would use work zone simulations in our training program 4.7 My organization would use work zone simulations in job safety analysis and evaluation 4.6 My organization would use work zone simulations in internal traffic control 4.5 My organization would use work zone simulations in communicating with the public 4.6 My organization would use work zone simulations to define access points for deliveries 4.3 In the design phase, work zone simulations would improve drainage design 3.7 In the design phase, work zone simulations would improve utility design 3.7 In the design phase, work zone simulations would prevent many construction conflicts 4.3 Simulation of work zones would be useful in driver education programs 5.8
Government
Survey item
Non-gov. Gov. Significant
Drivers in highway work zones are adequately informed using existing technologies 4.875 5.357 12.0%
Drivers in highway work zones are adequately prepared using existing technologies 3.875 4.857 2.1%
Current technologies provide adequate safety for construction workers in work zones 4.375 5.286 2.9%
Current technologies provide adequate safety training for construction workers in work
zones 4.750 4.500 30.2%
Dynamic message boards on the road increase safety in work zones 5.500 5.357 40.3%
If drivers know the exact location and configuration of the work zones along the
highway, it will significantly improve safety in the work zone 5.500 5.154 29.5% If drivers know the exact location and configuration of the work zones along the
D-2
Three-dimensional drawings of work zones and road closures can improve work zone
safety 4.875 4.786 44.2%
Four-dimensional simulations of work zones and road closures can improve work
zone safety 4.625 5.214 10.1%
Simulation of work zones in the planning and design phase would help my organization better prepare for the safe and efficient accommodation of traffic during construction
4.375 5.500 2.8%
My organization would use work zone simulations in our training program 4.625 5.357 10.7%
My organization would use work zone simulations in job safety analysis and
evaluation 4.750 5.071 28.2%
My organization would use work zone simulations in internal traffic control 4.375 5.071 14.8%
My organization would use work zone simulations in communicating with the public 4.500 4.929 23.0%
My organization would use work zone simulations to define access points for
deliveries 4.500 4.643 38.9%
In the design phase, work zone simulations would improve drainage design 3.250 4.214 5.5%
In the design phase, work zone simulations would improve utility design 3.250 4.071 8.1%
In the design phase, work zone simulations would prevent many construction conflicts 4.500 4.714 36.9%
Simulation of work zones would be useful in driver education programs 6.250 5.786 20.8%
20 years experience
Survey item less more Significant
Drivers in highway work zones are adequately informed using existing technologies 4.889 5.105 25.9%
Drivers in highway work zones are adequately prepared using existing technologies 4.333 4.316 48.2%
Current technologies provide adequate safety for construction workers in work zones 4.667 4.684 48.4%
Current technologies provide adequate safety training for construction workers in work
zones 4.500 4.421 41.5%
Dynamic message boards on the road increase safety in work zones 5.222 5.526 21.2%
If drivers know the exact location and configuration of the work zones along the
highway, it will significantly improve safety in the work zone 5.111 5.111 50.0% If drivers know the exact location and configuration of the work zones along the
highway, it will significantly improve mobility in the work zone 4.944 4.632 23.5% Three-dimensional drawings of work zones and road closures can improve work zone
safety 5.000 4.368 7.3%
Four-dimensional simulations of work zones and road closures can improve work
zone safety 4.889 4.368 9.7%
Simulation of work zones in the planning and design phase would help my organization better prepare for the safe and efficient accommodation of traffic during construction
5.000 4.842 36.9%
My organization would use work zone simulations in our training program 4.500 4.667 35.9%
My organization would use work zone simulations in job safety analysis and
evaluation 4.556 4.389 35.3%
My organization would use work zone simulations in internal traffic control 4.444 4.444 50.0%
My organization would use work zone simulations in communicating with the public 4.889 4.158 6.0%
My organization would use work zone simulations to define access points for
deliveries 4.278 4.474 30.8%
In the design phase, work zone simulations would improve drainage design 3.667 3.789 40.9%
In the design phase, work zone simulations would improve utility design 3.722 3.737 48.9%