Abstract: This research study was carried out with the aims to formulate new measuring, which focuses on the measuring of job demands in the context of engineer's job. The content of ESJD scale was validated via expert assessment using the Delphi Method (30 experts). Descriptive statistics, analysis factor with promax rotation, correlation analysis, linear regression analysis and one-way MANOVA test were used in this study to analyse the samples of registered engineers in Malaysia (N=504). The study showed satisfactory reliability and validity results for the new scale. The results of this study are expected to provide information to the management, administrators and organisational leaders in managing risks that affect the level of stress, psychological wellbeing and their impact on the level of professional commitment among engineers as well as the best method of implementing them.
Index Terms: Engineers, Job demand, Occupational stress, Psychological wellbeing
I. INTRODUCTION
Parallel to meeting the needs of national and community development, engineering-related organisations and companies are required to work hand-in-hand in completing the aspirations of the people and nation. However, in the era of globalisation, engineering-related companies have to operate in a highly competitive open market with low profitability expectations, and even have to complete engineering projects on tight deadlines and faced with the constraints of very limited financial budget. Because of this, engineers as the main drivers of engineering-related companies are forced to face high job demands from management and clients, to continue to compete and further survive in business.
This has led to the occupational stress experienced by most engineers, following high job demands. Due to workload, many studies have reported cases of occupational stress experienced by engineers in various economic sectors (Bowen, Edwards, Lingard, & Cattell, 2014; Chen et al., 2011; De Silva, Samanmali, & De Silva, 2017). High workload and lack of salary and promotion prospects are among the two major contributory factors of occupational stress experienced by engineers (Yip & Rowlinson, 2009).
Revised Manuscript Received on May 05, 2019.
Mohd Farhan, Faculty of Engineering & Built, Universiti Kebangsaan Malaysia
Muhamad Azry, Faculty of Engineering & Built, Universiti Kebangsaan Malaysia
Azlina, Faculty of Social Sciences & Humanities, Universiti Kebangsaan Malaysia
Eizah, Academy of Malay Studies, Universiti Malaya
Occupational stress experienced by engineers has become the subject of accumulated research (Hall et al., 2015; Ronen & Malach Pines, 2008). Concerns about the health effects of various stress relating to work, shortage of engineers and retrenchment among engineers have been highlighted in the national and global themes (e.g. Etzion, 1988; Keenan & Newton, 1985; Lingard, 2003; Rothmann & Malan, 2006).
One of the most frequently used theories is the job demands-resources theory, first introduced by Demerouti (2001) which is known as the JD-R model, and later improved and matured into the JD-R theory (Bakker & Demerouti, 2007, 2017). As detailed in the latest meta-analysis collection, the JD-R model has been used as part of the thousands of associations, and is used as part of the accurate size of research measurement (Alarcon, 2011; Bakker, Demerouti, & Sanz-Vergel, 2014; Crawford, LePine, & Rich, 2010; Nahrgang, Morgeson, & Hofmann, 2011).
According to Demerouti (2001), 'job demands' as demonstrated by the JD-R model and the determination of this investigation consideration refers to "the job aspects that require continuous physical or mental effort and are associated with certain physiological and psychological effects", for example; emotionally, has to work with customers or clients under high work pressure.
'Job demands' in the JD-R model is a unique predictor for health problems such as stress due to work and fatigue. However, psychological measurements for job demands in the JD-R model are highly generic, since there are additional job demands that are specific for certain job contexts. The use of generic job demands can affect prognostic quality (Bakker & Demerouti, 2017). Hence, it is said that the causes of occupational stress, in this case, job demands, need to be identified in the design of specific occupational characteristics based on specific context by the types of employment, as a way to develop a better understanding of the relationship between job demands and stress (Sparks & Cooper, 1999).
For example, jobs in the healthcare sector such as nurses are recorded as having certain job demands such as emotional demand related to 'illness and death', 'patient needs' and 'patient threats and violence' (Sundin, Hochwälder, & Bildt, 2008). Specific job demands in the context of entrepreneurial jobs have been found, such as emotional demands related to 'uncertainty and risk' (Dijkhuizen, Van Veldhoven, Schalk, & Schalk, 2014).
Engineers also have a particular job design for certain responsibilities, for example; applying engineering theory principles to engineering projects; performing detailed
Engineer Specific Job Demand Scale
Development
engineering calculations to build manufacturing, construction and installation standards; investigating client or public complaints; determining the nature and extent of the problem; recommending recovery measures, etc. (International Labor Office, 2012).
Therefore, this study has identified and developed a measurement scale of specific job demands for engineers, and subsequently compared the effects of job demands of ordinary occupations and engineer specific job demands, on the stress and psychological wellbeing associated with the work of an engineer.
To achieve that goal, we specifically address three goals: first, we identify, list down, develop and propose the occupational needs of specialised item engineers and ESJD measurement models based on comprehensive literary scans and expert opinions through Delphi techniques.
Second, we collect engineer researcher feedback data from various industries and gender background (N = 550). Random multistage sampling is used as a technique for determining samples. Third, we analyse the data. We conduct descriptive analysis to examine the data distribution.
We perform reliability checks to determine internal consistency of the measurements. We assess, discriminate and reduce measuring items, based on the suitability of items to measure using principal component analysis techniques.
Next, we test whether the ESJD measurement model is suitable for research data, using a valid factorial analysis method. We hypothesise that the ESJD measurement model has a satisfying level of goodness-of-fit with the research data. Lastly, we examine the relation of ESJD towards the stress with regard to job, and psychological wellbeing among engineers.
A. Measurement Scale Construction
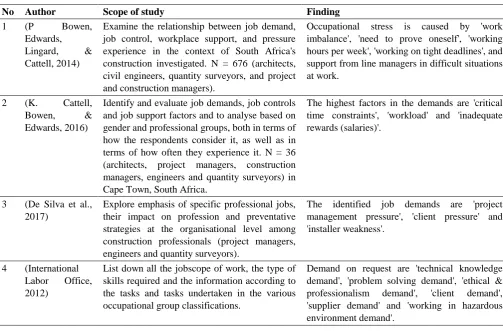
[image:2.595.45.549.333.664.2]In this phase, the objective of the study is to develop and validate the ESJD measurement scale. The findings of literary analysis (see Table 1) and interviews (see Table 2), the images that appear are the distinctive demands of engineers, with most demands focusing on cognitive, quantitative and emotional, and less on physical job demands.
Table. 1 Findings of the library analysis on the aspects of engineer specific job demands
No Author Scope of study Finding
1 (P Bowen, Edwards, Lingard, & Cattell, 2014)
Examine the relationship between job demand, job control, workplace support, and pressure experience in the context of South Africa's construction investigated. N = 676 (architects, civil engineers, quantity surveyors, and project and construction managers).
Occupational stress is caused by 'work imbalance', 'need to prove oneself', 'working hours per week', 'working on tight deadlines', and support from line managers in difficult situations at work.
2 (K. Cattell, Bowen, & Edwards, 2016)
Identify and evaluate job demands, job controls and job support factors and to analyse based on gender and professional groups, both in terms of how the respondents consider it, as well as in terms of how often they experience it. N = 36 (architects, project managers, construction managers, engineers and quantity surveyors) in Cape Town, South Africa.
The highest factors in the demands are 'critical time constraints', 'workload' and 'inadequate rewards (salaries)'.
3 (De Silva et al., 2017)
Explore emphasis of specific professional jobs, their impact on profession and preventative strategies at the organisational level among construction professionals (project managers, engineers and quantity surveyors).
The identified job demands are 'project management pressure', 'client pressure' and 'installer weakness'.
4 (International Labor Office, 2012)
List down all the jobscope of work, the type of skills required and the information according to the tasks and tasks undertaken in the various occupational group classifications.
No Author Scope of study Finding 5 (Kaufman,
1974)
Investigate the relationship of job challenge experienced by 85 engineers at the start of their career for their next job performance, professional contribution, and efficiency.
Engineers whose early work experience involves technical job challengers tend to contribute to a relatively early knowledge and to maintain a professional competence and good working performance during their career. For those with high technical capabilities, the initial challenge contributes to the professional and higher competence of their careers.
6 (Langdon & Sawang, 2018)
Investigate the main pressures in construction workplace
The results show that key pressures are 'time', 'personal finance' and 'solving technical problems demand'
7 (Board of Engineers Malaysia, 1967)
Formulate rules and guidelines as a measurable mechanism to regulate the conduct and ethics of those involved in engineering in Malaysia.
Engineers are required to carry out their noble, responsible, ethical and legal duties to fulfill their professional duties with due diligence, care and persistence. At all times hold the highest security, public health interests, and take reasonable steps to minimise the predictable adverse effects towards the environment.
8 (Lingard, 2003) Explore the 'burnout' experience among engineers working in the Australian construction industry.
The relative importance of occupational characteristics rather than character traits in predicting combustion.
9 (Rahim & Siti-Rohaida, 2015)
Evaluate the level of individual wellbeing among Malaysian engineers who use career development goals as a predictor.
The development of career goals has a positive influence on the individual's wellbeing.
10 (Saleh & Desai, 1990)
This sample was used to test the relationship between each of three internal control variables, Type A behaviour, and job involvement, with occupational stress and job satisfaction of 249 male engineers from various organisations.
The results showed that Type A engineers experienced high levels of stress. However, recognition, behaviour and job involvement were all positively associated with satisfaction and in this case, bilateral interaction between validity and involvement and three-way interaction between the three variables were also found. 11 (Robinson,
2012)
Examine various tasks and activities planned by engineers, how their working time is distributed among them, and how these issues affect their satisfaction with their jobs.
[image:3.595.48.554.542.823.2]The design engineer's work involves large technical engineering works (62.92% of the time) and socially social work (40.37% of the time).
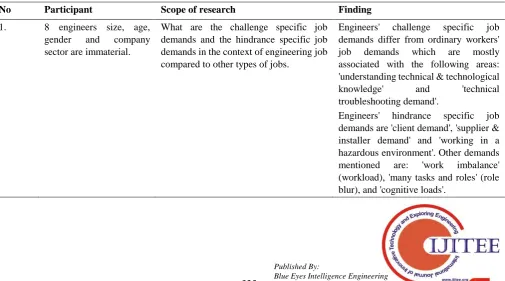
Table. 2 Interview findings on specific job demands in the
No Participant Scope of research Finding
1. 8 engineers size, age, gender and company sector are immaterial.
What are the challenge specific job demands and the hindrance specific job demands in the context of engineering job compared to other types of jobs.
Engineers' challenge specific job demands differ from ordinary workers' job demands which are mostly associated with the following areas: 'understanding technical & technological knowledge' and 'technical troubleshooting demand'.
Next, 40 question items were formed based on library analysis to measure engineer specific job demands. In this study, job demands were grouped and analysed in two types: namely, challenge job demands and hindrance job demands, as proposed in (Podsakoff et al., 2007; Van den Broeck et al., 2010). This was aimed to produce more specific measurements. The use of generic job demands can affect the quality of job stress measurement and prediction expectation of health problems associated with occupational stress (Bakker & Demerouti, 2017).
Then, content validation process for the proposed measurement items was done through Delphi's repeated consultation process with the experts. The Delphi's techniques are widely used in the context of social science research (Czinkota & Ronkainen, 1997; Keeney, Hasson, & McKenna, 2006; Yeh & Cheng, 2015), because this method can be used to investigate something that is yet to exist (Halal, Kull, & Leffmann, 1997; Rowe & Wright, 1999; Skulmoski & Hartman, 2007). Delphi participants in this study were consisted of N = 30 (experienced engineers = 16, engineering academicians = 13, psychometric = 1) who were not involved in the criterion validity phase. Participants were selected based on their knowledge and experience with regard to the issues being investigated. Academicians would be recognised whether they were senior lecturers or professors related to the topic studied, while engineers must have experience of at least 6 years and above in the industry.
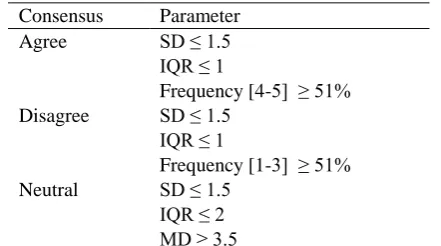
[image:4.595.321.532.501.602.2]The methodology, which was aimed at obtaining the level of agreement and criteria used for this study was based on the method adopted in some studies (Christie & Barela, 2005; Giannarou & Zervas, 2014; Hackett, Masson, & Phillips, 2006; Raskin, 1994; Rayens & Hahn, 2000). Data collection during the first round of consultation led to the establishment of consensus criteria among the panel members (see Table 3). Table. 3 The main criteria in the definition of consensus
for Delphi expert analysis Consensus Parameter
Agree SD ≤ 1.5 IQR ≤ 1
Frequency [4-5] ≥ 51% Disagree SD ≤ 1.5
IQR ≤ 1
Frequency [1-3] ≥ 51% Neutral SD ≤ 1.5
IQR ≤ 2 MD ≥ 3.5
Note: SD = standard deviation, IQR= interquartile range, MD = Median
Our additional analytical strategies for Delphi study were the assessment of central tendency, and deployment measures; the level of consensus between rounds, namely Round 1 (R1) and Round 2 (R2), by validating the stability which was "the consistency of the answers between successful study rounds", by estimating "coefficient of variation difference" (Dajani, Sincoff, & Talley, 1979) and "F-Ratio" to compare item variations from two consecutive rounds, as well as the Pearson correlation coefficient for expert responses towards the items of two consecutive rounds. The
stability parameter for the consensus level between R1 and R2 is shown in Table 4. The total number of items after being filtered through the Delphi study was 28 items to represent six dimensions. A total of 12 items were dropped from 40 original items.
Table. 4 Stability parameter for consensus level between Round R1 and Round R2
Delphi Consensus Question Item Stability Parameter Coefficient of Variation difference C Vd ≈ 0
F-Ratio F ≈ 1
Pearson correlation coefficient r ≈ 1 Note: CVd = coefficient of variation difference; F = F-ratio; r = correlation coefficient
Next, 28 ESJD items were tested on face validity according to the criteria of the face validity analysis outlined by Davis (1992). Data analysis at this stage was aimed to evaluate ESJD question items presentation, whether the items in the instrument appear to be relevant, reasonable, unclear and not misleading. The results of the face validity analysis showed that the ESJD scale had recorded a satisfactory average percent agreement of clarity index and understanding, which exceeded the parameter level of 80% (average index 82.9%-92.2%). The overall results of the face validity analysis, indicate that the ESJD scale is understandable and has no confusion about the sentences produced.
For the purpose of the ESJD construct validity analysis and the subsequent analyses (linear regression analysis and SEM analysis), the study collected feedback from respondents involving 504 engineers registered with the Board of Engineers Malaysia in various industry sectors of various engineering disciplines. Respondents distribution by engineering disciplines is shown in Table 5.
Table. 5 Respondents distribution by engineering disciplines
Engineering Discipline Frequency Per cent Civil Engineering 182 36.1 Electrical Engineering 78 15.5 Electronic Engineering 64 12.7 Mechanical Engineering 94 18.7 Chemical Engineering 43 8.5
Others 43 8.5
Total 504 100
It was discovered that respondents of civil engineering discipline recorded the highest frequency of 182 persons (36.1%), followed by respondents from mechanical engineering of 94 persons (18.7%), electrical engineering of 78 persons (15.5%), electronic engineering of 64 persons (12.7%), chemical engineering of 43 (8.5%) and others of 43 respondents (8.5%).
[image:4.595.59.280.506.629.2]This is because the actual distribution of population composition according to engineering disciplines were 33.6% of civil engineers, 22.7% of mechanical engineers, 15.71% of electric engineers, 10.9% of electronic engineers, 8% of chemical engineers and 9% are engineers of other engineering fields (“Board Of Engineers Malaysia,” n.d.). The findings of this study can be estimated as fair and square as the views from engineers of all engineering disciplines were gathered. Subsequently, the data from this study can be used for further reference and future research. Next, 28 items were tested for construct validity through factorial analysis.
II. FACTORIAL ANALYSIS
The first step was to identify the suitability of existing data to be used in factor analysis methods through Bartlett and Kaiser-Meyer-Olkin tests. Bartlett's test results on the ESJD scale recorded a significant value of < 0.5, while KaiserMeyerOlkin's sample sufficiency test recorded a value of 0.948, and these results surpassed the minimum parameter level suggested by Pallant (2016) of 0.6. Thus, the results of both tests support that the study data samples indicate the factorability of the correlation matrix. In other words, the study data can be used for the factorial analysis purposes.
Then, a factorial analysis was carried out using factor extraction and rotation. This step was done to extract variables and categorise them.
The initial factorial analysis conducted had presented six components with eigenvalues greater than 1, each explaining 42.2%, 18.2%, 6.1%, 5.3%, 4.9% and 4.4% of the variance, respectively. Using the Cattell test (1966), the study decided to retain all six components for further investigation.
Six component solutions explained a fraction of the total variance by the saved factor of 81, 21%, exceeding the recommended value of 50% (Streiner, 1994). A promax rotation was later carried out to build the components that can be understood. The rotated solution revealed the presence of simple structures (Thurstone, 1931), with all six components showing some strong loads and all variables were loaded significantly on only one component.
[image:5.595.308.544.365.833.2]The results of the number of components to be retained were further validated by conducting a PA parallel test. In PA tests, component is rejected when the initial eigenvalue of extraction factor is found to be lower than the value of the corresponding PA analysis criteria for the randomly generated data matrix with the same size (28 variables x 504 respondents, 1000 recurrences) using Monte Carlo statistical software (Watkins, 2000). Based on the information about the size of eigenvalues, slopes changes and PA (see Table 6), six components were retained in the analysis.
Table. 6 The results of the eigenvalue of factor extraction analysis and parallel PA analysis
Number of Factor Component
Eigenvalue from factor extraction
Criterion value from PA
Result
C1 11.829 1.462 Retained
C2 5.105 1.395 Retained
C3 1.725 1.345 Retained
C4 1.471 1.302 Retained
Number of Factor Component
Eigenvalue from factor extraction
Criterion value from PA
Result
C5 1.374 1.265 Retained
C6 1.234 1.230 Retained
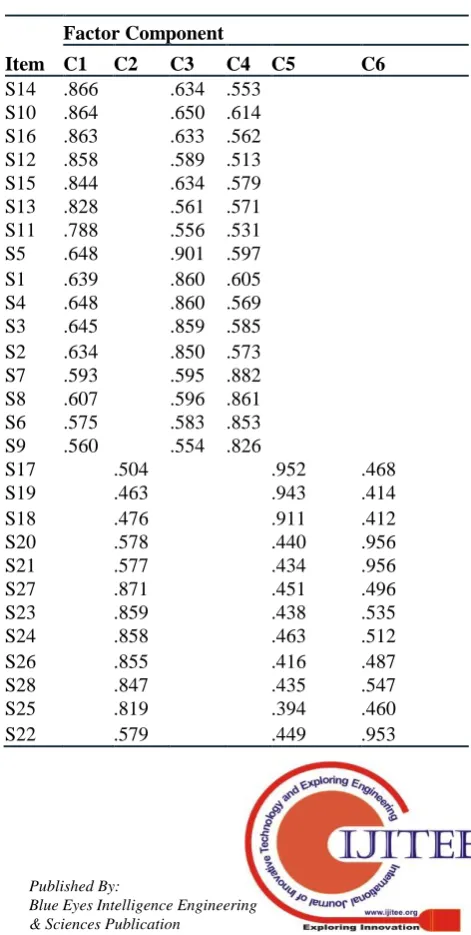
The communal values of all retained items are above the recommended value of 0.3 as Pallant (2016) indicates that all saved items correspond to each other in the component. Six components are consisted of 28 items. The component factors: C1 represents 'ethical and responsibility demand', C2 represents 'working under pressure and hazardous environment demand', C3 represents 'master the technical knowledge demand', C4 represents 'problem solving demand', C5 represents 'client demand' and C6 represents 'supplier and installer demand'.
The findings of the matrix structural analysis of the factor extraction found that the factor components of C1, C3 and C4 were structured (loading factor above 0.5) and could be compiled as "challenge" specific job demands while the factor components of C2, C5 and C6 were structured (loading factor above 0.5 and would be collected as "hindrance" specific job demands (See Table 7).
Table. 7 Structure matrix Promax rotation factorial extraction
Item
Factor Component
C1 C2 C3 C4 C5 C6
S14 .866 .634 .553 S10 .864 .650 .614 S16 .863 .633 .562 S12 .858 .589 .513 S15 .844 .634 .579 S13 .828 .561 .571 S11 .788 .556 .531 S5 .648 .901 .597 S1 .639 .860 .605 S4 .648 .860 .569 S3 .645 .859 .585 S2 .634 .850 .573 S7 .593 .595 .882 S8 .607 .596 .861 S6 .575 .583 .853 S9 .560 .554 .826
S17 .504 .952 .468
S19 .463 .943 .414
S18 .476 .911 .412
S20 .578 .440 .956
S21 .577 .434 .956
S27 .871 .451 .496
S23 .859 .438 .535
S24 .858 .463 .512
S26 .855 .416 .487
S28 .847 .435 .547
S25 .819 .394 .460
[image:5.595.53.285.697.786.2]A. Analysis of similarities
Next, for the sample of this study (n = 504) the items extracted in factorial analysis were tested for similarities in measuring certain job demands, regardless of the differences in demographics (i.e. type of industry, years of service, gender and engineering discipline). MANOVA test and Leven homogeneity test were conducted to find a significant difference in variance and mean between the varied
demographic groups mentioned above. The results of the similarity tests which are the Leven homogeneity test and the MANOVA test (see Table 7) showed that there was no significant difference between mean and variance between crossed industry, engineering discipline, gender and years of service (p > 0.05). This scale demonstrates the measurement capability that is not in favour of the varied demographic types specified.
Table. 8 Homogene Leven and MANOVA tests
Demography
Challenge Job Demand Hindrance Job Demand
Homogeneity Leven Test (p-value)
One-Way MANOVA (p-value)
Homogeneity Leven Test (p-value)
One-Way MANOVA (p-value)
Gender .447 .727 .198 .386
Type of Industry .620 .827 .086 .852
Discipline .768 .969 .519 .619
Years of Service .976 .849 .710 .367
Note:
Gender : 1) Male 2) Female
Types of Industry : 1) Manufacturing 2) Construction 3) Oil & Gas 4) Public service 5) Aviation 6) Transportation & Logistic 7) Energy 8) Others Discipline : 1) Civil Engineering 2) Electrical Engineering 3) Electronic Engineering 4) Mechanical Engineering 5) Chemical Engineering 6) Others Years of Service : 1) 0-5 years, 2) 6-10 years 3) 10 years and above
B. Criterion Validity Analysis (Regression Analysis) Next, the validity of the developed criterion scale was assessed. Based on the research hypothesis, this specific job demands of engineering have positive influence towards work-related stress and negative towards psychological wellbeing, and we estimated that the strength of the relationship far outweighed the relationship between ordinary job demands and psychological wellbeing and work-related stress. This predictive criterion validity analysis was based on the hypothesis statement of the study as stated in the following description.
Hypothesis 1: There is a more positive relationship between the level of 'hindrance' specific job demands and the work-related stress among engineers, as opposed to the level of ordinary job demands.
Hypothesis 2: There is a positive relationship between the level of 'challenge' specific job demands and the psychological wellbeing among engineers, similar to job resources.
In this study, job demands were gathered, distinguished and examined in two types: "challenge" job demands and "hindrance" job demands, as suggested in (Bakker & Sanz-Vergel, 2013; Cavanaugh, Boswell, Roehling, & Boudreau, 2000; Podsakoff et al., 2007; Tadić, Bakker, &
Oerlemans, 2015; Van den Broeck, de Cuyper, de Witte, & Vansteenkiste, 2010). As stated in the study, "challenge" demands may be seen as "hindrance" demands, depending on the context of the occupation, and "challenge" demands were estimated to be positive for psychological wellbeing.
[image:6.595.39.556.175.263.2]The findings of the correlation analysis were conducted on the study samples (n = 504), with the dimensions in the JD-R and ESJD models demonstrating strong relationships between the items of stress and psychological dimensions (see Table 24). The correlation between challenge specific job demands (M = 2.69, SD = .80) and psychological wellbeing (M = 2.63, SD = .77) showed a positive and moderately strong correlation, r = .501, p < .01. This is parallel to the job resources (M = 2.69, SD = .79) that was positively related to psychological wellbeing (M = 2.63, SD = .77) at the correlation of r = .668, p < .01. While hindrance specific job demands (M = 2.66, SD = .77) showed a more positive correlation value with occupational stress dimension (M = 2.61, SD = .73) at the correlation of r = .585, p < .01 as opposed to ordinary job demands (M = 2.67, SD = .80) at the correlation of r = .467, p < .01.
Table. 9 Inter correlations between 6 dimensions Intercorrelation
1 2 3 4 5 6
1 Challenge Job Demands 1 -.350** -.444** -.226** .657** .432**
2 Hindrance Job Demands -.350** 1 .540** .585** -.501** -.487**
3 Ordinary Job Demands -.444** .540** 1 .467** -.492** -.431**
4 Occupational Stress -.226** .585** .467** 1 -.467** -.438**
5 Psychological Wellbeing .657** -.501** -.492** -.467** 1 .668**
6 Job Resources .432** -.487** -.431** -.438** .668** 1
Multiple linear regression analysis was performed to investigate the relationship between the dimensions in the JD-R model based on the study hypotheses, and the ESJD scale (see Table 9 and Table 10 for results). The results of the data analysis using engineers sample, n = 504 by using the SPSS program significantly showed that challenge job demands and ordinary job demands were the predictive factors of occupational stress, where both of which predictive variables accounted for 37.4% changes of occupational stress variance [ R² = .374, F (2,501) = 149.79, p < . 05]. Analysis showed that predictive variables of hindrance job demands (β = .47, ρ < .05) recorded higher standard regression coefficients than ordinary job demands (β = .21, ρ < .05). Both predictive variables recorded a significant results of standard regression coefficient.
In addition, the results of multiple linear regression analysis for predictive variable of challenge job demands and ordinary job demands on psychological wellbeing significantly showed that challenge job demands recorded a significant β value (β = .45, ρ <. 05) in the psychological wellbeing modelling equation, parallel to job resources (β = -.47, ρ < .05). Both predictive variables accounted for 61.4% change in psychological wellbeing variance [R² = .614, F (2,501) = 397.65, p < . 05]. Both predictive variables recorded a significant results of standard regression coefficient. Overall, these results confirm hypothesis 1 and 2 of this research that there is a more positive relationship between the level of 'hindrance' specific job demands and work-related stress among engineers in Malaysia, as opposed to the level of ordinary job demands, and there is a positive relationship between the level of 'challenge' specific job demands and
psychological wellbeing of engineers in Malaysia, similar to job resources.
Table. 10 ESJD multiple linear regression analysis on occupational stress
[image:7.595.304.550.220.285.2]Note: Responding variable : occupational stress
Table. 11 ESJD multiple linear regression analysis on psychological wellbeing
Independent variable Occupational stress (Standardised Beta) Hindrance Job Demands .470
Ordinary Job Demands .213
Note: Responding variable: psychological wellbeing C. Reliability analysis
[image:7.595.49.545.462.565.2]Next, a reliability analysis was carried out on the ESJD scale. Internal consistency and correlation between items of six indices are shown in Table 11. All six dimensions showed satisfactory internal consistency, Cronbach's alpha ranged from α = .92 to α = .94 and each index had a correlation between items that exceeded r = .30 (Hair , Black, Babin, & Anderson, 2010). The final items for the ESJD scale were consisted of 28 items as listed in Appendix A.
Table. 12 Number of items (n), correlation between items and Cronbach's Alpha (α) of six dimensions
Dimension n Correlation between items (r) α
Master the technical knowledge demand 5 0.72 - 0.77 0.94
Problem solving demand 4 0.69 - 0.76 0.92
Ethical and responsibility demand 7 0.67 – 0.76 0.94
Client demand 3 0.89 – 0.89 0.95
Installer and supplier demand 3 0.91 0.96
Working under pressure and hazardous working environment demand
6 0.68 – 0.74 0.94
The findings of the ESJD scale development analysis suggest that the ESJD scale is a measurement instrument that
has satisfactory levels of validity and reliability for measuring specific job demands in the context of an engineer's job.
[image:7.595.52.550.660.752.2]III. CONCLUSION Table 17 shows the findings summary of this study.
Table. 17 Results summary of the whole analyses RESULTS OF THE ESJD SCALE DEVELOPMENT ANALYSIS
ACTIVITY RESULT
Development of scale draft 40 items were developed for measuring 3 dimensions of hindrance specific job demands and 3 dimensions of challenge specific job demands.
Delphi content validity analysis 28 items were retained and 12 items were dropped from 40 original items. Face validity analysis 28 items were retained.
Factorial analysis 28 items were retained. 6 sub-factors (dimensions) formed 2 main factors, namely (challenge specific job demands and hindrance specific job demands).
Independent variable Psychological wellbeing (Standardised Beta) Challenge Job Demands .453
Equality analysis The ESJD scale did not show any differences in the variance results on different groups of demographics (gender, type of industry, years of service, engineering discipline) Criterion validity analysis - Challenge specific job demands recorded more positive relationship strengths towards
occupational stress than ordinary job demands.
- Challenge specific job demands recorded the strength of a positive relationship towards the psychological wellbeing parallel to job resources.
Reliability analysis All six dimensions showed satisfactory internal consistency, Cronbach's alpha ranging from .92 to .94.
Among the main purposes of the study was to develop and validate new tools in measuring job demands; that is, Engineer Specific Job Demand (ESJD), which focuses on measuring specific job demands in the context of engineering jobs. In the early stage which was the exploratory phase, we identified the scope of engineer specific job demands to be measured which produced six dimensions: 'technical knowledge demand', 'problem solving demand', 'ethical and responsibility demand',' client demand', 'supplier and installer demand' and 'working under pressure and hazardous working environment demand'.
Based on that, 40 draft items have been constructed and formulated. The scale draft was then evaluated and analysed through two Delphi studies and face validity study that produced 28 items. This 28-item ESJD scale was then verified for its reliability and consistency through construct validity analysis, compatibility test, criterion validity analysis and internal consistency analysis, involving respondents of n = 504 of registered engineers.
The findings of the ESJD scale development analysis suggested that the ESJD scale is a measurement instrument that has a satisfactory level of validity and reliability to measure specific job demands for the context of an engineer's job.
ACKNOWLEDGEMENT
This material is based upon work supported by the Universiti Kebangsaan Malaysia under Grant No. KK-2018-013. We would like to show our gratitude to the Mohd Awang Idris of University Malaya for sharing his pearls of wisdom with us during the course of this research, and we thank 2 “anonymous” reviewers for their so-called insights.
REFERENCES
1. Alarcon, G. M. (2011). A meta-analysis of burnout with job demands, resources, and attitudes. Journal of Vocational Behavior, 79(2), 549–562.
2. Bakker, A. B., & Demerouti, E. (2007). The Job Demands Resources model: State of the art. Journal of Managerial Psychology, 22(3), 309–328. https://doi.org/10.1108/02683940710733115
3. Bakker, A. B., & Demerouti, E. (2017). Job Demands – Resources Theory: Taking Stock and Looking Forward. Journal of Occupational
Health Psychology, 22(3), 273–285.
https://doi.org/10.1037/ocp0000056
4. Bakker, A. B., Demerouti, E., & Sanz-Vergel, A. I. (2014). Burnout and Work Engagement: The JD–R Approach. Annual Review of Organizational Psychology and Organizational Behavior, 1(1), 389–411. https://doi.org/10.1146/annurev-orgpsych-031413-091235 5. Bakker, A. B., & Sanz-Vergel, A. I. (2013). Weekly work engagement
and flourishing: The role of hindrance and challenge job demands.
Journal of Vocational Behavior, 83(3), 397–409.
https://doi.org/10.1016/j.jvb.2013.06.008
6. Board Of Engineers Malaysia. (n.d.). Retrieved October 9, 2018, from
http://bem.org.my/web/guest/professional-engineer-with-practising-co mpetency
7. Bollen, K. A., & Pearl, J. (2013). Eight myths about causality and structural equation models. In Handbook of causal analysis for social research (pp. 301–328). Springer.
8. Bowen, P., Edwards, P., Lingard, H., & Cattell, K. (2014). Occupational stress and job demand, control and support factors among construction project consultants. International Journal of Project Management, 32(7), 1273–1284. https://doi.org/10.1016/j.ijproman.2014.01.008
9. Bowen, P., Edwards, P., Lingard, H., & Cattell, K. (2014). Occupational stress and job demand, control and support factors among construction project consultants. International Journal of Project Management, 32(7), 1273–1284. https://doi.org/10.1016/j.ijproman.2014.01.008
10. Cattell, K., Bowen, P., & Edwards, P. (2016). Stress among South African construction professionals: a job demand-control-support survey. Construction Management and Economics, 34(10), 700–723. https://doi.org/10.1080/01446193.2016.1203967
11. Cattell, R. B. (1966). The scree test for the number of factors.
Multivariate Behavioral Research, 1(2), 245–276.
https://doi.org/10.1207/s15327906mbr0102_10
12. Cavanaugh, M. A., Boswell, W. R., Roehling, M. V., & Boudreau, J. W. (2000). An empirical examination of self-reported work stress among U.S. managers. Journal of Applied Psychology, 85(1), 65–74. https://doi.org/10.1037/0021-9010.85.1.65
13. Chen, S. W., Wang, P. C., Hsin, P. L., Oates, A., Sun, I. W., & Liu, S. I. (2011). Job stress models, depressive disorders and work performance of engineers in microelectronics industry. International Archives of Occupational and Environmental Health, 84(1), 91–103. https://doi.org/10.1007/s00420-010-0538-y
14. Christie, C. A., & Barela, E. (2005). The Delphi technique as a method for increasing inclusion in the evaluation process. Canadian Journal of Program Evaluation, 20(1), 105–122.
15. Crawford, E. R., LePine, J. A., & Rich, B. L. (2010). Linking job demands and resources to employee engagement and burnout: A theoretical extension and meta-analytic test. Journal of Applied Psychology, 95(5), 834–848. https://doi.org/10.1037/a0019364 16. Czinkota, M. R., & Ronkainen, I. A. (1997). International business and
trade in the next decade: Report from a delphi study. Journal of
International Business Studies, 28(4), 827–844.
https://doi.org/10.1057/palgrave.jibs.8490121
17. Dajani, J. S., Sincoff, M. Z., & Talley, W. K. (1979). Stability and agreement criteria for the termination of Delphi studies. Technological
Forecasting and Social Change, 13(1), 83–90.
https://doi.org/10.1016/0040-1625(79)90007-6
18. Davis, L. L. (1992). Instrument review: Getting the most from a panel of experts. Applied Nursing Research, 5(4), 194–197.
19. De Silva, N., Samanmali, R., & De Silva, H. L. (2017). Managing occupational stress of professionals in large construction projects. Journal of Engineering, Design and Technology, 15(4), 488–504. https://doi.org/10.1108/JEDT-09-2016-0066
20. Demerouti, E., Bakker, A. B., De Jonge, J., Janssen, P. P. M., & Schaufeli, W. B. (2001). Burnout and engagement at work as a function of demands and control. Scandinavian Journal of Work, Environment and Health, 27(4), 279–286. https://doi.org/10.5271/sjweh.615 21. Demerouti, E., Nachreiner, F., Baker, A. B., & Schaufeli, W. B. (2001).
The Job Demand-Resources Model of Burnout. Journal of Applied Psychology. https://doi.org/10.1108/02683940710733115
23. Etzion, D. (1988). The experience of burnout and work/non‐work success in male and female engineers: A matched‐pairs comparison.
Human Resource Management, 27(2), 163–179.
https://doi.org/10.1002/hrm.3930270204
24. Giannarou, L., & Zervas, E. (2014). Using Delphi technique to build consensus in practice. Int. Journal of Business Science and Applied Management, 9(2). Retrieved from
http://business-and-management.org/library/2014/9_2--65-82-Giannar ou,Zervas.pdf
25. Hackett, S., Masson, H., & Phillips, S. (2006). Exploring consensus in practice with youth who are sexually abusive: Findings from a delphi study of practitioner views in the United Kingdom and the Republic of
Ireland. Child Maltreatment, 11(2), 146–156.
https://doi.org/10.1177/1077559505285744
26. Hair, J. F., Black, W. C., Babin, B. J., & Anderson, R. E. (2010). Multivariate Data Analysis. Vectors.
https://doi.org/10.1016/j.ijpharm.2011.02.019
27. Halal, W. E., Kull, M. D., & Leffmann, A. (1997). Emerging technologies: What’s ahead for 2001-2030. The Futurist, 31(6), 20–28. Retrieved from
http://search.proquest.com/docview/218556510?accountid=43603 LA - English
28. Hall, W. M., Schmader, T., & Croft, E. (2015). Engineering Exchanges: Daily Social Identity Threat Predicts Burnout Among Female Engineers. Social Psychological and Personality Science, 6(5), 528–534. https://doi.org/10.1177/1948550615572637
29. Imai, K., Keele, L., & Tingley, D. (2010). A general approach to causal mediation analysis. Psychological Methods, 15(4), 309.
30. International Labor Office. (2012). International Standard Classification of Occupations. Isco-08. https://doi.org/10.13140/RG.2.1.1419.3126 31. Kaufman, H. G. (1974). Relationship of early work challenge to job
performance, professional contributions, and competence of engineers. Journal of Applied Psychology, 59(3), 377–379.
https://doi.org/10.1037/h0036772
32. Keenan, A., & Newton, T. J. (1985). Stressful events, stressors and psychological strains in young professional engineers. Journal of Organizational Behavior, 6(2), 151–156.
https://doi.org/10.1002/job.4030060206
33. Keeney, S., Hasson, F., & McKenna, H. (2006). Consulting the oracle: Ten lessons from using the Delphi technique in nursing research. Journal of Advanced Nursing, 53(2), 205–212.
https://doi.org/10.1111/j.1365-2648.2006.03716.x
34. Langdon, R. R., & Sawang, S. (2018). Construction Workers’ Well-Being: What Leads to Depression, Anxiety, and Stress? Journal of Construction Engineering and Management, 144(2), 04017100. https://doi.org/10.1061/(ASCE)CO.1943-7862.0001406
35. Lembaga Jurutera Malaysia. Laws of Malaysia Registration Of Engineers Act 1967 And Registration Of Engineers Regulations 1990 With Explanatory Notes To Latest Amendments (1967). Lembaga Jurutera Malaysia. Retrieved from
http://bem.org.my/documents/20181/42321/REA2015_REG2015%28 Final%29.pdf/29ce2fae-9019-4320-9e92-0d02fea2684b
36. Lingard, H. (2003). The impact of individual and job characteristics on “burnout” among civil engineers in Australia and the implications for employee turnover. Construction Management and Economics. https://doi.org/10.1080/0144619032000065126
37. Nahrgang, J. D., Morgeson, F. P., & Hofmann, D. A. (2011). Safety at Work: A Meta-Analytic Investigation of the Link Between Job Demands, Job Resources, Burnout, Engagement, and Safety Outcomes.
Journal of Applied Psychology, 96(1), 71–94.
https://doi.org/10.1037/a0021484
38. Pallant, J. (2016). SPSS survival manual: a step by step guide to data analysis using SPSS. Step by step guide to data analysis using the SPSS program.
39. Podsakoff, N. P., Lepine, J. A., & Lepine, M. A. (2007). Differential challenge stressor-hindrance stressor relationships with job attitudes, turnover intentions, turnover, and withdrawal behavior: A meta-analysis. Journal of Applied Psychology, 92(2), 438–454. https://doi.org/10.1037/0021-9010.92.2.438
40. Rahim, N. B., & Siti-Rohaida, M. Z. (2015). Career satisfaction and psychological well-being among professional engineers in Malaysia: The effect of career goal development. Asian Academy of Management Journal, 20(2), 127–146.
41. Raskin, M. S. (1994). The Delphi study in field instruction revisited: expert consensus on issues and research priorities. Journal of Social Work Education, 30, 75–89.
42. Rayens, M. K., & Hahn, E. J. (2000). Building Consensus Using the Policy Delphi Method. Policy, Politics, & Nursing Practice, 1(4), 308–315. https://doi.org/10.1177/152715440000100409
43. Robinson, M. A. (2012). How design engineers spend their time: Job content and task satisfaction. Design Studies, 33(4), 391–425. https://doi.org/10.1016/J.DESTUD.2012.03.002
44. Ronen, S., & Malach Pines, A. (2008). Gender differences in engineers’ burnout. Equal Opportunities International, 27(8), 677–691. https://doi.org/10.1108/02610150810916749
45. Rothmann, S., & Malan, M. (2006). Occupational stress of engineers in South Africa. Southern African Business Review, 10(2), 1–16. https://doi.org/10.1211/ijpp.15.3.0011
46. Rowe, G., & Wright, G. (1999). The Delphi technique as a forecasting tool: issues and analysis. International Journal of Forecasting, 15(4), 353–375. https://doi.org/10.1016/S0169-2070(99)00018-7
47. Saleh, S. D., & Desai, K. (1990). An empirical analysis of job stress and job satisfaction of engineers. Journal of Engineering and Technology
Management, 7(1), 37–48.
https://doi.org/10.1016/0923-4748(90)90024-2
48. Skulmoski, G. J., & Hartman, F. T. (2007). The Delphi Method for Graduate Research. Journal of Information …, 6(2007), 1–21. Retrieved from
http://search.ebscohost.com/login.aspx?direct=true&profile=ehost&sco pe=site&authtype=crawler&jrnl=15393585&AN=28085942&h=6TPec hArzgAUUyn0flq5Hezr6FbTGt9SSWh%2BRHtKArkLQKSjR5%2BA D0fg7TDe0aa1qgkNJcp1y9pum0OKMoCEkw%3D%3D&crl=c%5Cn papers3://publication/uuid/7
49. Sparks, K., & Cooper, C. L. (1999). Occupational differences in the work-strain relationship: Towards the use of situation-specific models. Journal of Occupational and Organizational Psychology, 72(2), 219–229. https://doi.org/10.1348/096317999166617
50. Streiner, D. L. (1994). Figuring out factors: The use and misuse of factor analysis. Canadian Journal of Psychiatry, 39(3), 135–140. https://doi.org/10.1177/070674379403900303
51. Sundin, L., Hochwälder, J., & Bildt, C. (2008). A scale for measuring specific job demands within the health care sector: Development and psychometric assessment. International Journal of Nursing Studies, 45(6), 914–923. https://doi.org/10.1016/j.ijnurstu.2007.03.006 52. Tadić, M., Bakker, A. B., & Oerlemans, W. G. M. (2015). Challenge
versus hindrance job demands and well-being: A diary study on the moderating role of job resources. Journal of Occupational and Organizational Psychology, 88(4), 702–725.
https://doi.org/10.1111/joop.12094
53. Thurstone, L. L. (1931). Multiple factor analysis. Psychological Review, 38(5), 406–427. https://doi.org/10.1037/h0069792
54. van den Broeck, A., de Cuyper, N., de Witte, H., & Vansteenkiste, M. (2010). Not all job demands are equal: Differentiating job hindrances and job challenges in the job demands-resources model. European Journal of Work and Organizational Psychology, 19(6), 735–759. https://doi.org/10.1080/13594320903223839
55. Van den Broeck, A., de Cuyper, N., de Witte, H., & Vansteenkiste, M. (2010). Not all job demands are equal: Differentiating job hindrances and job challenges in the job demands-resources model. European Journal of Work and Organizational Psychology, 19(6), 735–759. https://doi.org/10.1080/13594320903223839
56. Watkins, M. (2000). Monte Carlo PCA for Parallel Analysis (computer software). Journal of Modern Applied Statistical Methods, 5(2), 344–346.
57. Yeh, D. Y., & Cheng, C. H. (2015). Recommendation system for popular tourist attractions in Taiwan using Delphi panel and repertory
grid techniques. Tourism Management, 46, 164–176.
https://doi.org/10.1016/j.tourman.2014.07.002