https://doi.org/10.5194/bg-16-3319-2019 © Author(s) 2019. This work is distributed under the Creative Commons Attribution 4.0 License.
Technical note: Interferences of volatile organic compounds (VOCs)
on methane concentration measurements
Lukas Kohl1,2, Markku Koskinen1,2,3, Kaisa Rissanen2,4, Iikka Haikarainen1,2, Tatu Polvinen1,2, Heidi Hellén3, and Mari Pihlatie1,2,5
1Department of Agricultural Sciences, University of Helsinki, Helsinki, 00790, Finland
2Institute for Atmospheric and Earth System Research/Forest Sciences, Faculty of Agriculture and Forestry,
University of Helsinki, Finland
3Finnish Meteorological Institute, P.O. Box 503, Helsinki, 00101, Finland 4Department of Forest Sciences, University of Helsinki, Helsinki, 00790, Finland 5ViPS – Viikki Plant Science Center, University of Helsinki, Helsinki, 00790, Finland
Correspondence:Lukas Kohl (lukas.kohl@helsinki.fi) Received: 22 March 2019 – Discussion started: 2 April 2019
Revised: 29 July 2019 – Accepted: 15 August 2019 – Published: 4 September 2019
Abstract. Studies that quantify plant methane (CH4)
emis-sion rely on the accurate measurement of small changes in the mixing ratio of CH4 that coincide with much larger
changes in the mixing ratio of volatile organic compounds (VOCs). Here, we assessed whether 11 commonly occurring VOCs (e.g. methanol, α- and β-pinene, 13-carene) inter-fered with the quantitation of CH4 by five laser-absorption
spectroscopy and Fourier-transformed infrared spectroscopy (FTIR) based CH4 analysers, and quantified the
interfer-ence of seven compounds on three instruments. Our results showed minimal interference with laser-based analysers and underlined the importance of identifying and compensat-ing for interferences with FTIR instruments. When VOCs were not included in the spectral library, they exerted a strong bias on FTIR-based instruments (64–1800 ppbv ap-parent CH4ppmv−1 VOC). Minor (0.7–126 ppbv ppmv−1)
interference with FTIR-based measurements were also de-tected when the spectrum of the interfering VOC was in-cluded in the library. In contrast, we detected only mi-nor (<20 ppbv ppmv−1) and transient (<1 min) VOC inter-ferences on laser-absorption spectroscopy-based analysers. Overall, our results demonstrate that VOC interferences have only minor effects on CH4flux measurements in soil
cham-bers, but may severely impact stem and shoot flux measure-ments. Laser-absorption-based instruments are better suited for quantifying CH4 fluxes from plant leaves and stems
than FTIR-based instruments; however, significant
interfer-ences in shoot chamber measurements could not be excluded for any of the tested instruments. Our results furthermore showed that FTIR can precisely quantify VOC mixing ra-tios and could therefore provide a method complementary to proton-transfer-reaction mass spectrometry (PTR-MS).
1 Introduction
Gas analysers based on infrared spectroscopy are increas-ingly used to study fluxes of CH4 and other trace gases
spectra for a number of potentially present gases. The capa-bilities and limitations of both instrument types remain the subject of ongoing research. In particular, the potential for biased measurements due to spectral interference with other gases still needs to be established for various environments and applications (e.g. Rella et al., 2015; Assan et al., 2017; Zhao et al., 2012; Zellweger et al., 2016).
Plants were recently identified as an important component of the natural cycles of CH4 (Keppler et al., 2006; Nisbet
et al., 2009; Carmichael et al., 2014). This has led to an in-creased interest in the role of trees in the CH4exchange of
forests (e.g. Pangala et al., 2017, 2015; Machacova et al., 2016; Pitz et al., 2018; Pitz and Megonigal, 2017). Such stud-ies require precise measurements of CH4emissions from tree
stems and shoots, by enclosing part of a plant and monitor-ing changes in the mixmonitor-ing ratio of CH4over time (Covey and
Megonigal, 2019). This monitoring of CH4mixing ratios was
traditionally conducted by collecting chamber air samples at different time points, which were then analysed by gas chro-matography (e.g. Machacova et al., 2016). More recently, portable analysers based on CRDS, OA-ICOS, or FTIR are increasingly used to measure chamber air CH4mixing ratios
directly in the field (Warner et al., 2017; Pitz and Megonigal, 2017; Pitz et al., 2018). These novel methods have facilitated easier, faster, and more precise measurements of CH4fluxes,
but have also increased vulnerability towards mismeasure-ments due to spectral interferences. This is especially im-portant in the study of CH4 emissions by plants as plants
co-emit a complex mixture of volatile organic compounds (VOCs) at fluxes 2 to 4 orders of magnitude higher than cur-rently reported CH4fluxes (Rinne et al., 2002; Simpson et al.,
1999; Tarvainen et al., 2005; Machacova et al., 2016; Pangala et al., 2017). The degree to which plant-emitted VOCs inter-fere with CH4mixing ratio measurements, however, has so
far not been evaluated.
In a recent field campaign, we conducted parallel measure-ments of tree stem CH4emissions with two distinct methane
analysers (Los Gatos Research (LGR) UGGA and GASMET DX4040). The two analysers gave contradicting results, with apparent CH4fluxes differing in both direction and
magni-tude (Fig. 1). We hypothesized that these divergent measure-ments resulted from interferences of VOCs with CH4
mea-surements. To test this hypothesis, we built a setup to quan-tify the effect of 11 different VOCs on five commonly used CH4analysers under controlled conditions. In this
communi-cation, we present results from field measurements and labo-ratory tests as well as a first sensitivity analysis for the impact of VOC interferences on measurements of CH4fluxes from
[image:2.612.310.549.66.233.2]different ecosystem compartments.
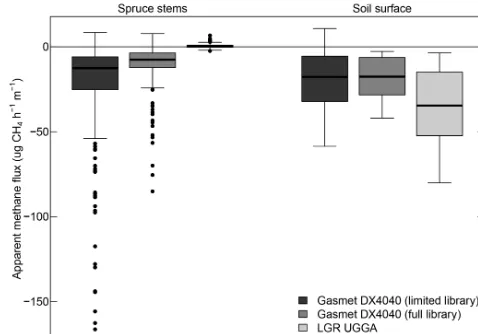
Figure 1.Apparent tree stem methane fluxes when quantified with a laser-spectroscopy-based analyser (LGR UGGA) and a FTIR-based analyser (Gasmet DX4040). FTIR-based fluxes are shown calcu-lated based on spectral deconvolution with a minimal library that did not contain VOC spectra (limited library) and with a library that contained spectra of commonly occurring VOCs (full library).
2 Methods
2.1 Field measurements
Field measurements were conducted as part of a larger field campaign in the Skogaryd research forest in southern Swe-den (58◦230N, 12◦090E) (Klemedtsson et al., 2010) in the summer of 2018. We measured spruce stem CH4emissions
from 30 trees at different distances from the main ditch to achieve a gradient of water table levels. The trees were equipped with box chambers to measure stem gas exchange as described in Machacova et al. (2016). CH4 emissions
were measured by closing chambers for 20 min and recycling air through one of two portable analysers, a Los Gatos Re-search (LGR) UGGA OA-ICOS-based CH4/CO2/H2O
anal-yser and a Gasmet DX4040 FTIR-based multi-compound analyser. CH4exchange rates were quantified as the increase
in CH4 mixing ratio over time, divided by the chamber
volume and the stem area. Negative fluxes indicate a net CH4 uptake and positive fluxes a net CH4release to the
at-mosphere. Measurements were conducted daily from 2 to 13 June and from 25 July to 5 August 2018, alternating be-tween the two instruments. In addition, we measured soil CH4 fluxes from nine soil collars (0.26 m2) using a static
2.2 Laboratory experiment 1 – qualitative screening for VOC interferences
In a first series of experiments, we qualitatively screened for VOCs that interfered with CH4 analysers. We constructed
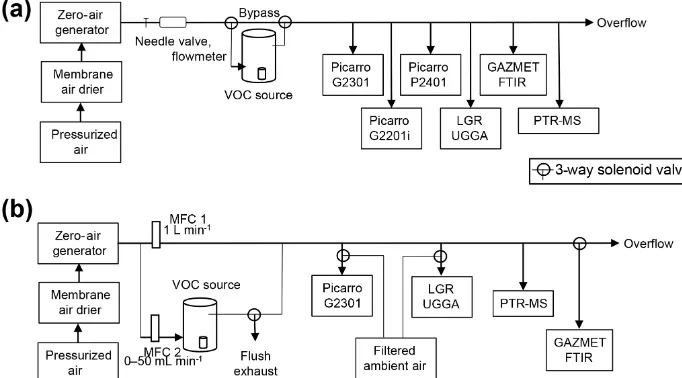
an experimental system where VOCs can be added to an air stream with a constant CH4mixing ratio (Fig. 2a). Air from
the in-house pressured air supply (compressed outdoor air) was first passed through a membrane drier (SMC IDX series) and a zero-air generator (HPZA 3500 220, Parker Balston) to remove any VOCs present in the background air. Due to a de-fect, the zero-air generator did not remove CH4from the air
source, such that the air used for our experiments contained atmospheric CH4at atmospheric mixing ratios. The air was
then passed through a needle valve and a flow meter to set and monitor its flow rate. Next, we used two electronic three-way solenoid valves (SMC VX3-series) operated through a python script to guide the air flow either through a VOC source or a bypass line. The VOC source was an open or partly open vial that contained a pure VOC standard placed in a 500 mL glass bottle. The air flow was alternatingly set to the VOC source and bypass for 2.5 min. Finally, the air flow was passed to six instruments and an overflow outlet through T-connectors. All wetted parts of the air line after the zero-air generator were either stainless steel, PTFE, or glass to pre-vent generation or removal of VOCs in the air flow path.
The flow rate of air entering the system was set slightly above the total air intake of all analysers (ap-proximately 5 Lmin−1). We tested four analysers based on laser spectroscopy (CRDS), including two stationary instru-ments (Picarro G2301 (CO2, CH4, H2O); Picarro G2201i
(13CO2, 13CH4, H2O) and two portable instruments
(Pi-carro G4301; LGR UGGA (CO2, CH4, H2O)), as well as
a Fourier-transformed infrared (FTIR) spectroscopy-based multi-compound analyser (GASMET DX4015). For control, we quantified VOC concentrations with a proton transfer reaction quadrupole mass spectrometer (PTR-MS, Ionicon Analytik GmbH). We used the system to test the interfer-ences of eight VOCs (α- andβ-pinene,13-carene, limonene, linalool, trans-2-hexenylacetate, cis-3-hexen-1-ol, nonanol, toluene, and methanol). Additional experiments with β -caryophyllene and nonanol were unsuccessful because the volatility of these compounds was too low; i.e. the mixing ratios generated for these compounds remained <50 ppbv. We chose the tested VOCs to represent a cross section of nat-urally occurring VOCs and aimed to cover a wide range of chemical compound classes rather than the most important biogenic VOCs occurring in any given environment.
The Gasmet DX4015 analyser was used in the same way it was deployed for soil flux measurements in previous stud-ies: spectra were measured over 5 s and deconvoluted based on a library with four compounds (CH4, H2O, CO2, N2O).
Measurements at all instruments were averaged over 10 s in-tervals.
2.3 Laboratory experiment 2 – quantification of VOC interferences
In a second series of experiments, we aimed to quantitatively measure VOC interferences. We modified the experimental setup such that VOC mixing ratios of the air passed to the CH4 analysers could be controlled (Fig. 2b). VOC-free air
and VOC-carrying air were regulated separately by two mass flow controllers (Bürkert GmbH) and mixed through a T-connector. The flow rate of VOC-free air was kept constant at 1 L min−1, while the flow rate of the VOC-carrying air was varied between 0 and 50 mL min−1. The resulting flow rate, however, was too low to operate more than two instruments in parallel. We therefore alternated between three CH4
anal-ysers (Picarro G2301, LGR UGGA, GASMET DX 4040) while continuously monitoring the VOC mixing ratios with the PTR-MS. For this second series of experiments, we re-placed the FTIR-based analyser with a portable but otherwise similar model (GASMET DX4040) and increased the mea-surement cycle to 1 min. The analyser was zero-calibrated with N2gas daily.
The PTR-MS was calibrated with a gas standard con-taining methanol, toluene,α-pinene (representing also other monoterpenes: β-pinene, carene, and limonene), cis-3-hexenol/hexanal, as well as other VOCs not measured in this study. The mixing ratios of the other measured compounds were calculated based on the transmission curve obtained from the calibration (Taipale et al., 2008). Instruments were challenged with both gradual increases (Fig. 4) and stepwise changes (Fig. 5) in VOC mixing ratios, with two to three rep-etitions per instrument and test type. We tested six VOCs: β-pinene,13-carene, linalool, trans-2-hexenylacetate, cis-3-hexen-1-ol, and methanol.
2.4 Data analysis
FTIR spectra were deconvoluted using the Calcmet software to quantify the concentrations of methane and other trace gases. During Experiment 1, only CO2, H2O, CH4, and N2O
were included in the spectral library (i.e. interfering VOCs were not included in the spectral library). We acknowledge that this is not a correct application of the analyser in the presence of known interference according to the manufac-turer’s guidelines. We did so to evaluate the impact of VOCs missing in the spectral library due to unexpectedly occurring VOCs, unidentified compounds, or user errors on CH4 flux
measurements.
During Experiment 2 and for the field measurements, we separately quantified the effect of adding a VOC present or missing in the spectral library. To do so, we analysed the data twice, once with a limited library (CO2, CO,
N2O, H2O, NH3) that did not contain the interfering VOCs
-Figure 2.Schematic for air flow in laboratory tests 1(a)and 2(b).
pinene, carene, linalool, hexenol, nonanal, trans-2-hexenyl acetate, caryophyllene, limonene).
Interferences were calculated as the slope between VOC mixing ratio and apparent CH4mixing ratio. To avoid effects
of transient interferences, we excluded time points where VOC mixing ratios abruptly changed (>35 % change in VOC mixing ratio per minute). Repeated challenges with the same test were combined in one regression analysis, but step-wise and gradual challenges were analysed separately. We calculated conservative estimates of uncertainty taking into consideration the uncertainty of the regression slope which already incorporates the variance among replicate tests. Our estimate of uncertainty furthermore accounts for minor vari-ation in the CH4concentrations in the in-house pressurized
air supply, which limited our ability to detect small interfer-ences. We used a bootstrap approach to calculate this uncer-tainty. For this, the measured CH4 concentrations were
re-placed by those from a random period of the same length dur-ing when no experiments were conducted (i.e. air contained no VOC at this time and all observed variations in CH4
con-centrations represented true changes in CH4concentrations).
This approach was repeated a total of 500 times. The 50th, 97.5th, and 2.5th percentiles of the slope between these sim-ulations was subtracted from the upper and lower limits of the confidence interval found in the regression analysis to ob-tain the central 95 % confidence interval for the interference. Significant interference was assumed when these confidence intervals did not include zero.
FTIR measurements with libraries that included the tested VOCs also reported concentrations for these VOCs. To eval-uate the viability of measuring VOC concentrations by FTIR, we calculated the regression between VOC concentrations measured by FTIR and PTR-MS. We note that we made no attempts to calibrate FTIR-based VOC concentration against external standards. All statistical analysis was conducted in
the statistical programming environment R version 3.4.4 (R Development Core Team, 2015). All stated uncertainties re-fer to 95 % confidence intervals.
2.5 Impact assessment for soil, stem, and shoot chambers
We assessed the potential impact of VOC interferences on CH4flux measurements in three scenarios representing soil,
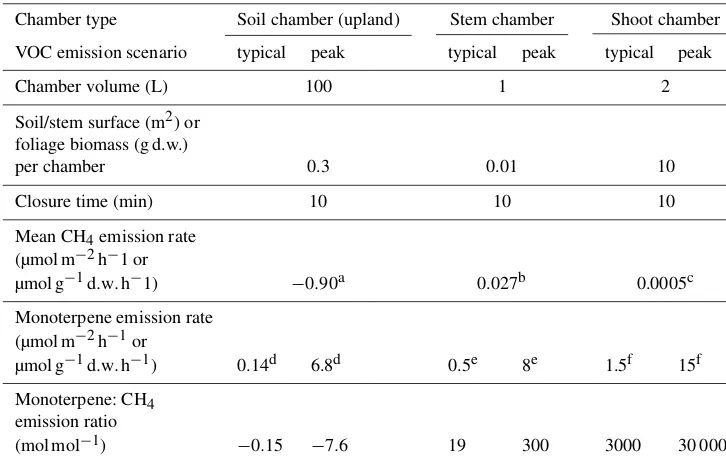
stem, and shoot chamber measurements. The assumptions used for these estimates are shown in Table 1. Chamber di-mensions and CH4 and VOC flux rates were chosen based
on measurements conducted at SMEAR II LTER field sta-tion (Hyytiälä, Finland) (Hari and Kulmala, 2005).
Only monoterpenes (PTR/MS signal at m/z 137) were taken into account, and it was assumed that these VOCs uni-formly interfered with CH4 measurements at the same rate
as β-pinene. We furthermore assumed that VOC emission rates remain constant over the chamber closure time, i.e. that chamber headspace VOC mixing ratios do not approach sat-uration during the closure. While this assumption is unlikely to hold true for shoot chambers, it allows us to conduct a worst case estimate for VOC interferences. For each cham-ber type, we assessed the effects of VOC emissions at typi-cal (i.e. average) as well as peak (maximum) emission rates. For FTIR, we estimated the effects of both VOCs present in the spectral library (interference measured on DX4040 with a full library) and VOCs missing in the spectral library (in-terference on DX4040 with a limited library).
Based on these assumptions, we calculated the actual change in CH4mixing ratios during a chamber closure, the
VOC mixing ratio reached at the end of the chamber closure, the upper limit to the apparent CH4mixing ratio measured
[image:4.612.128.469.68.257.2]Table 1.Assumptions used to estimate VOC effects on CH4flux measurements in static soil, stem, and shoot chambers. Where available, assumptions are based on measurements conducted in the Scots pine forest at the SMEAR II research station (Hyytiälä, Finland).
Chamber type Soil chamber (upland) Stem chamber Shoot chamber
VOC emission scenario typical peak typical peak typical peak
Chamber volume (L) 100 1 2
Soil/stem surface (m2) or foliage biomass (g d.w.)
per chamber 0.3 0.01 10
Closure time (min) 10 10 10
Mean CH4emission rate (µmol m−2h−1 or
µmol g−1d.w.h−1) −0.90a 0.027b 0.0005c
Monoterpene emission rate (µmol m−2h−1or
µmol g−1d.w.h−1) 0.14d 6.8d 0.5e 8e 1.5f 15f
Monoterpene: CH4
emission ratio
(mol mol−1) −0.15 −7.6 19 300 3000 30 000
Sources:aMachacova et al. (2016);bMachacova et al. (2016).cEstimate based on Keppler et al. (2006);dAaltonen et al. (2013);eVanhatalo et al. (2015), Rissanen et al. (2016);fTarvainen et al. (2005).
this is only a preliminary assessment of the impact of VOC interferences on CH4flux measurements, as neither the
iden-tity of all emitted VOCs nor their interference on different analysers is fully known. These results of these calculations should therefore be understood as order-of-magnitude esti-mates.
3 Results
3.1 Initial analysis of field data
Our initial spruce stem measurements showed a stark dis-crepancy between stem CH4 emissions measured with the
LGR UGGA and GASMET DX4040 analysers. Measure-ments conducted with the LGR UGGA ranged from an ap-parent CH4 uptake of−2 µg CH4h−1m−2 and an apparent
CH4 emission of 7 µg CH4h−1m−2(Fig. 1). Measurements
conducted with the DX4040 (limited spectral library) consis-tently showed an apparent CH4uptake ranging with a much
larger flux (−145 to+8 µg CH4h−1m−2). The average CH4
fluxes were+0.44±0.15 µg CH4h−1m−2(LGR UGGA) and
−17.4±3.7 µg CH4h−1m−2 (GASMET DX4040). In
con-trast, both analysers measured similar soil CH4fluxes, with
average fluxes of −36.0±7.9 (LGR UGGA) and−19.4± 5.3 µg CH4h−1m−2(GASMET DX4040).
3.2 Qualitative screening for interferences
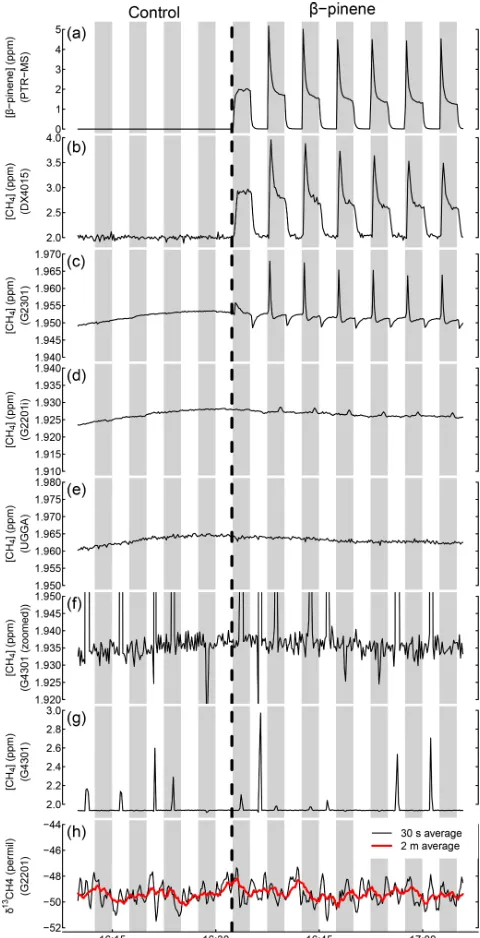
An example of the changes in VOC mixing ratios over time produced by our setup is shown in Fig. 3a. The installation was first operated without a VOC present in the source to control for artefacts (e.g. effects of pressure changes due to switching valves). At the time point indicated by the verti-cal dashed line, a vial withβ-pinene was inserted into the VOC source. This resulted in periodic patterns of presence and absence ofβ-pinene in the analysed air stream, with a maximum mixing ratio of approximately 5 ppmv.
The response of the CH4 analysers to the changing β
-pinene mixing ratios is depicted in Fig. 3b–h. The FTIR-based analyser (DX4040) showed the strongest interference, with CH4readings reaching by up to 4 ppmv whenβ-pinene
was added to the air stream, i.e. 2 ppmv above the actual CH4
mixing ratio (Fig. 3b). In contrast, measured CH4mixing
ra-tios remained stable around 2 ppmv when the setup was op-erated with an empty vial in the VOC source, demonstrating that the observed interferences were not artefacts produced by the experimental setup (i.e. pressure effects).
The Picarro G2301 analyser exhibited moderate interfer-ences bychangesin VOC mixing ratios (Fig. 3c). The sudden increase in theβ-pinene mixing ratios resulted in temporary positive deviations corresponding to 20 ppbv CH4ppmv−1β
Figure 3. Exemplary results from Experiment 1, shown for tests conducted withβ-pinene. The panels show the development of the β-pinene(a)mixing ratio as measured by PTR-MS and the appar-ent CH4mixing ratio as measured by Gasmet DX4015 (using an
incomplete library intended for soil flux measurements), Picarro G2301, Picarro G2201i, LGR UGGA, and Picarro G4301 (b–g)
andδ13C–CH4values as measured by Picarro G2201i(h). White
areas indicate the times when the system was set to bypass the VOC source, grey shaded areas times when the VOC source was online. During the control period left of the dashed vertical line the VOC source was empty. At the position of the dashed vertical line, the β-pinene vial was introduced into the standard source. Black line represents the 10 s moving average of apparent CH4mixing ratios
andδ13CCH4 values, red thick line the 30 s moving average of ap-parentδ13CCH4 values. Notice G4401 results zoomed in panel(f) to visualize background variation; full-scale results in panel(g).
and the Picarro G4301 instruments showed no discernible ef-fect of the addition ofβ-pinene to the air stream (Fig. 3e–f); however, for the G4301 analyser this was because relatively high noise and occasional outliers in the measured CH4
mix-ing ratio may have masked potential small interferences. Fi-nally, we did not detect any interference ofβ-pinene with the measuredδ13CCH4values (Fig. 3g).
An overview of the interference tests with other VOCs is provided in Table 2. Among the 11 tested compounds, 9 showed an interference with the DX4015 analyser, 8 with the Picarro G2301, 6 with the Picarro G2201i, and 3 with the LGR UGGA. Interferences on the DX4015 were typically 2 orders of magnitude higher than on laser-absorption-based analysers. All interferences with CH4mixing ratio
measure-ments on the Picarro G2301 and G2201i instrumeasure-ments were transient, similar to those shown forβ-pinene (Fig. 3c).
Only two VOCs interfered withδ13CCH4measurements by
the Picarro G2201. First, toluene, which was added at high mixing ratios (30 000–35 000 ppmv), led to an apparent in-crease inδ13CCH4values by 1 ‰. Second, an accidental
addi-tion of high mixing ratios of methanol (>80 000 ppbv, likely higher due to saturation of the PTR-MS) strongly interfered withδ13CCH4 measurements, leading to a positive deviation by about 900 ‰ with a memory effect that lasted more than 2 h (not shown).
3.3 Quantification of interferences
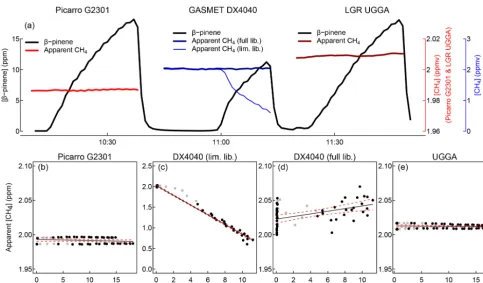
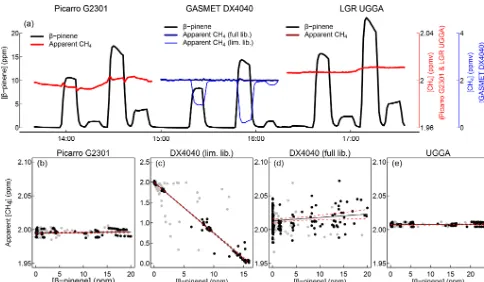
In our second experiment, we successfully created gradual and stepwise changes in VOC mixing ratios. As an exam-ple, the effects of gradual and stepwise changes inβ-pinene mixing ratios on the apparent CH4 mixing ratios measured
by three different analysers are shown in Figs. 4a and 5a, respectively. In this experiment, we did not detect a signifi-cant effect ofβ-pinene mixing ratios on CH4mixing ratios
measured with the Picarro G2301 (Figs. 4b, 5b) or the LGR UGGA instruments (Figs. 4e, 5e). In contrast,β-pinene led to a significant underestimation of CH4mixing ratios with the
Gasmet DX4040 (by approximately 120 ppbv CH4ppmv−1
β-pinene) whenβ-pinene was not part of the spectral library (Figs. 4c, 5c). Includingβ-pinene (and other VOCs) in the spectra library significantly reduced this interference to ap-proximately 1 ppbv CH4ppmv−1β-pinene (Figs. 4d, 5d).
Similar results were found in tests with other VOCs. A list of the interferences quantified in different experiments is provided in Table 3. We did not detect a significant ef-fect of VOC mixing ratios on the apparent CH4mixing ratios
measured by the Picarro G2301 and the LGR UGGA. Forβ -pinene and13-carene we constrained the upper confidence limits to <1 ppbv CH4ppmv−1 VOC on both instruments;
for other compounds confidence limits were higher, mainly due to lower mixing ratios during the tests.
(cis-3-Table 2.Summary of interferences detected in qualitative tests.
Compound Interference (ppbv apparent CH4)
name conc. range (ppbv) Gasmet Picarro Picarro Picarro LGR
[ion] DX4015 G2301 G2201i G4301 UGGA
Methanol 6000–10 000 [33] 500–700 15a 2a – 2
α-pinene 4000–5000 [137] 1500–2000 10–15a 1a – –
β-pinene 5000–15 000 [137] 2000 5–30a 1a – –
13-carene 3000–7000 [137] 7000–12 000 – – –
R(+)limonene 900–1100 [137] 400–500 5a – – –
Linalool 7000–12 000 [155] 300–600 8–25a 3–8a – 0–8
Cis-3-hexen-1-ol 20–60 [101] 600–3000 10–15a – – –
Trans-2-hexenyl acetate 500–2000 [143] 600–2600 10–50a 2–12a – –
Toluene 30 000–35 000 [93] 5000–10 000 200–250a 15–20a – 2
– not detected
[image:7.612.92.504.97.249.2]aTransient interference triggered by change in VOC mixing ratio rather than presence of VOC
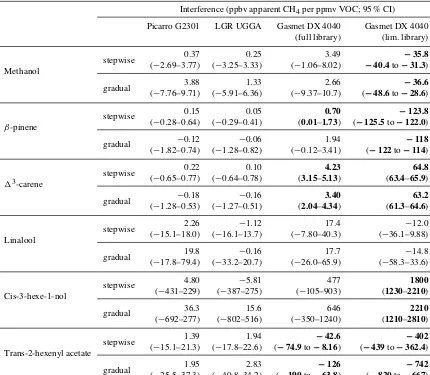
Table 3.Quantified interferences of volatile organic compounds on CH4analysers. Significant interferences are indicated in bold.
Interference (ppbv apparent CH4per ppmv VOC; 95 % CI)
Picarro G2301 LGR UGGA Gasmet DX 4040 Gasmet DX 4040 (full library) (lim. library)
Methanol
stepwise 0.37 0.25 3.49 −35.8
(−2.69–3.77) (−3.25–3.33) (−1.06–8.02) −40.4to−31.3)
gradual 3.88 1.33 2.66 −36.6
(−7.76–9.71) (−5.91–6.36) (−9.37–10.7) (−48.6to−28.6)
β-pinene
stepwise 0.15 0.05 0.70 −123.8
(−0.28–0.64) (−0.29–0.41) (0.01–1.73) (−125.5to−122.0)
gradual −0.12 −0.06 1.94 −118
(−1.82–0.74) (−1.28–0.82) (−0.12–3.41) (−122to−114)
13-carene
stepwise 0.22 0.10 4.23 64.8
(−0.65–0.77) (−0.64–0.78) (3.15–5.13) (63.4–65.9)
gradual −0.18 −0.16 3.40 63.2
(−1.28–0.53) (−1.27–0.51) (2.04–4.34) (61.3–64.6)
Linalool
stepwise 2.26 −1.12 17.4 −12.0
(−15.1–18.0) (−16.1–13.7) (−7.80–40.3) (−36.1–9.88)
gradual 19.8 −0.16 17.7 −14.8
(−17.8–79.4) (−33.2–20.7) (−26.0–65.9) (−58.3–33.6)
Cis-3-hexe-1-nol
stepwise 4.80 −5.81 477 1800
(−431–229) (−387–275) (−105–903) (1230–2210)
gradual 36.3 15.6 646 2210
(−692–277) (−802–516) (−350–1240) (1210–2810)
Trans-2-hexenyl acetate
stepwise 1.39 1.94 −42.6 −402
(−15.1–21.3) (−17.8–22.6) (−74.9to−8.16) (−439to−362.4)
gradual 1.95 2.83 −126 −742
[image:7.612.85.515.330.705.2]Figure 4.Quantitative measurements of the effect ofβ-pinene mixing ratios on measured (apparent) methane mixing ratios when analysers were challenged with a gradual increase in theβ-pinene mixing ratio. The figure depicts an example of the time course ofβ-pinene and apparent CH4mixing ratios(a)as well as the relationship betweenβ-pinene and the measured CH4mixing ratio(b–e). Note that in(a), CH4
concentrations measured by the Gasmet DX4040 analyser are depicted on a different scale (blue) than those measured by the Picarro G2301 and LGR UGGA analysers (red). Black lines in panels(b)–(e)indicate linear regressions, dashed red lines the 95 % confidence interval of these regressions. Data points that occurred after rapid changes in theβ-pinene mixing ratio and that were therefore excluded from the regression analysis are depicted in grey.
hexen-1-ol). Adding reference spectra of the tested VOCs to the library substantially decreased the interferences, but sig-nificant interferences were still detected for β-pinene,13 -carene, and hexenylacetate (Table 3).
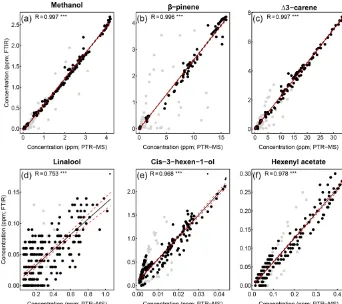
FTIR- and PTR-MS-based measurements of VOC mix-ing ratios were highly correlated (R=0.956 to 0.998) for most compounds (Fig. 6). Poor correlations were found for linalool, which was present at mixing ratios close to or below the detection limit of the FTIR method (10 ppbv).
3.4 Revised analysis of field data
After re-analysis with the full library, our field measurements by FTIR showed smaller CH4fluxes than in our initial
anal-ysis (Fig. 1). The methane emission rates generated in this revised analysis (−85 to+8 µg CH4h−1m−2), however, still
showed a substantial net uptake of CH4. The average
ap-parent CH4flux was−10.1±1.6 µg CH4h−1m−2. Assuming
that measurements conducted by OA-ICOS revealed the true CH4 flux, the re-analysis decreased the bias in FTIR-based
measurements by 41 %. In contrast, the re-analysed soil CH4fluxes resulted in slightly lower average flux (−19.1±
6.1 µg CH4h−1m−2) compared to initial measurements with
the limited library (−19.4±5.3 µg CH4h−1m−2).
3.5 Estimated impact on static chamber systems on different ecosystem compartments
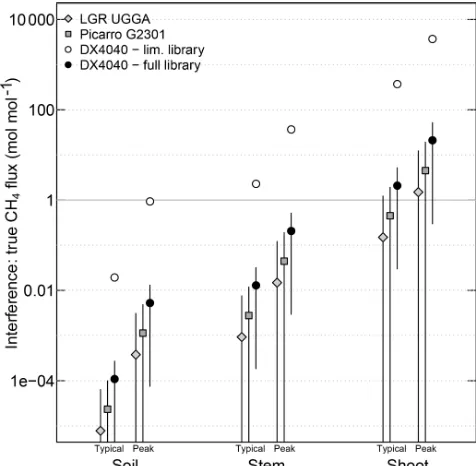
VOC (monoterpene) to methane emission ratios increased from soil to stem to shoot chambers, spanning over 4 or-ders of magnitude (Table 1). The practical impact of VOC interferences on CH4 flux measurements therefore differed
strongly between ecosystem compartments. True CH4fluxes
typically exceeded apparent CH4 fluxes due to VOC
inter-ferences by 2 or more orders of magnitude in soil chambers, whereas the upper limit of apparent CH4fluxes was equal to
or greater than true fluxes in shoot chambers (Fig. 7, Table 4). Our impact estimates suggest that all the analysers were able to accurately (<5 % measurement error) quantify soil CH4 fluxes at average VOC emission rates, even if
impor-tant VOCs are missing in the FTIR spectral library (Fig. 7). Stem flux measurements, in contrast, are more vulnerable to VOC interferences, with upper limits of confidence of the or-der of 2 %–6 % of the actual CH4flux, except for FTIR with
Figure 5.Quantitative measurements of the effect ofβ-pinene mixing ratios on measured (apparent) methane mixing ratios when analysers were challenged with stepwise changes in theβ-pinene mixing ratio. The figure depicts an example of the time course ofβ-pinene and apparent CH4mixing ratios(a)as well as the relationship betweenβ-pinene and the measured CH4mixing ratio(b–e). Note that in(a), CH4
concentrations measured by the Gasmet DX4040 analyser are depicted on a different scale (blue) than those measured by the Picarro G2301 and LGR UGGA analysers (red). Black lines in panels(b)–(e)indicate linear regressions, dashed red lines the 95 % confidence interval of these regressions. Data points that occurred after rapid changes in theβ-pinene mixing ratio and that were therefore excluded from the regression analysis are depicted in grey.
Table 4.Estimated impact of VOC interferences on methane flux measurements based on literature data of CH4and VOC fluxes.
Chamber type Soil chamber (upland) Stem chamber Shoot chamber
VOC emission scenario typical peak typical peak typical peak
1Monoterpenea(ppbv) 1.7 82 20 320 30 000 300 000
Actual1CH4
b(ppbv) 11 11 11
Max. interferencec Picarro G2301 0.0031 0.15 0.037 0.59 55 550
(ppbv CH4) LGR UGGA 0.0021 0.11 0.026 0.41 39 390
DX4040 (lim. library) 0.0058 0.28 0.069 1.1 100 1000
DX4040 (full library) 0.21 10 2.5 40 3 700 37 000
Max. interference: actual fluxd Picarro G2301 0.00028 0.014 0.034 0.54 5.5 55
LGR UGGA 0.00020 0.0097 0.024 0.38 3.8 38
DX4040 (lim. library) 0.00053 0.027 0.063 1.0 10 100
DX4040 (full library) 0.19 0.92 2.3 36 370 3700
aMonoterpene mixing ratios at the end of a chamber closure, estimated based on the flux rates, chamber characteristics, and closure times stated in Table 1. We assumed that fluxes remained constant throughout the chamber closure period. Monoterpene saturation in the chamber headspace may decrease monoterpene emission rates during chamber closure.
bChange in CH
4mixing ratio during chamber closure, estimated based on assumptions stated in Table 1, estimated based on the flux rates, chamber characteristics, and closure times stated in Table 1.
cUpper confidence interval for the false1CH
4detected due to monoterpene interference with CH4mixing ratio measurements. dRatio of the error in CH
[image:9.612.59.533.463.634.2]Figure 6.Correlation between FTIR- and PTR-MS-based measurements of VOC mixing ratios. Data points plotted in grey were excluded after rapid changes in the VOC mixing ratio. Asterisks indicate significant levels: *p <0.05; **p <0.01; ***p <0.001.
were estimated to exceed the interference may exceed actual fluxes several fold.
VOC interferences are a serious challenge for quantifying CH4flux in shoot chambers where VOC fluxes are
approx-imately 4 orders of magnitude higher than CH4fluxes. Our
results show that apparent fluxes due to VOC interferences can exceed actual fluxes when shoot CH4 fluxes are
mea-sured by FTIR, even if all VOCs are included in the spectral library. While we were not able to detect significant VOC in-terferences on OA-ICOS and CRDS-based analysers, the up-per limit of uncertainty of these interferences still allows for interferences that exceed actual CH4 fluxes in shoot
cham-bers.
4 Discussion
4.1 FTIR-based analysers
Our results show that FTIR-based analysers are not well suited for measuring plant CH4 fluxes and other
applica-tions that quantify small changes in CH4 mixing ratios in
the presence of much larger changes in the mixing ratios of other compounds, as is the case for plant CH4flux
measure-ments (Table 4, Fig. 7). In particular, our work emphasizes
that FTIR-based CH4 flux measurements can only provide
reliable data if all VOCs that were co-emitted in relevant amounts are identified and included in the spectral library.
Measurements of plant CH4 emissions with
incom-plete spectral libraries can result in gross over- or under-estimations of the actual CH4 flux rates depending on the
combination of co-emitted VOCs as well as the components included in the spectral library used to deconvolute the mea-sured spectra. The presence of VOCs missing in the spec-tral library is typically indicated by high residual values for the spectral fitting; such measurements should be re-analysed with an amended spectral library or, if this is not possi-ble, considered invalid. Spectral libraries compiled for soil flux measurements are not sufficient for quantifying CH4
fluxes from tree stems. Had we solely relied on an FTIR system with an incomplete spectral library intended from soil flux measurements to quantify CH4 fluxes during our
field campaign in Skogaryd, we would have identified spruce stems as a strong sink of CH4(Fig. 1). However, concurrent
measurements by the OA-ICOS-based LGR UGGA, which were largely unaffected by VOC co-emissions (Table 3), re-vealed that these trees stems actually act as a small source of CH4. The comparison of OA-ICOS- and FTIR-based
Figure 7.Estimated size of the CH4flux measurement error due
to VOC interference (at typical and peak VOC fluxes) relative to the mean actual CH4fluxes in soil, stem, and shoot chambers.
As-sumptions underlying these estimates are shown in Table 1. Only monoterpenes (m/z137 in PTR-MS measurements) were taken into account for this estimate, and it was assumed that all monoter-penes interfere with CH4analysers at the same rate asβ-pinene. The results presented here should therefore be understood as order-of-magnitude estimates. Symbols indicate medians with error bars indicate the analytical uncertainty (95 % confidence interval) asso-ciated with the quantification of VOC interferences, but do not take into account uncertainties in other assumptions.
FTIR-based CH4flux measurements, including methanol,β
-pinene, and hexenylacetate. The effect of these VOCs out-weighed the positive interference of other VOCs including 13-carene and hexenol. It is, however, important to note that we did not quantify the interferences of all potential VOCs, including the dominant compound emitted by spruce trees (α-pinene) (Grabmer et al., 2006; Janson, 1993).
Our second experiment further showed that the VOC in-terferences can be minimized by including all potentially oc-curring VOCs in the spectral library. In our experiments, this decreased the interference by 1–2 orders of magnitude (Ta-ble 3). This, however, may not be practical in many field settings, where the identity of VOCs released from plants and soils is often unknown. Furthermore, spectral decon-volution was not successful for all VOCs, and significant interferences were found for three of the tested VOCs (β -pinene,13-carene, and hexenyl acetate) even when the refer-ence spectra were present in the spectral library. Upper lim-its for the quantified interferences in FTIR-based measure-ments were typically an order of magnitude higher than on laser-absorption-based instruments. In the case of our field
campaign in Skogaryd, on average 59 % of the interference persisted when data were re-analysed with additional spectra in the library (Fig. 1).
In contrast, FTIR- and OA-ICOS-based analysers mea-sured similar CH4 fluxes from soil chambers. This shows
that both measurement principles can reliably quantify soil CH4 fluxes, where the VOC:methane flux ratio is
signifi-cantly lower than in tree stems and shoots, which is consis-tent with previous studies (e.g. Falk et al., 2014). Our study furthermore showed that FTIR-based analysis may be a use-ful method to study VOC fluxes instead of or in addition to PTR-MS measurements. The strong correlation between VOC mixing ratios quantified by FTIR and PTR-MS (Fig. 6) indicates that FTIR can conduct precise measurements of VOC mixing ratios. FTIR instruments are cheaper and more portable than PTR-MS instruments and provide a comple-mentary analytical principle that could help distinguish be-tween isomers that cannot be separated by mass spectrom-etry. Detection limits of FTIR-based measurements of VOC mixing ratios (tens of ppb), however, are substantially higher than those of PTR-MS-based measurements (tens of ppt), and cross sensitivities among VOCs may bias the quantifi-cation of compounds that occur at lower mixing ratios.
4.2 Laser-spectroscopy-based analysers
Interferences on the CRDS- and OA-ICOS-based systems were significantly lower than on FTIR-based systems, but during our qualitative screening we still detected some po-tentially important interferences (Fig. 3), especially the case for the Picarro G2301. On this analyser, sudden changes in the VOC mixing ratio resulted in minor deviations of the measured CH4mixing ratios. These interferences, however,
were corrected by the instrument over the course of approxi-mately 30 s and are therefore unlikely to affect chamber mea-surements, where mixing ratios of VOCs and CH4increase
gradually (e.g. over a 20–40 min chamber closure). These in-terferences may, however, pose an important bias for mea-surements that rely on fast meamea-surements of air masses with changing VOC mixing ratios as used for eddy covariance (EC) measurements. In these measurements, interferences from VOC emissions as detected in this study could poten-tially lead to an overestimation of CH4emissions. We have,
however, not been able to further investigate VOC interfer-ences on the high-frequency analysers used for EC measure-ments.
5 Conclusions
We quantified the interference of VOCs on CH4 analysers
anal-ysers are therefore not well suited for studies of plant CH4
fluxes and other applications where small CH4fluxes need to
be quantified in the presence of much higher fluxes of VOCs. Our results, however, also indicate that FTIR instruments can be a cost-effective solution to field measurements of certain VOCs.
Code and data availability. Raw data, processed data, and code are available at https://doi.org/10.5281/zenodo.2597716 (Kohl et al., 2019).
Author contributions. LK had the main responsibility for analysing the data and writing the manuscript, and participated in the design and construction of the measurement setup. MK had the main re-sponsibility for designing the measurement setup and programming the controlling software, and participated in constructing the mea-surement setup and in the writing process. KR had the main respon-sibility for the VOC measurements and processing of PTR-MS re-sults. IH had the main responsibility for the field campaign and had the original idea for testing the interference of VOCs in CH4
anal-ysers, and participated in designing the measurement setup. TP had the main responsibility for constructing the measurement setup and participated in designing the measurement setup. HH contributed to the conceptualization of the study and was responsible for decid-ing on and providdecid-ing the measured VOCs. MP contributed to the conceptualization of the study and the writing of the manuscript.
Competing interests. The authors declare that they have no conflict of interest.
Acknowledgements. We thank Gasmet Technologies Oy and An-nalea Lohila for providing access to FTIR analysers.
Financial support. This research has been supported by the European Research Council under the European Union’s Horizon 2020 research and innovation programme (grant no. 757695) and the Academy of Finland, Biotieteiden ja Ympäristön Tutkimuksen Toimikunta (grant nos. 319329 and 2884941).
Open access funding provided by Helsinki University Library.
Review statement. This paper was edited by Helge Niemann and reviewed by two anonymous referees.
References
Aaltonen, H., Aalto, J., Kolari, P., Pihlatie, M., Pumpanen, J., Kul-mala, M., Nikinmaa, E., Vesala, T., and Bäck, J.: Continuous VOC flux measurements on boreal forest floor, Plant Soil, 369, 241–256, https://doi.org/10.1007/s11104-012-1553-4, 2013.
Assan, S., Baudic, A., Guemri, A., Ciais, P., Gros, V., and Vo-gel, F. R.: Characterization of interferences to in situ observa-tions ofδ13CH4and C2H6when using a cavity ring-down spec-trometer at industrial sites, Atmos. Meas. Tech., 10, 2077–2091, https://doi.org/10.5194/amt-10-2077-2017, 2017.
Carmichael, M. J., Bernhardt, E. S., Bräuer, S. L., and Smith, W. K.: The role of vegetation in methane flux to the atmo-sphere: Should vegetation be included as a distinct category in the global methane budget?, Biogeochemistry, 119, 1–24, https://doi.org/10.1007/s10533-014-9974-1, 2014.
Covey, K. R. and Megonigal, J. P.: Methane production and emissions in trees and forests, New Phytologist, 222, 35–51, https://doi.org/10.1111/nph.15624, 2019.
Etiope, G.: Detecting and Measuring Gas Seepage, in: Natural Gas Seepage, pp. 63–84, Springer International Publishing, Cham, https://doi.org/10.1007/978-3-319-14601-0_4, 2015.
Falk, J. M., Schmidt, N. M., and Ström, L.: Effects of simulated increased grazing on carbon allocation patterns in a high arctic mire, Biogeochemistry, 119, 229–244, https://doi.org/10.1007/s10533-014-9962-5, 2014.
Franz, D., Acosta, M., Altimir, N., Arriga, N., Arrouays, D., Aubi-net, M., Aurela, M., Ayres, E., López-Ballesteros, A., Barbaste, M., Berveiller, D., Biraud, S., Boukir, H., Brown, T., Brümmer, C., Buchmann, N., Burba, G., Carrara, A., Cescatti, A., Ceschia, E., Clement, R., Cremonese, E., Crill, P., Darenova, E., Dengel, S., D’Odorico, P., Gianluca, F., Fleck, S., Fratini, G., Fuß, R., Gielen, B., Gogo, S., Grace, J., Graf, A., Grelle, A., Gross, P., Grünwald, T., Haapanala, S., Hehn, M., Heinesch, B., Heiska-nen, J., Herbst, M., Herschlein, C., Hörtnagl, L., Hufkens, K., Ibrom, A., Jolivet, C., Joly, L., Jones, M., Kiese, R., Klemedts-son, L., Kljun, N., Klumpp, K., Kolari, P., Kolle, O., Kowalski, A., Kutsch, W., Laurila, T., Ligne, A. D., Linder, S., Lindroth, A., Lohila, A., Longdoz, B., Mammarella, I., Manise, T., Marañon-Jimenez, S., Matteucci, G., Mauder, M., Meier, P., Merbold, L., Mereu, S., Metzger, S., Migliavacca, M., Mölder, M., Montag-nani, L., Moureaux, C., Nelson, D., Nemitz, E., Nicolini, G., Nilsson, M., Beeck, M. O. d., Osborne, B., Löfvenius, M. O., Pavelka, M., Peichl, M., Peltola, O., Pihlatie, M., Pitacco, A., Pokorny, R., Pumpanen, J., Ratié, C., Schrumpf, M., Sedlák, P., Ortiz, P. S., Siebicke, L., Šigut, L., Silvennoinen, H., Simioni, G., Skiba, U., Sonnentag, O., Soudani, K., Soulé, P., Steinbrecher, R., Tallec, T., Thimonier, A., Tuittila, E., Tuovinen, J., Vestin, P., Vincent, G., Vincke, C., Vitale, D., Waldner, P., Weslien, P., Wingate, L., Wohlfahrt, G., Zahniser, M., and Vesala, T.: To-wards long-term standardised carbon and greenhouse gas obser-vations for monitoring Europe’s terrestrial ecosystems: a review, Int. Agrophys., 32, 439–455, https://doi.org/10.1515/intag-2017-0039, 2018.
Grabmer, W., Kreuzwieser, J., Wisthaler, A., Cojocariu, C., Graus, M., Rennenberg, H., Steigner, D., Steinbrecher, R., and Hansel, A.: VOC emissions from Norway spruce (Picea abies L. [Karst]) twigs in the field – Results of a dynamic enclosure study, Atmos. Environ., 40, 128–137, https://doi.org/10.1016/J.ATMOSENV.2006.03.043, 2006. Hari, P. and Kulmala, M.: Station for Measuring Ecosystem–
Janson, R. W.: Monoterpene emissions from Scots pine and Norwegian spruce, J. Geophys. Res.-Atmos., 98, 2839–2850, https://doi.org/10.1029/92JD02394, 1993.
Jurasinski, G., Huth, V., Hofmann, M., Schmidt, M., and Hofmann, J.: Comparing laser-based gas analyzers for greenhouse gas mea-surements with closed chambers – precision and field applicabil-ity, in: European Geosciences Union General Assembly, vol. 21, p. 11049, 2019.
Kandel, T. P., Gowda, P. H., Somenahally, A., Northup, B. K., DuPont, J., and Rocateli, A. C.: Nitrous oxide emissions as influenced by legume cover crops and ni-trogen fertilization, Nutr. Cycl. Agroecosys., 112, 119–131, https://doi.org/10.1007/s10705-018-9936-4, 2018.
Keppler, F., Hamilton, J. T. G., Braß, M., and Röck-mann, T.: Methane emissions from terrestrial plants under aerobic conditions, Nature, 439, 187–191, https://doi.org/10.1038/nature04420, 2006.
Klemedtsson, L., Ernfors, M., Björk, R. G., Weslien, P., Rütting, T., Crill, P., and Sikström, U.: Reduction of greenhouse gas emis-sions by wood ash application to a Picea abies (L.) Karst. for-est on a drained organic soil, Eur. J. Soil Sci., 61, 734–744, https://doi.org/10.1111/j.1365-2389.2010.01279.x, 2010. Kohl, L., Koskinen, M., Rissanen, K., Haikarainen, I., Polvoinen,
T., Hellén, H., and Pihlatie, M.: Technical note: Interfer-ences of volatile organic compounds (VOC) on methane concentration measurements – Raw Data, Data set, Zenodo, https://doi.org/10.5281/zenodo.2597716, 2019.
Machacova, K., Bäck, J., Vanhatalo, A., Halmeenmäki, E., Ko-lari, P., Mammarella, I., Pumpanen, J., Acosta, M., Urban, O., and Pihlatie, M.: Pinus sylvestris as a missing source of ni-trous oxide and methane in boreal forest, Sci. Rep.-UK, 6, 1–8, https://doi.org/10.1038/srep23410, 2016.
Nisbet, R. E., Fisher, R., Nimmo, R. H., Bendall, D. S., Crill, P. M., Gallego-Sala, A. V., Hornibrook, E. R., López-Juez, E., Lowry, D., Nisbet, P. B., Shuckburgh, E. F., Sriskan-tharajah, S., Howe, C. J., and Nisbet, E. G.: Emission of methane from plants, P. Roy. Soc. B, 276, 1347–1354, https://doi.org/10.1098/rspb.2008.1731, 2009.
Pangala, S. R., Hornibrook, E. R., Gowing, D. J., and Gauci, V.: The contribution of trees to ecosystem methane emissions in a tem-perate forested wetland, Global Change Biol., 21, 2642–2654, https://doi.org/10.1111/gcb.12891, 2015.
Pangala, S. R., Enrich-Prast, A., Basso, L. S., Peixoto, R. B., Bastviken, D., Hornibrook, E. R., Gatti, L. V., Marotta, H., Calazans, L. S. B., Sakuragui, C. M., Bastos, W. R., Malm, O., Gloor, E., Miller, J. B., and Gauci, V.: Large emissions from floodplain trees close the Amazon methane budget, Nature, 552, 230–234, https://doi.org/10.1038/nature24639, 2017.
Pitz, S. and Megonigal, J. P.: Temperate forest methane sink di-minished by tree emissions, New Phytol., 214, 1432–1439, https://doi.org/10.1111/nph.14559, 2017.
Pitz, S. L., Megonigal, J. P., Chang, C. H., and Szlavecz, K.: Methane fluxes from tree stems and soils along a habitat gradient, Biogeochemistry, 137, 307–320, https://doi.org/10.1007/s10533-017-0400-3, 2018.
Rapson, T. D. and Dacres, H.: Analytical techniques for measuring nitrous oxide, TrAC Trends in Analytical Chemistry, 54, 65–74, https://doi.org/10.1016/J.TRAC.2013.11.004, 2014.
R Development Core Team: R: A Language and Environment for Statistical Computing, available at: http://www.r-project.org (last access: 2 September 2019), 2015.
Rella, C. W., Hoffnagle, J., He, Y., and Tajima, S.: Local- and regional-scale measurements of CH4,δ13CH4, and C2H6in the
Uintah Basin using a mobile stable isotope analyzer, Atmos. Meas. Tech., 8, 4539–4559, https://doi.org/10.5194/amt-8-4539-2015, 2015.
Rinne, H., Guenther, A., Greenberg, J., and Harley, P.: Isoprene and monoterpene fluxes measured above Amazonian rainforest and their dependence on light and temperature, Atmos. Environ., 36, 2421–2426, https://doi.org/10.1016/S1352-2310(01)00523-4, 2002.
Rissanen, K., Hölttä, T., Vanhatalo, A., Aalto, J., Nikinmaa, E., Rita, H., and Bäck, J.: Diurnal patterns in Scots pine stem oleoresin pressure in a boreal forest, Plant Cell Environ., 39, 527–538, https://doi.org/10.1111/pce.12637, 2016.
Simpson, D., Winiwarter, W., Börjesson, G., Cinderby, S., Ferreiro, A., Guenther, A., Hewitt, C. N., Janson, R., Khalil, M. A. K., Owen, S., Pierce, T. E., Puxbaum, H., Shearer, M., Skiba, U., Steinbrecher, R., Tarrasón, L., and Öquist, M. G.: Inventorying emissions from nature in Europe, J. Geophys. Res.-Atmos., 104, 8113–8152, https://doi.org/10.1029/98JD02747, 1999.
Taipale, R., Ruuskanen, T. M., Rinne, J., Kajos, M. K., Hakola, H., Pohja, T., and Kulmala, M.: Technical Note: Quanti-tative long-term measurements of VOC concentrations by PTR-MS – measurement, calibration, and volume mixing ra-tio calculara-tion methods, Atmos. Chem. Phys., 8, 6681–6698, https://doi.org/10.5194/acp-8-6681-2008, 2008.
Tarvainen, V., Hakola, H., Hellén, H., Bäck, J., Hari, P., and Kulmala, M.: Temperature and light dependence of the VOC emissions of Scots pine, Atmos. Chem. Phys., 5, 989–998, https://doi.org/10.5194/acp-5-989-2005, 2005.
Teutscherova, N., Vazquez, E., Arango, J., Arevalo, A., Benito, M., and Pulleman, M.: Native arbuscular my-corrhizal fungi increase the abundance of ammonia-oxidizing bacteria, but suppress nitrous oxide emissions shortly after urea application, Geoderma, 338, 493–501, https://doi.org/10.1016/J.GEODERMA.2018.09.023, 2019. Vanhatalo, A., Chan, T., Aalto, J., Korhonen, J. F., Kolari,
P., Hölttä, T., Nikinmaa, E., and Bäck, J.: Tree water re-lations can trigger monoterpene emissions from Scots pine stems during spring recovery, Biogeosciences, 12, 5353–5363, https://doi.org/10.5194/bg-12-5353-2015, 2015.
Warlo, H., Machacova, K., Nordstrom, N., Maier, M., Laem-mel, T., Roos, A., and Schack-Kirchner, H.: Compari-son of portable devices for sub-ambient concentration mea-surements of methane (CH4) and nitrous oxide (N2O) in
soil research, Int. J. Environ. An. Ch., 98, 1030–1037, https://doi.org/10.1080/03067319.2018.1517871, 2018. Warner, D. L., Villarreal, S., McWilliams, K., Inamdar, S., and
Var-gas, R.: Carbon Dioxide and Methane Fluxes From Tree Stems, Coarse Woody Debris, and Soils in an Upland Temperate For-est, Ecosystems, 20, 1205–1216, https://doi.org/10.1007/s10021-016-0106-8, 2017.
and methane observations, Atmos. Meas. Tech., 9, 4737–4757, https://doi.org/10.5194/amt-9-4737-2016, 2016.