Anatomy Demystified Astronomy Demystified Biology Demystified Biotechnology Demystified Business Statistics Demystified Calculus Demystified
Chemistry Demystified College Algebra Demystified Differential Equations Demystified Digital Electronics Demystified Earth Science Demystified Electricity Demystified Electronics Demystified
Environmental Science Demystified Everyday Math Demystified
Geometry Demystified Math Proofs Demystified
Math Word Problems Demystified Microbiology Demystified
Physics Demystified Physiology Demystified Pre-Algebra Demystified Precalculus Demystified Probability Demystified
Project Management Demystified Quantum Mechanics Demystified Relativity Demystified
DEMYSTIFIED
LINDA D. WILLIAMS
0-07-147140-5
The material in this eBook also appears in the print version of this title: 0-07-145319-9.
All trademarks are trademarks of their respective owners. Rather than put a trademark symbol after every occur-rence of a trademarked name, we use names in an editorial fashion only, and to the benefit of the trademark owner, with no intention of infringement of the trademark. Where such designations appear in this book, they have been printed with initial caps.
McGraw-Hill eBooks are available at special quantity discounts to use as premiums and sales promotions, or for use in corporate training programs. For more information, please contact George Hoare, Special Sales, at george_hoare@mcgraw-hill.com or (212) 904-4069.
TERMS OF USE
This is a copyrighted work and The McGraw-Hill Companies, Inc. (“McGraw-Hill”) and its licensors reserve all rights in and to the work. Use of this work is subject to these terms. Except as permitted under the Copyright Act of 1976 and the right to store and retrieve one copy of the work, you may not decompile, disassemble, reverse engineer, reproduce, modify, create derivative works based upon, transmit, distribute, disseminate, sell, publish or sublicense the work or any part of it without McGraw-Hill’s prior consent. You may use the work for your own noncommercial and personal use; any other use of the work is strictly prohibited. Your right to use the work may be terminated if you fail to comply with these terms.
THE WORK IS PROVIDED “AS IS.” McGRAW-HILL AND ITS LICENSORS MAKE NO GUARANTEES OR WARRANTIES AS TO THE ACCURACY, ADEQUACY OR COMPLETENESS OF OR RESULTS TO BE OBTAINED FROM USING THE WORK, INCLUDING ANY INFORMATION THAT CAN BE ACCESSED THROUGH THE WORK VIA HYPERLINK OR OTHERWISE, AND EXPRESSLY DISCLAIM ANY WARRANTY, EXPRESS OR IMPLIED, INCLUDING BUT NOT LIMITED TO IMPLIED WARRANTIES OF MERCHANTABILITY OR FITNESS FOR A PARTICULAR PURPOSE. McGraw-Hill and its licensors do not warrant or guarantee that the functions contained in the work will meet your requirements or that its operation will be uninterrupted or error free. Neither McGraw-Hill nor its licensors shall be liable to you or anyone else for any inaccuracy, error or omission, regardless of cause, in the work or for any damages resulting therefrom. McGraw-Hill has no responsibility for the content of any information accessed through the work. Under no circumstances shall McGraw-Hill and/or its licensors be liable for any indirect, incidental, special, punitive, consequential or similar damages that result from the use of or inability to use the work, even if any of them has been advised of the possibility of such damages. This limitation of liability shall apply to any claim or cause whatsoever whether such claim or cause arises in contract, tort or otherwise.
We hope you enjoy this
McGraw-Hill eBook! If
you’d like more information about this book,
its author, or related books and websites,
please
click here.
open lands, and endangered species,
as well as bring pollution issues into general view.
Because of their efforts, we have a good chance
of surviving our global growing pains.
Thank you.
Preface
ix
Acknowledgments
xiii
PART ONE:
ATMOSPHERE
1
CHAPTER 1
Our Planet Earth
3
CHAPTER 2
Ecosystems and Biodiversity
21
CHAPTER 3
Atmosphere
41
CHAPTER 4
Greenhouse Effect and Global Warming
73
Part One Test
91
PART TWO:
WATER
99
CHAPTER 5
The Hydrologic Cycle
101
CHAPTER 6
Oceans and Fisheries
125
CHAPTER 7
Glaciers
147
CHAPTER 8
Water Pollution and Treatment
171
Part Two Test
193
vii
PART THREE:
LAND
201
CHAPTER 9
Weathering and Erosion
203
CHAPTER 10
Deserts
221
CHAPTER 11
Geochemical Cycling
243
CHAPTER 12
Solid and Hazardous Waste
261
Part Three Test
277
PART FOUR:
WHAT CAN BE DONE
285
CHAPTER 13
Fossil Fuels
287
CHAPTER 14
Nuclear and Solar Energy
303
CHAPTER 15
Wind, Hydroelectric and
Geothermal Energy
319
CHAPTER 16
Future Policy and Alternatives
335
Part Four Test
351
Final Exam
359
Answers to Quiz, Test, and
Exam Questions
377
APPENDIX I
Terms and Organizations
383
APPENDIX II
Conversion Factors
393
References
395
This book is for anyone with an interest in Environmental Science who wants to learn more outside of a formal classroom setting. It can also be used by home-schooled students, tutored students, and those people wishing to change careers. The material is presented in an easy-to-follow way and can be best understood when read from beginning to end. However, if you just want more information on specific topics like greenhouse gases, geothermal energy, or glaciers, then you can review those chapters individually as well.
You will notice through the course of this book that I have mentioned milestone theories and accomplishments of geologists and ecologists along with national and international organizations making a difference. I’ve high-lighted these innovative people and agencies to give you an idea of how the questions and strong love of nature have motivated individuals and countries to take action.
Science is all about curiosity and the desire to find out how something hap-pens. Nobel prize winners were once students who daydreamed about new ways of doing things. They knew answers had to be there and they were stubborn enough to dig for them. The Nobel prize for Science has been awarded over 475 times since 1901.
In 1863, Alfred Nobel experienced a tragic loss in an experiment with nitro-glycerine that destroyed two wings of the family mansion and killed his younger brother and four others. Nobel had discovered the most powerful weapon of that time—dynamite.
By the end of his life, Nobel had 355 patents for various inventions. After his death in 1896, Nobel’s will described the establishment of a foundation to cre-ate five prizes of equal value “for those who, in the previous year, have con-tributed best towards the benefits for humankind,” in the areas of Earth Science, Physics, Physiology/Medicine, Literature, and Peace. Nobel wanted to recog-nize the heroes of science and encourage others in their quest for knowledge. Perhaps the simple ideas that changed our understanding of the Earth,
ecosys-ix
tems, and biodiversity will encourage you to use your own creative ideas in tack-ling important Environmental Science concerns.
This book provides a general overview of Environmental Science with chap-ters on all the main areas you’ll find in an Environmental Science classroom or individual study of the subject. The basics are covered to familiarize you with the terms and concepts most common in the experimental sciences, of which Environmental Science is one. Additionally, I’ve listed helpful Internet sites with up-to-date information on global warming, atmospheric factors, and energy alternatives, to name a few.
Throughout the text, I’ve supplied lots of everyday examples and illustra-tions of natural events to help you visualize what is happening beneath, on, or above the Earth’s surface. There are also quiz, test, and exam questions throughout. All the questions are multiple-choice and a lot like those used in standardized tests. There is a short quiz at the end of each chapter. These quizzes are “open book.” You shouldn’t have any trouble with them. You can look back at the chapter text to refresh your memory or check the details of a natural process. Write your answers down and have a friend or parent check your score with the answers in the back of the book. You may want to linger in a chapter until you have a good handle on the material and get most of the answers right before moving on.
This book is divided into four major parts. A multiple-choice test follows each of these parts. When you have completed a part, go ahead and take the part test. Take the tests “closed book” when you are confident about your skills on the individual quizzes. Try not to look back at the text material when you are tak-ing them. The questions are no more difficult than the quizzes, but serve as a more complete review. I have thrown in lots of wacky answers to keep you awake and make the tests fun. A good score is three-quarters of the answers right. Remember, all answers are in the back of the book.
The final exam at the end of the course is made up of easier questions than those in the quizzes and part tests. Take the exam when you have finished all the chapter quizzes and part tests and feel comfortable with the material as a whole. A good score on the exam is at least 75% of correct answers.
Try going through one chapter a week. An hour a day or so will allow you to take in the information slowly. Don’t rush. Environmental Science is not dif-ficult, but does take some thought to get the big picture. Just plow through at a steady rate. If you’re really interested in deserts, spend more time on Chapter 10. If you want to learn the latest about the oceans and fisheries, allow more time for Chapter 6. At a steady pace, you’ll complete the course in a few months. After completing the course, you will have become a geologist-in-training. This book can then serve as a ready reference guide, with its comprehensive index, appendix, and many examples of cloud structures, energy types, erosion, and geochemical cycling.
Suggestions for future editions are welcome.
Illustrations in this book were generated with CorelDRAW and Microsoft PowerPoint and Microsoft Visio, courtesy of the Corel and Microsoft Corpo-rations, respectively.
National Oceanographic and Atmospheric Administration (NOAA), Environ-mental Protection Agency (EPA), and United States Geological Survey (USGS) statistics and forecasts were used where indicated.
A very special thanks to Dr. Karen Duston of Rice University for the techni-cal review of this book.
Many thanks to Judy Bass at McGraw-Hill for her unfailing confidence and assistance.
Thank you also to Rice University’s staff and faculty for their friendship, sup-port, and flexibility in the completion of this work.
To my children, grandchildren, and great-grandchildren who will inherit the Earth that is left to them.
xiii
Atmosphere
3
Our Planet Earth
Native peoples, completely dependent on nature for everything in their lives, wor-shipped Earth as a nurturing mother. The soil sprouted plants and trees that pro-vided food, clothing, and shelter. The rivers and seas gave up fish and shellfish for food, trade articles, and tools. From the atmosphere came rain, snow, and wind to water crops and adjust the seasons. Earth, never stagnant or dull, provided abun-dantly for early stewards of her resources. Ancient peoples thought that Mother Earth worked together with Father Sun to provide for those who honored her.
In early Greek mythology, the Earth goddess, Gaia, mother of the Titans, was honored as an all-nourishing deity. When Gaia was happy, crops flourished, fish-ermen and hunters were successful, and everything thrived.
Today, astronauts who orbit Earth in space ships and scientific laboratories marvel at her beauty while working toward her care. Other scientists, engineers, and test pilots have communicated their wonder and appreciation for our fragile world through environmental efforts that address global issues. Any study of the environment includes many facets of this planet we call home. Environmental scienceencompasses worldwide environmental factors like air, light, moisture, temperature, wind, soil, and other living organisms.
Environmental biology includes all the external factors that affect an organism or community and that influence its development or existence.
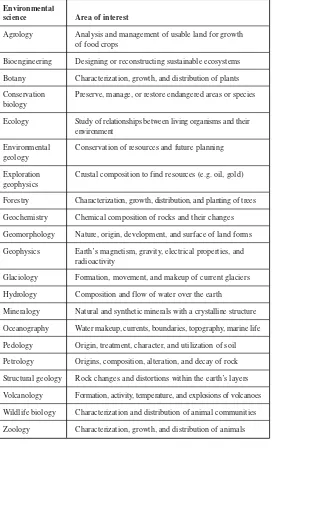
The Earth’s almost limitless beauty and complexity provide broad areas for scientific study. Researchers from many different fields are focusing their skills on the mechanisms and interactions of hundreds of environmental factors. These natural and industrial factors affect the environment in ways that are known and suspected, as well as those totally unidentified. Although some changes have been taking place for millions of years, some appear to be accelerating. Today, environmental scientists are sorting through tons of data in order to increase their understanding of the impacts of modern processes on all environmental aspects. Table 1-1 lists a sampling of the various environmental fields of scientific study.
Size and Shape
The size and shape of the earth was a mystery for thousands of years. Most peo-ple thought the land and seas were flat. They were afraid that if they traveled too far in one direction, they would fall off the edge. Explorers who sailed to the lim-its of known navigation were considered crazy and on paths to destruction. Since many early ships did not return from long voyages, people thought they had been sunk by storms, eaten by sea monsters, or just went too far and fell off.
It wasn’t until the Greek philosopher Aristotle (384–322 BC), who noticed that
Earth’s shadow on the moon was curved, that people began to question the “flat earth” idea. It was another 1500 years, however, before the earth’s round shape was well understood.
Compared to the sun, which is over 332,000 times the mass of the Earth, our home planet is tiny—a bit like a human compared to an ant. The sun is 1,391,000 kilometers in diameter compared to the Earth, which is approximately 12,756 km in diameter. That means the diameter of the sun is over 100 times that of the Earth. To picture the size difference, imagine that the sun is the size of a basketball. By comparison, the earth would be about the size of this “o.”
Earth’s Formation
Environmental
science Area of interest
Agrology Analysis and management of usable land for growth of food crops
Bioengineering Designing or reconstructing sustainable ecosystems Botany Characterization, growth, and distribution of plants Conservation Preserve, manage, or restore endangered areas or species biology
Ecology Study of relationships between living organisms and their environment
Environmental Conservation of resources and future planning geology
Exploration Crustal composition to find resources (e.g. oil, gold) geophysics
Forestry Characterization, growth, distribution, and planting of trees Geochemistry Chemical composition of rocks and their changes Geomorphology Nature, origin, development, and surface of land forms Geophysics Earth’s magnetism, gravity, electrical properties, and
radioactivity
Glaciology Formation, movement, and makeup of current glaciers Hydrology Composition and flow of water over the earth
[image:23.492.59.375.94.600.2]Mineralogy Natural and synthetic minerals with a crystalline structure Oceanography Water makeup, currents, boundaries, topography, marine life Pedology Origin, treatment, character, and utilization of soil Petrology Origins, composition, alteration, and decay of rock Structural geology Rock changes and distortions within the earth’s layers Volcanology Formation, activity, temperature, and explosions of volcanoes Wildlife biology Characterization and distribution of animal communities Zoology Characterization, growth, and distribution of animals
by powerful telescopes. The NASA Hubble space telescope has sent back images of many of these beautiful formations, called nebulae.
It is likely that when the Earth was first forming in our young solar neighbor-hood, it was a molten mass of rock and metals simmering at about 3,600° Fahrenheit (2,000° Celsius). The main cloud elements included hydrogen, helium, carbon, nitrogen, oxygen, silicon, iron, nickel, phosphorus, sulfur, and others. As the sphere (Earth) cooled, the heavier metals like iron and nickel sunk deeper into the molten core, while the lighter elements like silicon rose to the surface, cooled a bit, and began to form a thin crust. Fig. 1-1 shows the way that early elements formed into a multilayer crust. This crust floated on a sea of molten rock approximately four billion years ago, sputtering volcanic gases and steam from the impact of visitors like ice comets. Millions more years passed like this while an atmosphere gradually formed. Rain condensed and poured down, cooling the crust into one large chunk and gathering into low spots and cracks, forming oceans, seas, lakes, rivers, and streams.
Our Place in the Galaxy
Even though the sun seems to be the center of our universe, it is really just one of many kids on the block. Our solar system is found on one of the spiral arms, Orion, of the galaxy known as the Milky Way.
Solid inner core (6,440 km; iron)
Oceanic crust (105 km) Mantle
(2,900 km)
Liquid outer core (5,150 km; iron, nickel, silicon,
sulfur, and oxygen) Continental crust (200 km)
Think of the Milky Way galaxy as one “continent” among billions of other continents in a world called the universe. Its spiraling arms or “countries” are called Centaurus, Sagittarius, Orion, Perseus, and Cygnus. The Milky Way galaxy is 80,000 to 120,000 light years across (a light year is a measure of distance equal to or more than 9 trillion km, or 9.46 × 10¹² km). The center
of the Milky Way is made up of a dense molecular cloud that rotates slowly clockwise, throwing off solar systems and cosmic debris. It contains roughly 200 billion (2 ×10¹²) stars.
Although Andromeda is the closest full-size galaxy to the Milky Way, the Sagittarius Dwarf, discovered in 1994, is the closest galaxy. It is 80,000 light years away, or nearly 24 kiloparsecs. A parsec is a unit of measurement equal to 3.26 light years.
Atmosphere
Earth’s atmosphereis the key to the development of life on this planet. Other planets in our solar system contain various levels of hydrogen, methane, and ammonia atmospheres (Jupiter, Neptune), carbon dioxide and nitrogen (Venus, Mars), or hardly any atmosphere at all (Mercury, Pluto).
The atmosphere of the Earth, belched from prehistoric volcanoes, extends nearly 563 km (350 miles) out from the solid surface of our planet. It is made up of a mixture of gases that combine to allow life to exist. In the lower atmos-phere, nitrogen is found in the greatest amounts, 78%, followed by oxygen at 21%. Carbon dioxide, vital to the growth of plants, is present in trace levels of atmospheric gases, along with argon and a sprinkling of neon and other minor gases. Table 1-2 compares the earth’s atmosphere with the atmosphere of neigh-boring planets.
Oxygen, critical to human life, developed as microscopic plants and algae began using carbon dioxide and photosynthesis to make food. From that process, oxygen is the most important byproduct.
The mixture of gases that we call air penetrates the ground and most openings in the earth not already filled with water. The atmosphere is perhaps the most active of the different environmental components. To people around the world, it has a constantly changing personality.
The Milky Way is one of millions of galaxies in the universe. The
We will study these atmospheric factors that favor life on Earth when we take a closer look at the atmosphere in Chapter 3.
Gaia Hypothesis
In 1974, James Lovelock explained that the Earth existed as a single living organ-ism in his Gaia hypothesis.He described how organic and inorganic components interact through complex reactions to balance an environment where life can exist. Lovelock’s Gaia theory considers the evolution of a tightly integrated sys-tem made up of all living things and the physical environment: the atmosphere, oceans, and land. Natural regulation of important factors, like climate and chemi-cal composition, is a result of intricate evolutionary development. Like many liv-ing organisms and closed-loop self-regulatliv-ing systems, Lovelock considered Gaia as one system in which the whole is greater than the sum of its parts.
Planets Atmospheric gases
Sun Hydrogen, nitrogen Mercury None
Venus None
Earth Oxygen, nitrogen, hydrogen Mars None
Jupiter Methane, hydrogen Saturn Hydrogen, methane Uranus None
Neptune None Pluto None
Today, there is heated debate about which global environmental problem is the most crucial. Depending on a person’s geographical and economic position, it can be pollution, overpopulation, ozone depletion, deforestation, habitat destruction, global warming, overfishing, drought, radioactive waste storage— or all or none of these. Some scientists believe that these environmental impacts will be overcome in the long run when Gaia makes the corrections needed to bring the Earth back into equilibrium.
The problem with these balancing forces is that they can be sudden and vio-lent (think earthquakes and volcanic eruptions). A powerful, natural environ-mental adjustment often brings disaster upon all inhabitants unfortunate enough to be in the vicinity.
In 1979, Lovelock further described his theory in GAIA: A New Look at Life on Earth.Since then, many scientists and environmentalists have begun to study global changes within the context of the Gaia idea, although not everyone agrees with the theory.
The updated Gaia hypothesis proposes that Earth’s atmosphere, oceans, and land masses are held in equilibrium by the living inhabitants of the planet, which includes millions of species besides humans. The Gaia concept suggests that this living world keeps itself in worldwide environmental balance.
One example of this balancing act takes place in the oceans. Salts are con-stantly added to the oceans by physical and chemical processes, raising salinity. Eventually, affected seas (like the Dead Sea) reach an uninhabitable salinity level. According to the Gaia hypothesis, the sea’s salinity is controlled biologi-cally through the mutual action of ocean organisms. In fact, living sea creatures, primarily algae and protozoa, have processed and removed salt throughout geo-logical time, balancing salinity levels that allow life to thrive.
Actually, that is fairly straightforward. Salt is removed from ocean waters when it piles up on the bottom. This happens following the death of microorganisms that sink to the ocean floor. As ocean salinity rises, plankton that include salt into their outer coverings die and sink to the ocean depths, lowering salt levels. In this way, the ocean’s salinity stays in equilibrium.
The Gaia theory can also be applied to the balancing of atmospheric gases in fairly constant proportions needed to support life. Without the ongoing bio-logical creation of oxygen and methane, for example, the balance of critical atmospheric elements would be severely altered. Organisms all over the
world work together to create a breathable atmosphere, not just in one habitat or location.
Scientists questioning the Gaia concept think that evolutionary changes account for the adjustments needed for life to exist. The argument goes that when ocean salinity increases, oxygen levels change or global temperatures increase. Only evolved organisms are able to able to survive new conditions, and their genetically stronger offspring are then able to thrive in a changed environment.
Lovelock counters this by stressing that environmental conditions can’t oper-ate independently of living world processes. Table 1-3 lists the diverse Earth energy resources and processes to be considered.
In the Gaia concept, humans are seen as one species among millions, with no special rights. Whether humans were here or not makes little difference to Gaia’s survival, which eventually adjusts for overpopulation, global warm-ing, or habitat destruction. Some might even argue that Gaia would function
Solar energy Fossil fuels
Atmospheric absorption Surface heating Wind energy
Heat from the earth’s core Shortwave and longwave radiation
Flowing rivers Hydrologic cycle and precipitation Tidal energy Gravitational energy Tectonic energy
[image:28.492.218.335.305.607.2]Energy absorption in the earth’s crust
more effectively without us here at all. However, whether humans are respon-sible for environmental problems or not, global balancing may severely impact our future.
To understand the Earth as one living system (whether called Gaia or some-thing else) we need to understand more about all the parts that make it unique.
Biosphere
All plants and animals on the earth live in the biosphere,which is measured from the ocean floor to the top of the atmosphere. It includes all living things, large (whales) and small (bacteria), grouped into species or separate types. The main compounds that make up the biosphere contain carbon, hydrogen, and oxygen. These elements also interact with other earth systems.
Surprisingly, life is found in many hostile environments on this planet. Very hot temperatures (5,000°C) near volcanic spouts rising from the ocean floor, and polar, subzero temperatures (−84°C) are at the extreme ends of the temperature range. The earth’s biodiversity is truly amazing. Everything from exotic and fearsome deep-ocean creatures to sightless fish in underground lakes exists as part of the earth’s diverse inhabitants. There are sulfur-fixing bacteria that thrive in sulfur-rich, boiling geothermal pools and frogs that dry out and remain barely alive in desert soils until the rare rains bring them back to life. This makes envi-ronmental study fascinating to people of all cultures, geographies, and interests. However, the large majority of biosphere organisms that grow, reproduce, and die are found in a much more narrow range. In fact, most of the Earth’s species live in a thin slice of the biosphere. This slice is located at temperatures above zero (most of the year) and in upper ocean depths where sunlight can penetrate.
The vertical range of the biosphere is roughly 20,000 meters, but the section most populated with living species is only a fraction of that. It includes a section measured from just below the ocean’s surface to about 1,000 meters above it. Most living plants and animals live in this narrow layer of the biosphere. The biosphere and the impacts of today’s world will be described in greater detail in Chapter 2.
Hydrosphere
The global ocean, the Earth’s most noticeable feature from space, makes up the largest single part of the planet’s total covering. The Pacific Ocean, the largest ocean, is so big that the land mass of all the continents could fit into it.
The combined water of all of the oceans makes up nearly 97% of the earth’s water. These oceans are much deeper on average than the land is high, and make up what is known as the hydrosphere.
The hydrosphere is never still. It encompasses the evaporation of oceans into the atmosphere, the raining of this water back onto land, the run-off into streams and rivers, and finally the flow back into the oceans. The hydrosphere also con-tains the water in underground aquifers, lakes, and streams.
The cryosphere is a subset of the hydrosphere. It includes all of the Earth’s frozen water found in colder latitudes and higher elevations in the form of snow and ice. At the poles, continental ice sheets and glaciers cover vast wilderness areas of barren rock that have hardly any plant life. Antarctica is a continent two times the size of Australia and contains the world’s largest ice sheet. In Chapter 13 we will learn much more about the cryosphere, its beauty, and its hazards, when we study glaciers.
Lithosphere
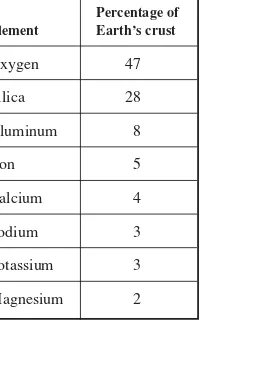
The crust and very top part of the mantle are collectively known as the litho-sphere (lithosis Greek for “stone”). This layer of the crust is rigid and brittle, acting as an insulator over the active mantle layers below. It is the coolest of all the Earth’s land layers and thought to float or glide over the layers beneath it. Table 1-4 lists the amounts of different elements in the earth’s crust.
The lithosphere is about 65 to 100 km thick and covers the entire Earth.
Scientists have determined that around 250 million years ago, all the land mass was in one big chunk or continent. They called the solid land mass Pangaea,
meaning “all earth.” The huge surrounding ocean was called Panthalassa,which means “all seas.” By nearly 65 million years ago, things had gradually broken apart to form the continental land masses we know and love today, separated by huge distances of water.
Crust
The Earth’s crustis the hard, outermost covering of the planet. This is the layer exposed to weathering like wind, rain, freezing snow, hurricanes, tornadoes, earthquakes, meteor impacts, volcano eruptions, and everything in between. It has all the wrinkles, scars, colorations, and shapes that make nature interesting. Just as everyone is different, with diverse ideas and histories depending on their experiences, the land varies widely around the globe. Lush and green in the trop-ics to dry and inhospitable in the deep Sahara to fields of frozen ice pack in the Arctic, the crust has many faces.
Percentage of Element Earth’s crust
[image:31.492.142.276.96.290.2]Oxygen 47 Silica 28 Aluminum 8 Iron 5 Calcium 4 Sodium 3 Potassium 3 Magnesium 2
CONTINENTAL CRUST
The land mass of the crust is thin compared to the rest of the Earth’s layers. It makes up only about 1% of the earth’s total mass, but the continental crust can be as much as 70 km thick. The land crust with mountain ranges and high peaks is thicker in places than the crust found under the oceans and seas, but the ocean’s crust, about 7 km thick, is denser.
The continents are the pieces of land that sit above the level of ocean basins, the deepest levels of land within the crust. Continents have broken up into six major land masses: Africa, Antarctica, Australia, Eurasia, North America, and South America. This hard continental crust forms about 29% of the Earth’s surface.
Beside dry land, continents include undersea continental shelvesthat extend the land mass even further, like the crust around the edge of a pie. A continental shelf provides a base for the deposit of sand, mud, clay, shells, and minerals washed down from the land mass.
A continental shelf can extend beyond the shoreline from 16 to 320 km, depending on location. The water above a continental shelf is fairly shallow (between 60 and 180 km deep) compared to the greater depths at the slope and below. There is a drop-off, called the continental slope, that slips away suddenly to the ocean floor. Here, the water reaches depths of up to 5 km to reach the aver-age level of the seafloor.
“Land” or “dry” crust has more variety than its undersea brother, the oceanic crust, because of weathering and environmental conditions. The continental crust is thicker, especially under mountains, but less dense than the “wet crust” found under the oceans. Commonly, the continental crust is 32 km thick, but can be up to 80 km thick from the top of a mountain.
OCEANIC CRUST
The land below the levels of the seas is known as the oceanic crust.This “wet” crust is much thicker than the continental crust. The average elevation of the con-tinents above sea level is 840 meters. The average depth of the oceans is about
3,800 meters, or 41/2times greater. The oceanic crust is roughly 7 to 10 km thick
below the bottom of the oceans.
Though not pounded by wind and rain like the continental crust, the oceanic crust is far from dull. It experiences the effects of the intense heat and pressures of the mantle more than the continental crust, because the oceanic crust covers more area.
Even slow processes like sediment collection can trigger important geological events. This happens when the build-up of heavy sediments onto a continental shelf by ocean currents causes pieces to crack off and slide toward the ocean floor in a rush. When this happens, the shift can roar downward at speeds of between 50 and 80 km per hour, smashing everything in its path. Delicate ocean communities are as affected by these types of undersea events as land animals would be after a mudslide or earthquake. The sudden water movement causes intense turbidity currents that can slice deep canyons along the ocean floor. These currents cause disruptive undersea avalanches that change the underwater seascape and affect its many inhabitants.
The winds from the Northern and Southern Hemispheres also keep the oceans churning and recycling. Their pushing movement, along with the Earth’s rota-tion, keeps ocean currents moving until they hit a land mass and are deflected. A large, circular rotation pattern in the subtropical ocean is called a gyre.The circulation of gyres in the Northern Hemisphere is clockwise, while the circula-tion in the Southern Hemisphere is counterclockwise. Fig. 1-2 shows the flow of these global gyres.
These are just some of the currents that circulate the oceans. In Chapter 6, we’ll learn more about the currents and constant motion of the earth’s oceans.
90° N
90° S
0° (Equator) 60° N
30° N
[image:33.492.164.318.446.572.2]30° S 60° S
Mantle
The mantle is the next layer in the Earth’s crust. It is located just below the lithosphere. The mantle makes up over 80% of the earth’s volume. It is esti-mated to be about 2,900 km thick. The mantle is not the same all the way through. It is divided into two layers: the upper mantle, or asthenosphere(asthenes
is Greek for “weak”), and the lower mantle. These layers are not the same. They contain rock of different density and makeup.
The asthenosphere is solid, but found at much greater depths than the litho-sphere. Compared to the crust, this layer is hot, near the melting point of rock. Think of it as something like oatmeal: When it is hot, it is fairly liquid, but if you leave it to cool on the table for a few hours, it turns to stone and is nearly impos-sible to get out of the bowl!
Heat and pressure create malleability within the lithosphere. This acts like a series of ball bearings under the chunks of the lithosphere. Mantle layers move and glide on this moldable, creeping underlayer. This allows a lot of activity to take place.
The heated materials of the asthenosphere become less dense and rise, while cooler material sinks. This works very much like it did when the planet originally formed. Dense matter sank to form a core, while lighter materials shifted upward. The lower part of the mantle, or mesosphere,measures roughly 660 km from the Earth’s molten outer core to the bottom of the asthenosphere.
Different amounts of heating in the upper and lower parts of the mantle cause extremely slow currents to form and allow solid rock to creep along one atom at a time in a flow direction. The continental and oceanic crusts are pulled down and moved around depending on the direction of these deep currents.
Core
The distance from the Earth’s surface to its core is nearly 6,500 km. Like the Hollywood movie The Core, the deeper you go, the hotter it gets. The Earth’s outer peel, the crust, is 5 to 55 km thick and insulates the surface from its hot interior.
The temperature gradient (rise in temperature with regard to depth) of the earth’s crust is 17 to 30°C per kilometer of depth. The mantle has temperatures between 650 and 1250°C. At the earth’s core (liquid outer and solid inner) tem-peratures are between 4000 and 7000°C.
Because heat moves from hotter areas to colder areas, the earth’s heat moves from its fiery center toward the surface. This outward heat flow creates a con-vective mantle movement that drives plate tectonics. At spots where the plates slide apart, magma rises up into the rift, forming new crust.
Where continental plates collide, one plate is forced under the other, a process called subduction. As a subducted plate is forced downward into areas of extreme heat, it is forced by increasing pressure, temperature, and water con-tent to melt, becoming magma (lava). Hot magma columns rise and force their way up through the crust, transferring huge amounts of heat.
This very center of the earth (core) is made up mostly of iron with a smatter-ing of nickel and other elements. The core, which is under extreme pressure, makes up around 30% of the Earth’s total mass. It is divided into an inner and outer core. Look back to Fig. 1-1 to see the elemental makeup of the core.
Earthquake wave measurements have suggested that the outer core is fluid and made of iron, while the inner core is solid iron and nickel. The solid center, under extremely high pressure, is unable to flow at all.
MAGNETISM
The earth acts as a giant magnet with lines of north/south magnetic force loop-ing from the North Pole to the South Pole. Ancient sailors noticed and used this magnetism to chart and steer a course. The magnetic field around the earth is formed by the rotation of the inner core as a solid ball, the different currents in the liquid outer core, and the much slower movement of the mantle. The earth’s magnetic field is supported by this circulation of molten metals in the outer core.
The Earth’s magnetic field further shows that the core must be made of a con-ducting substance (metal). Iron is thought to be the only element that is abun-dant enough and conductive at the extreme pressures and temperatures typical of the core.
The global magnetic environment is a fairly big unknown. Geologists have discovered that the directional pattern of magnetism in rocks, at the time they were formed, provides an accurate record of the Earth’s magnetic profile over geologic time.
molten rock cools. By studying ancient volcanic rock, scientists found that the earth’s magnetic environment changes in a cyclic manner. In fact, by studying rock magnetism, geologists know that the North and South Poles have actually flipped positions. Because this takes place over the entire globe, scientists are trying to understand the atmospheric, geologic, and oceanic impacts of such a huge magnetic switch. What would it mean to today’s cities and land masses? Would hurricanes, tornadoes, and earthquakes increase? Would there be more and more droughts? How are the polar ice caps affected? Can species adapt? No one really knows.
We have surveyed the birth and characteristics of our home planet, but the story doesn’t stop there. Now, let’s study the factors and forces that have shaped the Earth since the beginning. In Chapter 2, we’ll learn more about the complex global ecosystems that support life on the Earth’s crust.
Quiz
1. What percentage of water covers the earth’s surface? (a) 40%
(b) 50% (c) 70% (d) 80%
2. Aristotle was the first person to notice that (a) the moon was round
(b) mice always live near grain barns (c) bubbles appear in fermenting liquids (d) the earth’s shadow on the moon is curved
3. What is the nearest major galaxy to the Milky Way? (a) Orion
(b) Draco (c) Andromeda (d) Cirrus
4. A large, circular rotation pattern in the subtropical ocean is called a (a) plateau
5. The magnetic pole is
(a) kept moving by outer core currents (b) located exactly at the geographical pole (c) only observed in the Southern Hemisphere (d) based on observations of the tides
6. The lithosphere is
(a) located below the ionosphere
(b) the crust and very top part of the mantle (c) roughly 5 to 20 km thick
(d) fluid and soft in all areas
7. An active, adaptive control process that is able to maintain the Earth in overall balance is known as the
(a) Geary hypothesis (b) Gaia hypothesis (c) Miller hypothesis (d) Gladiator hypothesis
8. The diameter of the sun is over how many times the diameter of the Earth? (a) 50
(b) 75 (c) 100 (d) 125
9. The biosphere includes the
(a) hydrosphere, crust, and atmosphere (b) oceans and trenches
(c) crust, mantle layer, and inner core (d) hydrosphere and lithosphere
10. The extremely slow atom-by-atom movement and deformation of rock under pressure is known as
21
Ecosystems and
Biodiversity
Although humans are primarily land dwellers, the Earth’s surface is largely water. The world’s oceans make up 99% of the planet’s biosphere and contain the great-est diversity of life. Even the most biologically rich tropical rain forgreat-ests cannot match the biodiversity (measured by the number of species) found in a coral reef community.
Rain forests, deserts, coral reefs, grasslands, and a rotting log are all examples of ecosystems.
Since the oceans seemed limitless for thousands of years, it’s hard to under-stand pollution’s heavy impact on plant and animal marine species and ecosys-tems. Within the last 30 years, population increases, new technology, increased seafood demand, and many other factors have impacted marine ecosystems in
An ecosystemis a complex community of plants, animals, and microor-ganisms linked by energy and nutrient flows that interact with each other and their environment.
ways unknown 100 years ago. With the planet’s population having now passed six billion, scientists, economists, policy makers, and the public are becoming increasingly aware of the strain on the ocean’s natural ecosystems and resources.
Climate impacts on coral reefs and forest ecosystems have affected associated industries and jobs (lumber and fishing). Public policy in many countries has begun to address climate issues at the regional, national, and international levels. Conservation and sustainable biodiversity activities are becoming more com-mon with a strong interest toward sustainable use.
Some of the biologically diverse areas currently under study include marine and coastal, island, forest, agricultural, and inland waters, as well as dry, sub-humid, and mountain regions. Scientists are initiating research programs that address basic principles, key issues, potential output, timetables, and future goals of single and overlapping systems.
Biosphere
We learned in Chapter 1 that the part of the Earth system that directly supports life, including the oceans, atmosphere, land, and soil, is the biosphere.All the Earth’s plants and animals live in this layer, which is measured from the ocean floor to the top of the atmosphere. All living things, large and small, are grouped into species,
or separate types. The main compounds that make up the biosphere contain car-bon, hydrogen, and oxygen. These elements interact with other Earth systems.
The vertical range that contains the biosphere is roughly 20,000 meters high. The section most populated with living species is only a fraction of that. It includes a section measured from just below the ocean’s surface to about 1,000 meters above it. Most living plants and animals live in this narrow layer of the biosphere. Fig. 2-1 gives an idea of the depth of the biosphere.
The biosphere includes the hydrosphere, crust, and atmosphere. It is located above the deeper layers of the earth.
BIODIVERSITY
The idea of a biologically diverse environment is easy to imagine in the middle of the tropical rain forest, where there are living organisms all around you, but what about the desert? A lot of sand, cactus, scrubby plants, and stunted trees may not seem important, but they are. Every member of a particular environ-ment or ecosystem has a specific purpose, or ecological niche.
The interrelationships between the ecological niches make up a complex ecosystem. Whenever a major overlap exists between species or a foreign species is introduced, the ecological balance is upset and things get out of whack. A new ecosystem balance must be achieved for the natural system to
An animal or plant with a specific relationship to its habitat or other species, filled by that organism alone, exists within an ecological niche.
Altitude
Tallest mountains
4,000 8,000
2,000
sea level
2,000 4,000 6,000
Area where most living things live
Average deep-ocean floor depth
[image:41.492.52.391.93.331.2]Depth meters
work smoothly. If biodiversity is unbalanced and a species eliminated, then niches within the system must adjust. Some adjustments are minor, but more often a domino effect takes place, with all members of the ecosystem rebalanc-ing. The groups that cannot make the change die out.
Endemic Species
Plants and animals are scattered all across the globe. Some, like humans and cockroaches, are widespread, while others with very restricted territories are found only on a single river, lake, island, or mountaintop. These highly special-ized organisms are called endemic speciesbecause they are unique to a specific region. Consequently, endemic species are usually studied within their geo-graphic location.
In order for a species to survive for thousands or millions of years, the organ-isms must adapt to their habitat. Often, during the course of their development, they obtain ecological characteristics that help them thrive.
Dogs and cats live in many habitats (mostly around humans), but even in the wild, they are widely distributed. However, most species are restricted to certain areas because their ecological requirements are only found in a limited location. They might be able to do well in another region, but not if they have to travel huge distances (like across an ocean) to enjoy a better climate and food supply.
You don’t find polar bears in Arizona because they are endemic to polar regions. Plants and animals that need warmer climates or a longer growing sea-son are restricted by environmental conditions like temperature and rainfall.
A species’ geographical range often reaches across broad areas, depending on the environmental conditions. As long as the core habitat needs of a species are met, its members can survive.
The total area in which a plant, animal, insect, or other organism may travel in its lifetime is called its range.
Endemic species, naturally occurring in only one area or region, are unique to that specific region.
The range of the once limitless American bison (which numbered in the mil-lions) has been reduced to a tiny fraction of what it once was. Range loss and the massive slaughter that took place during the nineteenth century construction of the North American east-west railroad across their territory took a heavy toll on the buffalo.
HABITAT
The area in which an animal, plant, or microorganism lives and finds nutrients, water, sunlight, shelter, living space, and other essentials is called its habitat.
Habitat loss, which includes the destruction, degradation, and fragmentation of habitats, is the primary cause of biodiversity loss.
Loss of habitatis perhaps the most important factor that affects species. Think of when a tornado or hurricane levels a town. Not only are homes and businesses destroyed, but water supplies, food crops, communications, and transportation methods may be lost. The area may become unlivable. Without the necessities that humans require to live or adapt to an environment, they have to find some place else to live.
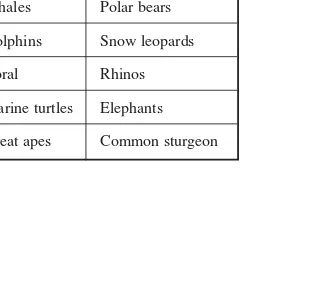
When a species is continually crowded out of its habitat or its habitat is destroyed, it cannot reproduce, and its numbers drop. When this happens, a species is said to be endangered.Table 2-1 lists the top species in the world on the World Wildlife Fund’s Endangered Species List.
Giant pandas Atlantic salmon Tigers Pikas
[image:43.492.141.297.456.606.2]Whales Polar bears Dolphins Snow leopards Coral Rhinos Marine turtles Elephants Great apes Common sturgeon
Sometimes habitat loss is so severe or happens so quickly that it results in a species being eliminated from the planet. This happened to the dinosaurs. Scientists are still trying to decide what caused the mass extinction. There are a lot of theories, but except as seem in the occasional Hollywood movie, huge dinosaurs no longer roam the earth.
Extinction takes place naturally, because for some species to succeed, others must fail. Since life began, about 99% of the earth’s species have disappeared and, on several occasions, huge numbers died out fairly quickly. The most recent of these mass extinctions, about 65 million years ago, swept away the dinosaurs and many other forms of life. Though not extinct as a result of human actions, the dinosaurs are a good example of a large number of species that could not adapt to environmental changes.
Local extinction takes place when every member of a specific population in a specific area has died. Table 2-2 shows the number of species evaluated and those placed on the Endangered Species List in 2004 by the World Conservation Union (IUCN).
For the past forty years, the World Conservation Union’s Species Survival Commission (SSC) has been ranking the conservation status of species, sub-species, varieties, and selected subpopulations worldwide in order to pinpoint groups threatened with extinction. To promote their conservation efforts, the SSC provides the most current, objective, scientifically-based information avail-able on the status of globally threatened biodiversity. The groups assessed for the IUCN Red List of Threatened Species possess genetic diversity and provide the foundation for ecosystems. The collected data on species rank and distribution gives policy makers solid information with which to make informed decisions on preserving biodiversity at all levels.
A few species that have either approached or have completely gone extinct include Gorilla beringei beringei (African mountain gorilla), Pyrenean ibex
(European goat), Canis rufus floridianus (Florida wolf), and Hippopotamus madagascariensis(Madagascan hippo). Global extinction happens when every member of a species has died. The passenger pigeon and the dodo are examples of globally extinct birds. Extinction is forever.
A species that is no longer living anywhere on the earth is said to be extinct.
Wetlands
One area that contains diverse populations is the nation’s wetlands. Once con-sidered unimportant wasteland, wetlands are now known to support important and extensive ecosystems. Wetland plants convert sunlight into plant material or biomass, which provides food to many different kinds of aquatic and land ani-mals, supporting the aquatic food chain. Wetlands, often protected, also provide moisture and nutrients needed by plants and animals alike.
Wetlandsare low, soggy places where land is constantly or seasonally soaked, or even partly underwater.
No. of species No. of No. of evaluated threatened species (2004) species (2004)
Mammals 5,416 4,853 1,101 Birds 9,917 9,917 1,213 Reptiles 8,163 499 304 Amphibians 5,743 5,743 1,770 Fishes 28,500 1,721 800 Insects 950,000 771 559 Mollusks 70,000 2,163 974 Crustaceans 40,000 498 429 Others 130,200 55 30 Mosses 15,000 93 80 Ferns 13,025 210 140 Gymnosperms 980 907 305 Dicotyledons 199,350 9,473 7,025 Monocotyledons 59,300 1,141 771 Lichens 10,000 2 2
[image:45.492.104.328.93.452.2]Wetlands are the transitional areas between land and marine areas. The water table is above, even with, or near the land’s surface. Wetland soils hold large amounts of water and their plants are tolerant of occasional flooding. Wetlands can be coastal (estuaries or mangroves) or inland.
Wetlands can be swamps, bogs, peat lands, fens, marshes, and swamp forests. Two large wetland areas in the United States are the Florida Everglades and the Okefenokee Swamp in Georgia.
Wetlands are also habitats for many types of fish and wildlife. About 60% of the United States’ major commercial fisheries use estuaries and coastal marshes as nurseries or spawning sites. Migratory waterfowl and other birds also rely on wetlands for homes, stopovers, and food.
Some wetlands form, over time, from lakes that have filled in, becoming wetlands or forest. This provides breeding and nursery areas for thousands of fish, shellfish, microorganisms, amphibians, reptiles, insects, invertebrates (like worms), and birds. Many species are forced into extinction as wetlands disap-pear. Table 2-3 lists the many ways wetlands are impacted by human activities.
Source Wetland impact
Agriculture Plowed for farmland; pesticide and fertilizer runoff pollutes wetlands Cities Filled for commercial development like homes, businesses, resorts,
airports, and roads
River pollution Carry wastewater, spilled oil, chemicals and industrial waste Canals, ports, Destroyed by dredging to widen areas for ships
and harbors
Oil Spilled and offshore oil drilling waste often washed back into coastal estuaries
Aquaculture Mangroves and other areas destroyed to grow fish, shellfish, or shrimp Dams Restrict freshwater, nutrient, and sediment flow; also divert water
for irrigation
Air pollution Burning, industrial and automobile exhaust
[image:46.492.101.449.349.606.2]Non-native Alien plant species push out native species, slow water flow and species suffocate freshwater ponds and marshes
Some wetlands are created artificially. These are used for aquaculture or for filtering and purifying sludge and sewage from cities and industrial processes. Although these can serve as environmental buffers for plants and animals, they just don’t support the same variety of life found in natural ecosystems.
Wetlands also play an important role in flood control by absorbing high flows and releasing water slowly. Along the coast, wetlands decrease storm surges from hurricanes and tropical storms. When wetlands are filled in for develop-ment or residential use, heavy rainfall flows off the land, taking rich topsoil and agricultural chemicals with it.
Wetlands serve as natural filters, allowing water to trickle down to the water table and underground reservoirs. Refilled and purified, groundwater is then stored in deep underground aquifers. When wetlands are lost, groundwater resupply or recharge may not take place. This causes drought in spring-fed areas. Loss of wetlands also increases the chance of groundwater contamination by removing the natural detoxification process.
Wetlands are home to more than 600 animal and 5,000 plant species. In the United States, nearly 50% of the animals and 25% of the plants on the endan-gered species list live in or rely on wetlands. One-half of the United States migratory birds are dependent on wetlands.
Internationally, wetlands are taking a hit as well. In Canada, which contains one-quarter of the world’s wetlands, 15% of the wetlands have been lost. Germany and the Netherlands have lost over 50% of their wetlands.
Europe’s largest wetland, the Danube Delta, stretches across 2,860 km in nine nations. Severe yearly erosion and pollution by nitrogen, phosphorus, pes-ticides, and other chemicals have caused a 50% drop in fish harvests in the past 20 years.
Mangroves in Africa, Asia, and Central and South America have been impacted or destroyed for firewood, rice fields, and aquaculture. India, the Philippines, and Thailand have lost over 80% of their mangrove forests. Bangladesh, Ghana, Pakistan, Somalia, Tanzania, Kenya, and Mozambique have all lost over 60% of their mangroves.
DEFORESTATION
One of Earth’s wonders is the diversity of plant life, including ancient forests. Although forests are complex ecosystems in themselves, they are also divided according to climate.
Forests are mainly divided into temperate (moderate climate) or tropical
regions. Temperate forests are grouped into conifers(needle-leaf trees) like pine, spruce, redwood, cedar, fir, sequoia, and hemlock, while tropical forests contain flat-leaf trees. Old growth forests contain mostly conifers. Second- and third-growth forests contain trees of the same age and size as some of the younger old-growth trees, but have far fewer plant and animal species.
Temperature and rainfall are the major determiners of forest type. Some of these include:
•
Temperate rain forest•
Tropical dry forest•
Tropical rain forestA temperate rain forest is found in only a few special places around the world, such as the Pacific temperate rain forest on the west coast of North America. These temperate forests are often dominated by conifer trees adapted to wet climates and cool temperatures.
Located near the equator, a tropical dry foresthas distinct rainy and dry seasons. Most tropical dry forest plants have adapted to withstand high temperatures and seasonal droughts.
The third major forest type receives and contains a lot of moisture. This trop-ical rain forest, found near the equator, harbors the richest diversity of terrestrial plant and animal species.
Today, the largest and most severe species loss is taking place in the tropical rain forests near the equator. Trees are being cut for grazing, farming, timber, and fuel. Ecologists have found that over 50% of the earth’s original rain-forests had been cleared by 1990. The remaining rain-forests are lost by around 1.8 percent per year.
Old Growth Forests
Old-growth forestsare found primarily in northern climates, although there are small caches of untouched trees in remote locations like Tasmania.
Old-growth forests are those that have never been harvested. They contain a variety of trees that are between 200 and 2000 years old. Forest floor leaf litter and fallen logs provide habitat for a complex mix of interdependent animals, birds, amphibians, insects, bacteria, and fungi that have adapted to each other over geological time. When the forests are cleared, the animals, birds, and insects that live under their protective cover are displaced or destroyed as well. Genetic uniqueness (biodiversity) of these affected species is permanently lost.
Redwood National Park and three California state parks contain some of the world’s tallest trees: old-growth coastal redwoods.Living to be as much as 2,000 years old, they grow to over 91 meters tall. Spruce, hemlock, Douglas fir, and sword ferns create a multilevel tree canopy that towers above the forest floor. The local shrubs include huckleberry, blackberry, salmonberry, and thimbleberry. Park animals include raccoons, skunks, Roosevelt elk, deer, squirrels, minks, weasels, and black bears.
Redwoods live so long because they are particularly resistant to insects and fire. Scientists have discovered that giant redwoods contain high levels of bark tannins that protect them from disease. Additionally, redwoods can grow either from seeds or new sprouts from a fallen tree’s root system, stumps, or burls. The economic clearing of fallen trees therefore limits new growth.
The most important factor in redwood survival is their biodiversity. Forest floor soils play a big role in tree growth. A healthy redwood forest includes a variety of tree species, as well as ferns, mosses, and mushrooms. These are important to soil regeneration. Fog from the nearby Pacific provides cooling and moisture for the trees.
The redwoods, however hardy, have lost a lot of ground. Of the original 1,950,00 acres of redwood forests growing in California, only 86,000 acres remain today. Three percent of these acres are preserved in public lands and 1 percent is privately owned and managed.
It comes as no surprise that when trees are lost through deforestation, bio-diversity drops. When forests or grasslands are cleared and planted as a single cash or food crop, the number of species drops to one, plus a few weeds. But this is only part of the problem. Since forests support animal species with food and shelter, these species are also eliminated. Often, new species replace the originals, but generally the number of species goes down. When plant cover is removed, other area populations (mammals, birds, and insects) are greatly affected.
A species that has survived, while other similar ones have gone extinct, is called a relict species.A relict species, like the European white elm tree in west-ern Siberia, may have had a wider range originally, but is now found only in particular areas. Other relict species, like horseshoe crabs or cockroaches, have survived unchanged since prehistoric times, even as other species become extinct.
HOTSPOTS
In 1988, British ecologist Norman Myers described the biodiversity hotspot
idea. Although the tropical rain forests have the highest extinction rates, they aren’t the only places at risk. Myers wanted to point out the resource problem facing ecologists. Since they were unable to save everything at once, they needed a way to identify areas with endangered species.
Globally, there are hundreds of species facing extinction because of habitat destruction and loss. Myers identified 18 high-priority areas where habitat cover had already been reduced to less than 10% of its original area or would be within 20 to 30 years. These regions make up only 0.5% of the earth’s land surface, but provide habitats for 20% of the world’s plant species facing extinction. Table 2-4 lists the world’s top 10 hotspots as designated by
Conservation International.
Two factors are weighed heavily in identifying a hotspot: (1) high diversity of endemic species; and (2) significant habitat impact and alteration from human activities.
Plant diversity is the biological basis for hotspot designation. In order to qualify as a hotspot, a region must support 1500 endemic plant species, 0.5% of the global total. Existing natural vegetation is used to assess human impact in a region.
Since plants provide food and shelter for other species, they are used in rat-ing an area as a hotspot. Commonly, the diversity of endemic birds, reptiles, and
An ecological region that has lost more than 70% of its original habitat is considered a hotspot.
animals in hotspot areas is also extremely high. Hotspot animal species are found only within the boundaries of the hotspot, since they are often specifically adapted to endemic plant species as their main food source.
In recent hotspot designations by world conservation agencies, 25 biodi-versity hotspots—containing 44% of all plant species and 35% all terrestrial vertebrate species in only 1.4% of the planet’s land area—were listed. Hot-spots target regions where the extinction threat is the greatest to the greatest number of species. This allows biologists to focus cost-effective efforts on critical species.
Endemic species have been isolated over a long period of geologic time. Islands, surrounded by water, have the most endemic species. In fact, many of the world’s hotspots are islands. Mild environments, like Mediterranean regions, give shelter to the greatest diversity of species. Topographically different, mild environments, like mountain ranges, allow the greatest ecosystem diversity.
Several hotspots are tropical island archipelagos, like the Caribbean and the Philippines, or big islands, like New Caledonia. However, other hotspots are continental islands isolated by surrounding deserts, mountain ranges, and seas.
Endemic Endemic % plants vertebrates Remaining Endemic Endemic per per natural Hotspot plants vertebrates 100 km2 100 km2 vegetation
Madagascar and 9,704 771 16.4 1.3 9.9 Indian Ocean Islands
Philippines 5,832 518 64.7 5.7 3.0 Sundaland 15,000 701 12.0 0.6 7.8 Atlantic Forest 8,000 654 8.7 0.6 7.5 Caribbean 7,000 779 23.5 2.6 11.3 Indo-Burma 7,000 528 7.0 0.5 4.9 Western Ghats and 2,180 355 17.5 2.9 6.8 Sri Lanka
[image:51.492.38.398.93.348.2]Eastern Arc Mountains 1,500 121 75.0 6.1 6.7 & Coastal Forests
Peninsulas are key regions for hotspots. They are similar to islands and some, like Mesoamerica, Indo-Burma, and the Western Ghats in India, were islands at some time in the past. Other hotspots are landlocked islands isolated between high mountains and the sea. The Andes Mountains, which separate South America from north to south, are an impassible barrier to many species. On the western coast, the lowlands form a thin, isolated ecosystem from the eastern side of the continent.
The Cape Floristic Province in South Africa is isolated by the extreme dryness of the Kalahari, Karoo, and Namib deserts, and large rivers like the Zambezi and the Limpopo.
Why Are Hotspots Fragile?
Island ecosystems are particularly fragile because they are never or are only rarely exposed to outside influences. Ecologists have found that most extinct species were island species and not widely spread. They were confined to certain habitat areas, whether an island or an isolated part of a continent, that supported their existence. Once a one-of-a-kind population is gone, the species is lost forever.
Isolated species lose their defenses over time, because they are only exposed to limited number of specific species. When they have to compete with new, pre-viously unknown species, they can’t adapt fast enough. This is especially true if the new species is highly competitive and adaptable.
For example, large extinct birds like the moa and dodo, which had no predators on the remote Australian continent, lost their ability to fly. When humans and other predators arrived, these birds were easy targets and quickly dropped in numbers.
Since many of the global hotspots are beautiful and unique, humans have been drawn to their natural diversity throughout history. Ecosystems and land-scapes were changed, first by hunter-gatherers, then by farmers and herdsmen, and most extensively by the global growth and sale of agricultural crops. During the past 500 years, many species were harvested to the last individual. Currently, growing human populations in world hotspots add to their decline by the intro-duction of nonnative species, illegal trade in endangered species, industrial log-ging, slash-and-burn agricultural practices, mining, and the construction of highways, dams, and oil wells. Eleven hotspots have lost at least 90% of their original natural vegetation, and three of these have lost 95%.
Conservation
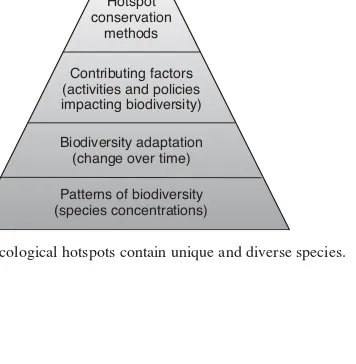
Since hotspots possess the highest concentrations of distinctive biodiversity on the planet, they are also at the greatest risk. It is essential to conserve hotspot species in order to prevent a domino effect of species extinction. A strategy to protect global biodiversity, especially in hotspots, is an important next step. In order to have a positive impact on currently threatened species in hotspots, the following characteristics shown in Fig. 2-2 must be identified and considered. For conservation capability to be realized in various threatened areas, the knowledge and tools needed to conserve the hotspots must be present. Steady monitoring is important since the political, social, and biological environments of hotspots change. For this reason, an early warning system is under development by the Center for Applied Biodiversity Science at Conservation International (CI).
The Biodiversity Early Warning System is supported by several monitoring programs that are being done by CI, its partner countries and organizations, and hotspot experts. These programs assess species, habitats, and socioeconomic factors to identify problem regions before they are too far gone.
Species data are being collected and rapid biological assessments of poorly known terrestrial, freshwater, and marine ecosystems made. Sponsored expedi-tions send small teams of international and host-country biologists to the field for three to four weeks to conduct the hotspot assessments. Additionally, a net-work of field stations in all of the world’s major tropical ecoregions is being established to monitor biodiversity.
Hotspot conservation
methods
Contributing factors (activities and policies impacting biodiversity)
Biodiversity adaptation (change over time)
[image:53.492.125.303.408.590.2]Patterns of biodiversity (species concentrations)