Rochester Institute of Technology
RIT Scholar Works
Theses Thesis/Dissertation Collections
5-1-2009
Annotation consistency tool: the assessment of
JCVI microbial genome annotations
Rhea I. Sanchez
Follow this and additional works at:http://scholarworks.rit.edu/theses
This Thesis is brought to you for free and open access by the Thesis/Dissertation Collections at RIT Scholar Works. It has been accepted for inclusion in Theses by an authorized administrator of RIT Scholar Works. For more information, please [email protected].
Recommended Citation
Annotation Consistency Tool:
The Assessment of JCVI Microbial Genome Annotations
Approved: ______________________________________
Director of Bioinformatics
______________________________________
Head, Department of Biological Sciences
Submitted in partial fulfillment of the requirements for the Master of Science degree in Bioinformatics at the Rochester Institute of Technology.
Abstract
BRC-Pathema is one of eight National Institute of Allergy and Infectious Diseases
(NIAID) Bioinformatics Resource Centers. It consists of sophisticated, clade-specific Web
resources targeting the data and analysis needs of different scientific communities. Among those
resources are sophisticated bioinformatics software, a comprehensive library of scientific
literature, and manually curated data. Periodical evaluations by the BRC-Central determine
Pathema’s level of completeness, accuracy, and consistency. The results of these evaluations
have revealed the need to develop customized tools for the maintenance of acceptable levels of
accuracy and consistency within Pathema’s curated databases of annotated microbial genomes.
The Annotation Consistency Tool, or ACT, is a customized analysis tool used to investigate and
assess the consistency of BRC-Pathema annotated genes against TIGRFAM equivalog HMMs.
ACT generates both categorized statistics and dynamic lists of individual HMMs and the
Thesis Advisory Committee
1. Committee Co-Advisor Lauren Brinkac
Bioinformatics Project Manager J. Craig Venter Institute
2. Committee Co-Advisor Dr. Gary R. Skuse
Director of Bioinformatics Rochester Institute of Technology
3. Committee Member Seth Schobel
Senior Bioinformatics Engineer J. Craig Venter Institute
4. Committee Member Dr. Michael V. Osier Assistant Professor
Acknowledgements
I would like to thank everyone who has contributed to the success of this project and
everything leading up to it. I would like to acknowledge my thesis committee, the faculty and
staff at Rochester Institute of Technology, and the Bioinformatics department at the J. Craig
Venter Institute for their constant guidance and assistance. Thank you to Anthony Corbett for his
help during the Web development portion of this project. I’d also like to thank Robert Larivee for
his encouragement and assistance throughout the entire project.
I dedicate this work to my parents who gave up their dreams so that I may have mine. I
List of Images
Figure 1. Databases, Tables, and Fields Queried by ACT …………...…………...… 07
Figure 2. ‘hmm2’ Table Design ………...… 08
Figure 3. ‘ident’, ‘evidence’, ‘asm_feature’, ‘go_role_link’, and ‘stan’ Table Designs ………...… 10
Figure 4. ‘genomes’ Table Design ………...… 12
Figure 5. Original Algorithm of ACT ………...………...… 14
Figure 6. Improved Algorithm of ACT ……….………...… 16
Figure 7. Original SQL Queries of ACT ………..………...… 18
Figure 8. Optimized SQL Queries of ACT ………...………...… 19
Figure 9. Original ACT Web-Based Interface ……….………...… 21
Figure 10. Improved ACT Web-Based Interface ………...… 22
Figure 11. Genome List Filtering ………...…...… 22
Figure 12. Interactive ACT Results Page ………...…………...… 23
Figure 13. Interactive Individual Inconsistency Information Table View …….…...… 24
Figure 14. ACT Module Relationship Diagram ……….………...… 26
Figure 15. Object Oriented Design ………..………. 33
Figure 16. Command-line Invocation ………...… 35
Figure 17. Command-line Results – Overall Statistics ……..………...… 37
Figure 18. Command-line Results – Breakdown Statistics ………...… 38
Figure 19. Command-line Results – Inconsistent Evidence …………..…………...… 39
Figure 21. Web-based Results – Overall & Breakdown Statistics .………...… 41
Figure 22. Web-based Results – Inconsistent Evidence ……….……...… 42
Figure 23. Individual Inconsistent Evidence ………..………...… 43
Figure 24. MGAT Page ………..………...… 44
Figure 25. Gene Curation Page ……….………...… 44
Figure 26. Comments Function Icons ………...……….………...… 45
Figure 27. Reading Comments ………...…...… 46
Figure 28. Adding Comments ……….…...… 47
Figure 29. Add Comments Messages ……….……….…...… 47
Figure 30. Analysis Results for Microbial Genomes ……….…....… 48
Figure 31. Analysis Results for BRC-Microbial Genomes ………....… 49
List of Tables
Table of Contents
I. Abstract ………...………….………... ii
II. Thesis Committee ……..…..………... iii
III. Acknowledgements .…...….………... iv
IV. List of Figures ……….. v
V. List of Tables ……… vii
VI. Table of Contents ………. viii
VII. Background a. Pathema ……….……… 01
b. Annotation Pipeline ……….………..… 02
c. Value Addition Statistics ……….………...… 03
VIII. Introduction ………...………..………...… 07
IX. Methods and Materials a. Time Study ………...…… 14
b. Algorithm Analysis ………..…..… 14
c. SQL Query Optimization ………..…… 17
d. Web Interface Development ……….…… 20
e. Genome Data Set Expansion ………...……….… 25
X. Results a. ACT Structure ……….……….. 26
b. ACT Objects ………...……….……….. 33
d. Command-line ACT ……….…. 35
e. Web ACT ………..…. 39
f. ACT Results Analysis ……… 48
XI. Discussion a. ACT Evaluation ……….………… 50
b. Future Work ……….………. 50
XII. Conclusion ………... 52
XIII. Funding ……….…...……….….………. 53
XIV. References ……….…...……….….. 54
Background
BRC-Pathema
BRC-Pathema (http://www.pathema.jcvi.org) is the Bioinformatics Resource Center
(BRC) at the J. Craig Venter Institute (JCVI). BRC-Pathema is one of eight NIAID-funded BRCs
designed to support bio-defense and infectious disease research. All eight BRCs are linked via a
central online portal, the Pathogen Portal (http://www.pathogenportal.org). The BRC-Central
allows researchers convenient access to all eight BRCs.
BRC-Pathema aims to provide clade-specific core resources that target the individual data
and analysis needs of Bacillus-, Clostridium-, Burkholderia- and Entamoeba-centered scientific
communities. BRC-Pathema’s six target pathogens are Bacillus anthracis, Clostridium botulinum, Clostridium perfringens, Burkholderia mallei, Burkholderia pseudomallei, and
Entamoeba histolytica. Among those resources are sophisticated bioinformatics software, a comprehensive library of scientific literature, and manually curated genome annotation data.
All BRC-Pathema gene annotation information is stored over several interrelated
relational databases: the EGAD database, the COMMON database, and organism-specific SMALL
GENOMES DATABASES (SGD).
An SGD is a generic microbial annotation database. Each organism has a corresponding
SGD containing genomic information including annotation data. A condensed schema
representing the annotation-relevant tables of an SGD database for a prokaryotic organism can be
The EGAD database contains Hidden Markov Model (HMM) information and functional
role identification data. A condensed schema representing the annotation-relevant tables of EGAD
can be found in the Supplemental Images section.
The COMMON database contains “common” information of currently available genome
projects, including Gene Ontology (GO) annotation and Genome Property information. A
condensed schema representing the annotation-relevant tables of the COMMON database can be
found in the Supplemental Images section.
Annotation Pipeline
All functional annotation predictions are made based on one of two main algorithms:
BLAST Extend Repraze (BER) and HMM. BER-based gene annotations are functional
assignments based on a detected pairwise homology between the query protein and the results of
JCVI-modified BLAST searches, also known as BER hits. HMM-based annotations are made
using the HMMER package, (Eddy, 1998). Two sets of HMMs are used: Sanger’s Pfam HMMs
(Sonnhammer et al., 1998) and JCVI’s TIGRFAM HMMs (Haft et al., 2001).
Gene assignments are made based on the best evidence available. Evidence is weighed
differently depending on the level of specificity of a particular HMM, or the strength of a
pairwise alignment to an experimentally characterized BER alignment. Furthermore, TIGRFAM
HMMs are preferred over Pfam HMMs. The HMMs used at JCVI are categorized by type also
known as its isology type. Isology types are indicative of the homology or convergence in
addition to the “degree of confidence” about function. Isology types include equivalogs,
domain, exception, hypothetical equivalog domain, paralog, paralog domain, paralog repeat,
repeat, signature, subfamily, subfamily domain, and superfamily.
Equivalog-based HMMs suggest a higher degree of confidence about function than
HMMs based on other isology types. Equivalogs refer to a set of functionally conserved
homologous proteins in with respect to their last common ancestor. Homologous regions of
conserved function are classified as "equivalog domain". In the case that a family of proteins has
the phylogenetic characteristics of an equivalog but its function has not yet been experimentally
determined, these families are classified as “hypothetical equivalogs”, or “hypothetical equivalog
domains” when appropriate.
During the annotation process, each gene is assigned with several “descriptors” which
include, among others, a protein functional name (common name), gene symbol, enzyme
commission number (EC number), Gene Ontology (GO) function, process, and component
identifier(s), and, if and when applicable, an annotation completion process. A common name is
the name given to the protein encoded by the gene which reflects its biological function. A gene’s
symbol is an abbreviation of commonly four to five alpha-numeric characters given to identify
the gene. An EC number is a universal numerical classification of an enzyme reflecting its
metabolic properties. A GO identifier is “controlled” numerical identifier reflecting a protein’s
association to the Gene Ontology’s organizational hierarchy of cellular components, biological
processes and molecular functions. The annotation status of a gene indicates the state of progress
of a gene’s annotation. These states include (i) automated annotation by JCVI’s AutoAnnotate
Value Addition Statistics
To ensure the credibility of each BRC, the Pathogen Portal runs a series of tests
evaluating each BRC’s accuracy, completeness, and consistency by evaluating the annotation
assigned to BRC-Pathema genes based on hits to TIGRFAM equivalog HMMs.
To assess the accuracy of BRC-Pathema, a small set of preselected TIGRFAM equivalog
HMM genes are used to assess the accuracy of BRC-Pathema annotations. The BRC-Pathema
proteins that score significantly to these HMMs are inspected and a subjective assessment of the
correctness of the functional name assignment is made through manual analysis. Based on the
equivalog isology of these models, one would expect all BRC-Pathema proteins that score
significantly to a TIGRFAM equivalog HMM also share that same function, and thus functional
names assigned to BRC-Pathema should be the same as those assigned to each TIGRFAM
model. The reported accuracy statistic will be a percentage reflecting the number of “correct”
function name annotations made.
To evaluate the level of completeness, all TIGRFAM equivalog HMMs are used. Since
BRC-Pathema proteins that score significantly to a TIGRFAM equivalog are assumed to share
that same function, the annotation descriptors (i.e. common names and EC numbers) associated
with each TIGRFAM HMM should be assigned appropriately to the respective BRC-Pathema
protein. These descriptors are counted and compared to the total number of expected TIGRFAM
gene descriptors. Thus, the reported completeness statistic will be a percentage reflecting the
ratio of the number of actual annotations to the number of expected annotations. The correctness
Finally, with regard to the consistency, the complete set of BRC-Pathema proteins that
score significantly to TIGRFAM equivalog HMMs are evaluated based on whether or not each
set of proteins has been assigned the same gene descriptors as one would expect based on shared
function. The reported consistency statistic reflects the likelihood of any two proteins having the
same annotated text string assigned.
Once the evaluation of each BRC is completed, the Pathogen Portal publicly reports the
accuracy, completeness, and consistency statistics of each BRC as seen in Table 1. Each BRC is,
then, able to assess problematic areas. Based on a recent evaluation, BRC-Pathema's consistency
[image:15.612.70.535.332.662.2]was deemed unsatisfactory.
Table 1. Value Addition Statistics
Accuracy Summary
% Incorrect % Suspicious Overall % Correct
January 2008 0.5% 0.8% 98.7%
July 2007 0.1% 0.7% 99.2%
January 2007 0.3% 1.0% 98.7%
Completeness Summary
Functional Names Genetic Names GO assignment EC #
January 2008 99.1% 87.2% 90.2% 94.5%
July 2007 99.1% 89.3% 90.5% 95.4%
January 2007 100.0% 78.3% 78.2% 55.1%
Consistency Summary
Consistency Measure
January 2008 76.9%
July 2007 80.1%
January 2007 80.2%
Due to the framework of the annotation process, ideally, the descriptor assignments given
to each gene should match the descriptor assignments given to the TIGRFAM equivalog HMM
to which the gene in question matched the most. The annotation process is such that a gene’s
descriptors assignment is made based solely on the descriptors of the associated HMM. Thus,
looking particularly at the common name, gene symbol, and EC number assignments, we should
expect to see that a gene and the TIGRFAM equivalog HMM used to annotate it should have the
same common name, gene symbol, and EC number assignments. Any discrepancies would
contribute to the high inconsistency and high inaccuracy scores given by the Pathogen during
evaluation.
Several major and minor factors could potentially contribute to a discrepancy between
TIGRFAM equivalog HMM assignments and associated annotated genes. The Pathogen Portal
Introduction
Developed during the summer of 2008, the first iteration of the Annotation Consistency
Tool (ACT) was designed as a tool used to maintain seemly levels of accuracy and consistency
by investigating the individual inconsistencies of BRC-Pathema annotated genes against
TIGRFAM equivalog HMMs.
ACT iterates through the three aforementioned databases making individual annotation
assessments of each BRC-Pathema gene and the associated HMM. However, only a subset of
tables from each aforementioned database and its vast amount of data is actually used by ACT as
seen in Figure 1.
From the EGAD database, ACT accesses the ‘hmm2’ table. The ‘hmm2’ table contains
[image:17.612.139.475.334.610.2]HMM annotation data including descriptor data (names, gene symbols, etc.) and cutoffs (the Figure 1. Databases, Tables, and Fields Queried by ACT
HMM threshold scores) as seen in Figure 2. Because a single protein may have multiple HMM
hits, it is necessary to incorporate HMM threshold scores to determine which HMM is the best
[image:18.612.192.418.158.626.2]hit.
Figure 2: ‘hmm2’ Table Design
The subset of fields from the ‘hmm2’ table utilized by ACT during analysis includes the
following:
• hmm2.hmm_acc: The unique alphanumerical identifier of an HMM.
• hmm2.hmm_com_name: The name given to the HMM to suggest its function.
• hmm2.gene_sym: The name given to identify the gene.
• hmm2.ec_num: The Enzyme Commission (EC) number of a gene. The EC number
is a universal numerical classification of an enzyme reflecting is metabolizing
properties.
• hmm2.iso_type: The isology type of an HMM. An isology type dictates the level
of confidence about function.
From the SGD database(s), the ‘ident’, ‘evidence’, ‘asm_feature’, ‘stan’, and
‘go_role_link’ tables are utilized by ACT during analysis (Figure 3). The ‘ident’ table
stores the annotation data associated with a predicted gene model.. The ‘evidence’ table is a
record of supporting annotation evidence, such as HMM evidence. The ‘asm_feature’ table
consists of information relative to predicted gene model nucleotide and translated protein
sequences, sequence coordinates, etc. The ‘stan’ table holds a record of associated genome
sequence assembly information. Finally, the ‘go_role_link’ table holds information linking
The subset of fields from the aforementioned SGD database(s) utilized by ACT during
analysis includes the following:
• ident.feat_name: The alphanumerical JCVI internal identifier of a protein.
• ident.com_name: The name given to the protein to suggest its function.
[image:20.612.91.540.75.507.2]• ident.gene_sym: The name given to identify the gene.
Figure 3. ‘ident’, ‘evidence’, ‘asm_feature’, ‘go_role_link’, and ‘stan’
Table Designs
• ident.ec#: The Enzyme Commission (EC) number of a gene. The EC number is a
universal numerical classification of an enzyme reflecting is metabolizing properties.
• ident.locus: The locus information of gene.
• ident.complete: The status of annotation (manually, automated, MUMMer
re-map, etc.).
• evidence.accession: The unique alphanumerical identifier of the evidence off
of which the annotation was made.
• evidence.ev_type: The type of evidence (i.e. HMM evidence).
• evidence.curated: The Boolean value reflecting curation.
• asm_feature.feat_type: The type of genome feature (i.e. RNA, gene, etc.).
• stan.iscurrent: The Boolean value reflecting which sequence assembly is the
most current.
• go_role_link.go_id: The GO IDs associated with a gene.
From the COMMON database, only the ‘genomes’ table is accessed by ACT during the
The three columns from the ‘genomes’ table are utilized by ACT during analysis
include the following.
• genomes.name: The scientific name of an organism.
• genomes.db: The unique alphanumeric JCVI internal identifier of a database.
• genomes.type: The category indicating the genome type to which a database
belongs.
Once the evaluation completes, ACT reports categorized statistics reflecting
inconsistencies and, as a by-product, the inaccuracies in BRC-Pathema’s annotated genes and
generates the individual inconsistencies found within BRC-Pathema. In addition, ACT provides
nomenclature for inconsistent HMMs and/or genes as suggested by the International Union of
[image:22.612.194.418.72.355.2]Biochemistry and Molecular Biology (IUBMB, http://www.iubmb.org/). The first iteration of
Figure 4. ‘genomes’ Table Design
ACT targets 86 of BRC-Pathema’s microbial genomes. However, the ultimate goal is to be able
to run ACT on the entire Comprehensive Microbial Resource (CMR, http://cmr.jcvi.org)
database which consists of more than 500 completed genomes and several hundred other
prokaryotic genomes in production. In order to achieve this goal, a complete structural and
aesthetic overhaul of ACT was inevitable.
Executed via the command-line version or using the Web-based interface, the first
iteration of ACT takes, on average, approximately one minute to process a single prokaryotic
genome. A linear scale-up in runtime is observed. Consequently, analyzing the 86 original target
genomes in BRC-Pathema, ACT’s average runtime is two hours. On an individual level, a minute
is an acceptable time. However, if applied to CMR’s 400 plus completed genomes, ACT will
accordingly take more than five times longer, and that is simply unacceptable as most Web
browsers will time out before the process ever completes. Thus, the foremost objective for ACT
development was to improve its runtime in order to be able to analyze a larger data set in a
reasonable amount of time. This required a complete redesign of ACT algorithm and careful
SQL query statement optimizations.
The second objective was to enhance ACT’s Web-based interface for improved usability.
The first iteration of ACT’s Web-based interface generates primitive HTML displays which,
more often than not, clutter the Web page making it difficult for users to sort through the analysis
results. To address this issue, technologies like Cascading Style Sheets (CSS), JavaScript,
Asynchronous JavaScript and XML (AJAX), and jQuery were utilized to sensibly reduce the
overwhelming amount of information returned by ACT and generate a more fluid and dynamic
Materials and Methods
Time Study
The first iteration of ACT had an average runtime of one (1) minute per genome. After
SQL optimization, the average runtime was decreased to forty-one (41) seconds per genome.
After the restructuring of the algorithm, the runtime was cut significantly to an average of two
(2) seconds per genome. To achieve this success, several concerns were identified and addressed
as mentioned in subsequent sections.
Algorithm Analysis
To address the unwieldy runtime of the first iteration of ACT, a closer look was taken at
[image:24.612.75.532.397.628.2]the original algorithm as seen in Figure 5.
Figure 5. Original Algorithm of ACT
Obtain all Isology types; Obtain all HMMs;
For all HMMs{
Obtain HMM’s common name, gene symbol, and EC number; For all organisms{
Obtain all genes; For all genes{
Obtain gene’s common name, gene symbol, and EC number; Compare common name pair;
- Increment inconsistency count if inconsistent; Compare gene symbol pair;
- Increment inconsistency count if inconsistent; Compare EC number pair;
- Increment inconsistency count if inconsistent; }
} }
Report results;
In the original algorithm, ACT extracts and stores an array of all evidences of the isology
types specified by the user. Equipped with an array of all the TIGRFAM HMMs of interest, ACT
iterates through each HMM and each organism specified by the user and extracts all the genes
annotated with the current HMM. As these associated genes are extracted, a string comparison of
the stringency specified by the user is performed on the three key descriptors of the current
HMM against those of the current gene. Upon careful investigation, several problems were
identified within the algorithm.
First, ACT obtained a list of all HMMs. This list included HMMs not used to annotate the
user-specified list of organisms, but only the HMMs used to annotate the user-specified list of
organism should be obtained. These additional HMMs lead to another more pressing issue.
The second issue was found in the iteration through the list of HMMs. For each HMM,
iteration through all the organisms is performed. It is not always the case that each HMM is used
to annotate a gene (or multiple genes) in each of the user-specified organisms. So, it is
unnecessary to iterate through all the organisms. This iteration through all the organisms becomes not only unnecessary but inefficient when paired with an HMM that was not used to
annotate any of the genomes at all.
The third concern was with the iteration of all genes. It is not the case that the HMM will
annotate all genes in a single organism, and it is definitely not the case that any one HMM will
annotate all genes in all organisms specified by the user. In fact, only a handful of genes in any
given genome, at most, are annotated by a single HMM. In most cases, a single HMM annotates
only a single gene from any one microbial genome because as a single-celled, haploid genome,
HMM, the iteration through thousands of genes for any one organism is not only unnecessary but
inefficient and time-consuming. In the case of unused HMMs, these iterations over thousands of
genes per genome are wasted entirely.
These issues have contributed to the lengthy average runtime of one minute per genome.
In the original algorithm, each HMM, used or unused, calls for an iteration through the
user-specified list of genomes and every annotated gene within those genomes. Thus, for any given,
run of ACT, thousands of iterations, at the very least, were pointlessly performed.
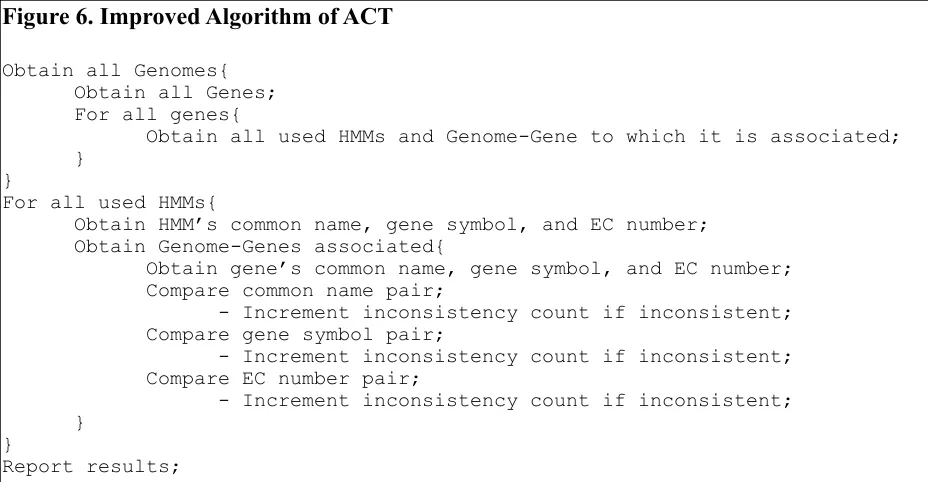
In the second iteration of ACT, these three major issues in the algorithm were addressed,
[image:26.612.72.536.334.575.2]and new algorithm was formulated, Figure 6.
Figure 6. Improved Algorithm of ACT
Obtain all Genomes{ Obtain all Genes; For all genes{
Obtain all used HMMs and Genome-Gene to which it is associated; }
}
For all used HMMs{
Obtain HMM’s common name, gene symbol, and EC number; Obtain Genome-Genes associated{
Obtain gene’s common name, gene symbol, and EC number; Compare common name pair;
- Increment inconsistency count if inconsistent; Compare gene symbol pair;
- Increment inconsistency count if inconsistent; Compare EC number pair;
- Increment inconsistency count if inconsistent; }
}
Report results;
Figure 6. In the improved algorithm, ACT only iterates through the relevant organisms and genes, eliminating the thousands of wasted iterations and thereby significantly reducing ACT’s average runtime.
In the revised algorithm, the first step is to iterate through all the user-specified genomes
and their respective genes. While iterating through the genes of a genome, the HMMs used to
used HMMs, meaning only the HMMs used to annotate the genes of the user-specified genomes.
This eliminates the first concern of iterating through unnecessary HMMs in the original
algorithm.
ACT then iterates through the list of only the used HMMs. For each HMM, the list of
associated genomes and genes are revisited and iterated through. As these associated genes are
extracted, a string comparison of the stringency specified by the user is performed on the three
key descriptors of the current HMM and the current gene. This eliminates the second and third
concern that unnecessary iterations through genomes and, in the other case, genes are being
performed.
SQL Query Optimization
During a given ACT run, ACT executes several types of SQL commands, Figure 7. To
Figure 7. Original SQL Queries of ACT
SELECT name, db FROM common..genomes
WHERE (type like “BRC-microbial”) AND
(name like “Bacillus%” or name like “Burkholderia%” or name like “Clostridium%”)
SELECT name
FROM common..genomes WHERE db like [DB_NAME]
SELECT hmm_acc, hmm_com_name, gene_sym, ec_num, iso_type FROM egad..hmm2
WHERE iso_type LIKE [ISO_TYPE] AND hmm_acc LIKE “TIGR%”
SELECT DISTINCT (i.feat_name), i.com_name, i.gene_sym, i.ec#, i.locus, i.complete, e.accession
FROM [DB_NAME]_name..ident i, [DB_NAME]_name evidence e, [DB_NAME]_..asm_feature a, DB_NAME]_..stan s
WHERE (i.feat_name = e.feat_name) AND (s.asmbl_id=a.asmbl_id) AND (s.iscurrent = 1) AND
(a.feat_type LIKE ‘ORF’) and (e.accession LIKE [HMM_ID]) and (e.ev_type LIKE [EV_TYPE]) AND (e.curated = 1)
SELECT COUNT (go_id)
FROM [DB_NAME]..go_role_link WHERE feat_name LIKE [FEATURE_ID]
Figure 7. Several of queries executed by ACT were in need of optimization to ensure a more efficient overall average runtime.
In the first iteration of ACT, five different SQL commands are executed. The first
command extracts all the organisms “of interest”. The second command extracts the scientific
name of a specified database. The third command extracts all the HMMs of a specified isology
and each HMM’s associated information. The fourth command extracts all features and their
associated information in a specified database of specified HMM and evidence type. The fifth
command returns the number of GO IDs assigned to specified feature in specified database.
A seemingly minor alteration was made to several ‘where’ clauses of specific queries.
This minor alteration was simply replacing “LIKE” with an “=”. This simple change reduced the
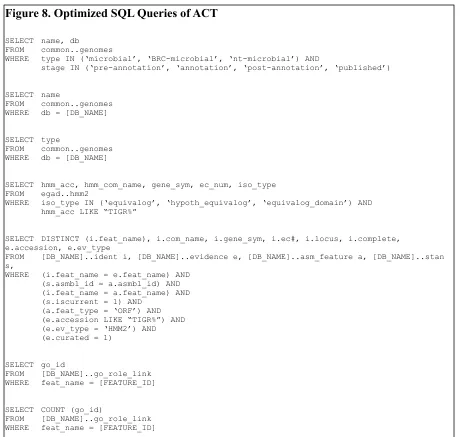
While a significant impact was made with such a simple change, major changes in the
[image:29.612.68.528.126.563.2]SQL queries were made to accommodate the new algorithm, Figure 8.
Figure 8. Optimized SQL Queries of ACT
SELECT name, db FROM common..genomes
WHERE type IN (‘microbial’, ‘BRC-microbial’, ‘nt-microbial’) AND
stage IN (‘pre-annotation’, ‘annotation’, ‘post-annotation’, ‘published’)
SELECT name
FROM common..genomes WHERE db = [DB_NAME]
SELECT type
FROM common..genomes WHERE db = [DB_NAME]
SELECT hmm_acc, hmm_com_name, gene_sym, ec_num, iso_type FROM egad..hmm2
WHERE iso_type IN (‘equivalog’, ‘hypoth_equivalog’, ‘equivalog_domain’) AND hmm_acc LIKE “TIGR%”
SELECT DISTINCT (i.feat_name), i.com_name, i.gene_sym, i.ec#, i.locus, i.complete, e.accession, e.ev_type
FROM [DB_NAME]..ident i, [DB_NAME]..evidence e, [DB_NAME]..asm_feature a, [DB_NAME]..stan s,
WHERE (i.feat_name = e.feat_name) AND (s.asmbl_id = a.asmbl_id) AND (i.feat_name = a.feat_name) AND (s.iscurrent = 1) AND
(a.feat_type = ‘ORF’) AND (e.accession LIKE “TIGR%”) AND (e.ev_type = ‘HMM2’) AND (e.curated = 1)
SELECT go_id
FROM [DB_NAME]..go_role_link WHERE feat_name = [FEATURE_ID]
SELECT COUNT (go_id)
FROM [DB_NAME]..go_role_link WHERE feat_name = [FEATURE_ID]
Figure 8. Several queries were optimized with a simple substitution of “LIKE” with an “=”. Other queries were reformatted to accommodate the improved algorithm of ACT.
The first command extracts all the organisms “of interest”. The second command extracts
the scientific name of a specified database. The third command extracts the genome type of the
specified database. The fourth command extracts all the HMMs of a specified isology and each
information. The sixth command returns the GO IDs associated assigned to the specified feature
in the specified database. The seventh command extracts the number of GO IDs assigned to the
specified feature in the specified database.
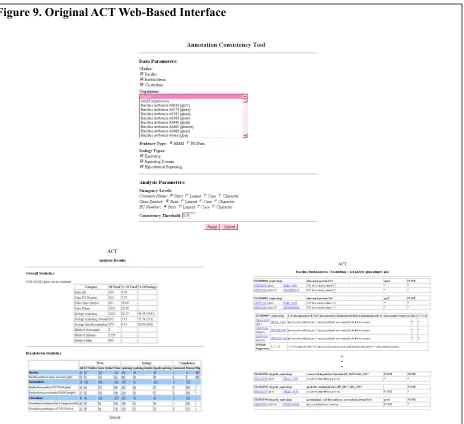
Web Interface Development
The Web interface of the first iteration of ACT was developed solely with HTML (Figure
9). Due to the amount of information returned by ACT, the Web page was easily cluttered with
In an attempt to address these issues, the Web interface of the current iteration of ACT, as
seen in Figure 10, utilizes several technologies including CSS, JavaScript, and AJAX to reduce
the overwhelming amount of information into a more organized display. The application of
jQuery has introduced, with great simplicity and ease, the use of JavaSript and AJAX to ACT as
[image:31.612.77.541.73.497.2]well as the ability to manipulate existing CSS. Figure 9. Original ACT Web-Based Interface
In the start-up page, jQuery was used to filter the list of genomes in the select list by
genome type and annotation stage, Figure 11. There several options to filter the list of genomes
from which users select. The genome types include microbial genomes, BRC-microbial
genomes, and NT-microbial genomes. Genomes of type BRC-microbial are genomes sequenced
on the BRC contract. Genomes of type NT-microbial are genomes sequenced from an external
sequencing center. Genomes of type microbial are genomes sequenced and annotated internally
at JCVI. For each of the genome types, the user simply selects the annotation stage(s)
[image:32.612.75.541.95.323.2](pre-annotation, (pre-annotation, post-(pre-annotation, published, and completed) of interest. Figure 10. Improved ACT Web-Based Interface
For the ACT Results page, jQuery is used to dynamically display the HMM results based
on the category selected by the user. Each of the links in the Breakdown Statistics section toggles
[image:33.612.76.540.78.228.2]the inconsistency information tables in the Inconsistency section as seen in Figure 12. Figure 11. Genome List Filtering
[image:33.612.78.535.371.671.2]Figure 11. The use of jQuery enables the filtering of the genome list by genome type and annotation stage. The selection area is populated with genomes based on the filters selected.
Figure 12. Interactive ACT Results Page
When first loaded, the Inconsistency section is empty as no links have been selected.
However, when the user selects a link, the appropriate inconsistency information tables populate
the Inconsistency section of the ACT Results page.
Inconsistency information tables can also be toggled as seen in Figure 13. Depending on
the assessment status of the evidence, the evidence table is either display collapsed or expanded.
If assessment for a specified evidence has been completed, the information table is displayed in
the collapsed view. If assessment for a specified evidence has not yet been completed, the
information table is displayed in the expanded view.
By clicking the toggle icon, , the inconsistent gene information is collapsed, leaving
only the evidence information to be visible. By clicking the toggle icon, , the hidden the
inconsistent gene information is fully displayed.
With the addition of these technologies, ACT’s Web-based interface had improved from
the very superficial aesthetic upgrades to the structural upgrades for improved dynamics. Figure 13. Interactive Individual Inconsistency Information Table View
“Collapsed” Display
“Expanded” Display
Genome Data Set Expansion
The first iteration of ACT targeted the 86 of BRC-Pathema’s microbial genomes.
However, the goal of ACT was, ultimately, to analyze the Comprehensive Microbial Resource
(CMR) database. The current iteration of ACT now includes the more than 500 completed
genomes and several hundred other prokaryotic genomes in production in the CMR database.
As of 16 April 2009, there are 881 genomes within the scope of ACT. These include
genomes of various types and in different stages of the annotation pipeline as seen in Table 2.
The “types” of genomes include microbial genomes, BRC-microbial genomes, and NT-microbial
genomes. The “stages” of annotation include pre-annotation, annotation, post-annotation,
published, and completed genomes.
Table 2. Genome Categorization
Annotation Stage
Pre-Annotation Annotation AnnotationPost- Published Completed ACT Total Total
Gen ome Typ
e
Microbial 24 153 38 53 18 286 709
BRC-Microbial 1 4 0 14 92 111 113
NT-Microbial 10 48 0 425 1 484 816
ACT Total 35 205 38 492 111 881 1638
Total 60 307 79 510 112 1068
*As of 16 April, 2009
Results
ACT Structure
ACT consists of several core interdependent Perl modules: ACT.pm, CompareACT.pm,
QueryACT.pm, ParseACT.pm, PrintACT.pm, and CommentACT.pm. The relationships
among the modules are depicted in Figure 14.
Each module was designed to perform a particular set of functions. These functions are
described below:
• ACT. ACT.pm is the central, core analysis module. ACT.pm was designed to prepare
and execute the core analysis. There is only one subroutine defined in ACT.pm:
[image:36.612.136.479.221.495.2]analyze().
Figure 14. ACT Module Relationship Diagram
o analyze(): This is the sole method that is called by either the command-line
program or the CGI to execute the analysis. Given a query object, the reference to
the one-dimensional array of organisms, the reference to the one-dimensional
array of evidence types, the stringency level on which to compare common
names, the stringency level on which to compare gene symbols, and the
stringency level on which to compare EC numbers, the method will perform the
consistency analysis and return, as a result, a reference to a four-dimensional hash
(quadruple-key hash) of statistics by clade and organism, a reference to a
two-dimensional hash (double-key hash) of overall statistics, a reference to a
one-dimensional hash (single-key hash) of one-one-dimensional arrays of inconsistent
evidence and genes information, a reference to a one-dimensional hash
(single-key hash) of evidence objects, a reference to a one-dimensional hash (single-(single-key
hash) of gene objects, and a reference to a one-dimensional hash (single-key hash)
of genome objects.
o init_all_genomes(): Given a reference to a one-dimensional array of
organisms, a reference to a one-dimensional array of evidence, and a query object,
this method initializes genome objects for each organism. Genome initialization
includes the initialization of each organisms genes which is performed by the
init_all_genes() method as well as records all information on evidence
and its associated genes. This method returns a reference to a one-dimensional
(single-key hash) linking evidence to its associated genes, and a reference to a
one-dimensional hash (single-key hash) of gene objects.
o init_all_genes(): Given an organism’s database ID and a query object,
this method initializes gene objects for each gene within the specified genome as
well as records information on the evidence used to annotate the genes. This
method returns a reference to a one-dimensional hash (single-key hash) of gene
objects and a reference to a one-dimensional hash (single-key hash) linking
evidence to its associated genes.
o init_all_evidence(): Given a reference to a two-dimensional hash
(double-key hash) of evidence information and a query object, this method
initializes an evidence object for each evidence and returns a one-dimension hash
(single-key hash) of evidence objects.
o unique_array(): Given a one-dimensional array, this method removes its
redundant elements. This method then returns a reference to the one-dimensional
array of unique elements.
o get_percent(): Given a numerator, a denominator, a numerical figure
reflecting the desired place value, this method determines and returns the
percentage value of the numerator and denominator.
• CompareACT. CompareACT.pm is a string comparing module. CompareACT.pm was
designed to perform string comparisons of varying stringency levels. The following are
o check(): Given two strings and a stringency level (string), this method will
perform a comparison of the two strings using the specified level of stringency.
The options for stringency level are: strict, lenient, case, and char.
strict - Case sensitive and complete match. lenient - Case insensitive and partial match.
case - Case sensitive, but partial match. char - Case insensitive, but complete match.
o strict(): Given two strings, this method will perform a case-sensitive and
complete string comparison. Only exact matches will return true.
Example: “GenOMes” matches only “GenOMEs”. It will not match
“genomes” or “metaGenOMes”.
o lenient(): Given two strings, this method will perform a case-insensitive and
partial string comparison.
Example: “GenOMes” matches “GenOMes”, “genomes”, and
“metaGenOMes”.
o case(): Given two strings, this method will perform a case-sensitive and partial
string comparison.
Example: “GenOMes” matches “GenOMes” and “metaGenOMes”. It
will not match “genomes”.
o char(): Given two strings, this method will perform a case-insensitive and
Example: “GenOMes” matches “GenOMes” and “genomes”. It will not
match “metaGenOMes”.
• QueryACT. QueryACT.pm is a database querying module. QueryACT.pm was
implemented and designed to be the database interface (DBI) for ACT. Essentially all
queries made by ACT are performed by executing a method in the QueryACT.pm
module. The following are methods defined within the QueryACT.pm module:
o get_all_db(): This method extracts all genomes (scientific name, database
name, genome type, and annotation stage) with a genome type of BRC-microbial,
nt-microbial, and microbial and in pre-annotation, annotation, post-annotation,
published, or completed annotation stage.
o get_db_org(): Given the database name, this method returns the scientific
name (field: common..genomes.name).
o get_db_type(): Given the database name, this method returns the genome
type (field: common..genomes.type).
o get_all_hmm(): This method extracts all TIGRFAM HMMs with an isology
type of equivalog, hypothetical equivalog, and equivalog domain.
o get_feat(): Given the database name, this method extracts the specified
organism’s curated genes annotated by a TIGRFAM HMM and has a feature type
of ‘ORF’.
o get_go(): Given the database name and the gene (feat_name), this method
o get_go_count(): Given the database name and the gene (feat_name), this
method returne the number of associated GO IDs.
• ParseACT. ParseACT.pm is a file-parsing module. ParseACT.pm was designed to
parse the contents of a file into data structures. The following are methods defined within
the ParseACT.pm module:
o ec_to_hash(): Given the file name of the IUBMB database flat file, this
method parses the file into a one dimensional hash (single-key hash) with the EC
number as the 'key' and the associated common name as the 'value'.
o file_to_array1(): Given a file name, this method parses the file into a one
dimensional array with each line of the file saved as an element in a
one-dimensional array.
o file_to_array2(): Given the file name of a tab-delimited file, this method
parses the file into a two dimensional array.
o file_to_hash1(): Given the file name of a tab-delimited or '='-delimited
file, this method parses the file into a one dimensional hash (single-key hash) in
which data to the left of the [tab]/'=' is the 'key' and data to the right of the
[tab]/'=' is the 'value'.
• PrintACT. PrintACT.pm is a printing module used solely by the command-line version
of ACT. PrintACT.pm was designed to print a data structure out to standard out or to a
text file in a meaningful way. The following are methods defined within the
o array1_to_stdout(): Given a reference to a one-dimensional array, this
method prints a one-dimensional array to standard out.
o hash1_to_stdout(): Given a reference to a one-dimensional hash, this
method prints a one-dimensional hash (single-key hash) to standard out.
o hash2_to_stdout(): Given a reference to a two-dimensional hash, this
method prints a two-dimensional hash (double-key hash) to standard out.
o hash3_to_stdout(): Given a reference to a three-dimensional hash, this
method prints a three-dimensional hash (triple-key hash) to standard out.
o string_to_text(): Given a string and a file name, this method prints a
string out to a text file with the specified file name.
o array1_to_text(): Given a reference to a one-dimensional array and a file
name, this method prints a one-dimensional array out to a text file with the
specified file name.
o array2_to_text(): Given a reference to a two-dimensional array and a file
name, this method prints a two-dimensional array as a tab-delimited table out to a
text file with the specified file name.
o hash2_to_text(): Given a reference to a two-dimensional hash, a reference
to a one-dimensional array of column names, a file name, and the “first column
name” (Cell (0,0)), this method prints a two-dimensional hash (double-key hash)
as a tab-delimited table out to a text file with the specified file name.
• CommentACT. CommentACT.pm controls access to and from the flat file containing
o to_hash(): Given the file name of the tab-delimited comments flat file, this
method extracts the evidence ID, the commenters’ user names, the timestamps of
each comment, and the comments and saves each comment into a
three-dimensional hash (triple-key hash) with the first key as the evidence ID, the
second key as the user name, the third key as the timestamp, and the comment as
the triple keyed value.
o to_file(): Given the file name of the comments flat file, the evidence ID, the
commentor’s user name, the timestamp of the comment, and the comment, this
method appends the new comment to the comments flat file.
ACT Objects
As previously mentioned, ACT accesses three databases to obtain information on
genomes, its associated genes, and linked evidence, which, in this case, are HMMs as seen in
Figure 15. To hold the associated information, ACT generates three object types: a Genome
object, a Gene object, and an Evidence object. A Genome object holds the genome’s scientific
name, database name, clade, genome type, and an array of gene objects. A Gene object hold the
gene’s feature ID, common name, gene symbol, EC number, genome, locus, complete, accession,
and evidence. An Evidence object holds the accession number, common name, gene symbol, EC
Figure 15. Object Oriented Design
Figure 15. ACT accesses information on genomes, its genes, and the linked HMM evidence. ACT generates an object type for each of the main identities: a Genome object, a Gene object, and an Evidence object.
ACT Overview
As with the first iteration of ACT, the current iteration of ACT is also available in one of
two functionally equivalent forms: a command line executable or a Web-based application. Both
command-line ACT and Web ACT, require several parameters which include a list of organisms
or database names, the evidence type, and the stringency levels by which to compare common
names, gene symbols, and EC numbers.
If the a gene’s associated common name, gene symbol, or EC number string does not
match the current HMM’s common name, gene symbol, or EC number, then the current gene
will be flagged as inconsistent and the inconsistency counts will be incremented accordingly.
ACT tallies these inconsistencies into several statistical categories which are reported in both the
Overall Statistics and Breakdown Statistics for a given ACT run:
• Inconsistencies by data type:
o Common name inconsistencies: Number of genes with an inconsistent common
name.
o Gene symbol inconsistencies: Number of genes with an inconsistent gene symbol.
o EC number inconsistencies: Number of genes with an inconsistent EC number.
• Inconsistencies by isology
o Equivalog inconsistencies: Number of equivalog-based genes with at least one
inconsistent descriptor.
o Equivalog domain inconsistencies: Number of equivalog domain-based genes
with at least one inconsistent descriptor.
o Hypothetical equivalog inconsistencies: Number of hypothetical equivalog-based
genes with at least one inconsistent descriptor.
• Inconsistencies by completion method
o Automated inconsistencies: Number of genes annotated by AutoAnnotate with at
least one inconsistent descriptor.
o Mapping inconsistencies: Number of genes annotated by MUMmer with at least
one inconsistent descriptor.
o Manual inconsistencies: Number of genes manually annotated with at least one
inconsistent descriptor.
Once the analysis completes, these tallies are organized to report an overall statistic in
addition to statistics by clade as well as by organism. Although both the command-line and
means of passing the required analysis parameters and the display of results are discussed in the
following sections.
Command-line ACT
In the command-line version of ACT, the user dictates the parameters of the analysis by
designating specific files in the convocation of the program as seen in Figure 16.
Figure 16. Command-line Invocation
perl commandACT.pl [org.txt] [ev_type.txt] [cn_level] [gs_level] [ec_level]
Figure 16. The command-line invocation of ACT requires the specification of five parameters: two text files and three strings (“strict”, “lenient”, “char”, or “case”).
The first argument, [org.txt], is a text file containing a list of organism database IDs of
interest. Each line of the text file consists only of a single database ID. The second argument,
[ev_type.txt], is a text file containing the evidence types of interest. It is important to note that
ACT only evaluates evidence types of type “HMM2”. More specifically, ACT retrieves
TIGRFAM HMMs based on the isology type of “equivalog” which include equivalog HMMs,
equivalog domain HMMs, and hypothetical equivalog HMMs. The third, fourth, and fifth
parameters ([cn_level] [gs_level] [ec_level]) specify stringency levels on which to
compare common names, gene symbols, and EC numbers respectively. There are currently four
types of stringency levels from which the user can choose: strict, lenient, case, and
char. The “strict” option performs a case-sensitive and complete string comparison. The
option performs a case-sensitive but partial string comparison. The “char” option performs a
case-insensitive but complete string comparison.
To run default parameters, the user simply specifies “default” for the desired
argument(s). If “default” is specified for the first argument, [org.txt], command-line ACT
will parse the file DEFAULT_ORGANISMS.txt found in the /data/ directory of ACT directory.
This file contains the 881 organisms within the scope of ACT. If “default” is specified for the
second argument, [ev_type.txt], command-line ACT will parse the file
DEFAULT_EVIDENCE.txt found in the /data/ directory of ACT directory. This file currently
contains only “HMM2” as ACT is only capable of analyze evidence of type “HMM2”. If
“default” is specified for the third argument, [cn_level], command-line ACT will run a
strict stringency level comparison of common names. If “default” is specified for the fourth
argument, [gs_level], command-line ACT will run a lenient stringency level comparison of
gene symbols. If “default” is specified for the fourth argument, [ec_level], command-line
ACT will run a strict stringency level comparison of EC numbers.
When the analysis is completed, three text files are generated by the command-line
version of ACT: act_overall.txt, act_breakdown.txt, and act_results.txt.
The act_overall.txt file is a tab-delimited table of the overall inconsistency statistics
The act_breakdown.txt file consists of a tab-delimited table of statistical
information on the aforementioned categories are broken down by clade and by organism as seen
in Figure 18.
The act_results.txt file consists of the inconsistent evidence and genes
[image:48.612.120.496.76.193.2]information as seen in Figure 19. For each evidence, its accession number, common name, gene Figure 17. Command-line Results – Overall Statistics
Figure 17. The act_overall.txt file consists of a tab-delimited table of the overall
[image:48.612.119.498.337.592.2]inconsistency statistics.
Figure 18. Command-line Results – Breakdown Statistics
Figure 18. The act_breakdown.txt file consists of a tab-delimited table of the inconsistency
symbol, and EC number are displayed. Immediately following are the associated genes deemed
to be inconsistent with the common name, gene symbol, and/or EC number assignments of the
current evidence. For each gene, its feature ID, organism database ID, locus, common name,
gene symbol, and EC number are displayed. When an assignment matches the evidence, an
asterisk is inserted into the appropriate field. Finally, if applicable, nomenclature suggestions
[image:49.612.109.489.245.502.2]from the IUBMB are listed.
Figure 19. Command-line Results – Inconsistent Evidence
Figure 19. The act_results.txt file consists of a tab-delimited list of inconsistent evidence and the associated genes.
Web ACT
In the Web-based version of ACT, the user dictates the parameters of the analysis by
filling in the Web form as seen in Figure 20. The Genome Selection section of form allows the
user to filter the genomes to be listed in the Web select area by selecting or deselecting HTML
Web select area. Selected genomes will be highlighted. The Analysis Options section of the form
allows the user to select evidence type to analyze as well as the stringency levels on which to
compare common names, gene symbols, and EC numbers. It is important to note that ACT only
evaluates evidence types of type “HMM2”. More specifically, ACT retrieves TIGRFAM HMMs
based on the isology type of “equivalog” which include equivalog HMMs, equivalog domain
HMMs, and hypothetical equivalog HMMs. As with the command-line version of ACT, there are
currently four types of stringency levels from which the user can choose: strict, lenient, case, and
char. The “strict” option performs a case-sensitive and complete string comparison. The
“lenient” option performs a case-insensitive and partial string comparison. The “case”
option performs a case-sensitive but partial string comparison. The “char” option performs a
case-insensitive but complete string comparison.
In the Analysis Options section, the parameters have already been set to default. The
Evidence Type defaults to “HMM2” as ACT can only analyze evidence of type “HMM2”. The
Common Name Stringency Level is set to “strict”. The Gene Symbol Stringency Level is set
Figure 20. Web-based Start-up Page
Figure 20. On the Start-up Page, the user specifies the genomes and evidence types to be analyzed and the stringency levels on which to compare common names, gene symbols, and EC numbers.
When the analysis is completed, Web-based ACT generates the Overall Statistics and
Breakdown Statistics sections of results as seen in Figure 21. The Overall Statistics section
consists of the overall statistics information. The Breakdown Statistics section consists of
The Inconsistency section consists of the inconsistent evidence and genes information is
populated only when a chosen statistic has been toggled. Each number reported in the
Breakdown Statistics section toggles the specific HMMs responsible for the chosen statistics as
[image:52.612.129.483.72.332.2]seen in Figure 22.
Figure 21. Web-based Results – Overall & Breakdown Statistics
For each evidence table, several pieces of information are returned as seen in Figure 23.
This includes evidence information such as evidence accession number, common name, gene
symbol, and EC number. For each evidence, all associated inconsistent genes are listed along
with their information (feature name, locus ID, common name, gene symbol, and EC number).
When an assignment matches the evidence, an asterisk is inserted into the appropriate field.
[image:53.612.130.483.64.438.2]Finally, if applicable, nomenclature suggestions from the IUBMB are listed. Figure 22. Web-based Results – Inconsistent Evidence
Figure 23. Individual Inconsistent Evidence
Figure 23. Each inconsistent information table displays the common names, gene symbols, and EC numbers information for an evidence and its associated genes. Nomenclature suggestions are also listed.
The feature names are external links to MGAT, or the Multiple Gene Alignment Tool,
page, allows the annotator to simultaneously annotate related genes in multiple genomes (Figure
24). Similarly, the locus IDs are links to the gene’s corresponding Gene Curation page, JCVI’s
manual annotation tool (Figure 25). These links offer JCVI’s curators a more direct means of
editing gene assignments to correct the individual inconsistencies and inaccuracies found by
Figure 24. MGAT Page
Figure 24. Sample Multiple Gene Alignment Tool (MGAT) page.
Figure 25. Gene Curation Page
In the upper right hand corner of each inconsistent evidence table, are two icons as seen
in Figure 26. These images allow access to the comment functionality of Web-based ACT.
The icon, , when clicked, displays the comments for the current evidence. The
comments are displayed in a simple table as seen in Figure 27 (left image). The first column is
the username of the commenter, the second column is the timestamp in the format of: date month
year time. The local time is given in the 24-hour format (ex. 13:57 is 1:57PM). There are three
values designated as the time: hours:minutes:seconds. The third column is the actual comment
made. So, in the case of the first comment listed, the user, ‘abenjamin added a comment on
evidence ‘TIGR01469’ saying “Another comment has been entered for TIGR01469” on May 8
of 2009 at the time of 19:27:40. Finally, the fourth column is an indication of the assessment
status. If the value in this column is “false”, then assessment was not completed during the time
the comment was made. If the value is “true”, the assessment has been completed. If no
comments exist for the current evidence, an appropriate message in the format of “No comments
for [EVIDENCE_ACCESSION]” is displayed. The user is also provided with a link to the Add
Comment form.
Figure 26. Comments Function Icons
The icon, , when clicked, displays a form that allows user to add comments on the
current evidence as seen in Figure 28. Two of the four fields are automatically filled by ACT.
The auto-filled fields are the evidence ID field and the date, or timestamp, field so as to maintain
the proper format. The user is required to fill out both the user name field and, of course, the
comment field. The last field, “Assessment Completed”, indicates to ACT whether or not
assessment for the specified HMM has been completed. ACT defaults at “no”, but when the user
specifies “yes” for this field, ACT will treat the specified HMM as having been assessed in future
[image:57.612.72.539.97.259.2]ACT runs.
Figure 27. Reading Comments
Figure 28. Adding Comments
Figure 28. The Add Comment form allows users to add comments to the current evidence. An empty form (left image) is first displayed. The user then specifies her username and her comment (right image).
When the ‘Add Comment’ form is submitted by the user, a message is displayed. If the
comment was successfully saved, a “success” message is displayed on the browser along with a
link to the ‘Read Comment’ page (Figure 29, left image). However, if the submission was not
successful because the user did not complete a field, a “failure” message is displayed (Figure 29
right image). This message indicates “An error has occurred. Please check that all fields have
Figure 29. Add Comments Messages
Figure 29. A success message (left image) is reported when the comment was saved. A failure message (right image) is reported when an error has occurred.
ACT Results Analysis
Analyses on all genomes within the scope of ACT were performed. The analyses were
divided into three separate runs, one for each of the genome types: microbial genomes,
BRC-microbial genomes, and NT-BRC-microbial genomes. The following results were reported.
In the analysis of the 286 microbial genomes, a total of 139,784 genes were analyzed as
seen in Figure 30. Of those genes, 46,347 were found to be inconsistent with the evidence used
In the analysis of the 111 BRC-microbial genomes, a total of 85,161 genes were analyzed
as seen in Figure 31. Of those genes, 29,072 were found to be inconsistent with the evidence
[image:60.612.142.472.69.292.2]used as the basis to assign functional annotation to them.
Figure 30. Analysis Results for Microbial Genomes
[image:60.612.138.474.443.668.2]Figure 30. Statistical results of the analysis of all microbial genomes as of 16 April 2009.
Figure 31. Analysis Results for BRC-Microbial Genomes
In the analysis of the 484 NT-microbial genomes, a total of 278,215 genes were analyzed
as seen in Figure 32. Of those genes, 87,961 were found to be inconsistent with the evidence
[image:61.612.139.474.163.371.2]used as the basis to assign functional annotation to them.
Figure 32. Analysis Results for NT-Microbial Genomes
Discussion
ACT Evaluation
ACT has undergone a drastic reconstruction all in the name of usability. A simple
alteration in the SQL queries resulted in approximately a 33% decrease in the average runtime
per genome from one (1) minute per genome to forty-one (41) seconds per genome.
Restructuring the algorithm to reduce the number of iterations decreased the average runtime per
genome to two (2) seconds. That is an approximate decrease of 95% of the improved runtime
average (after SQL optimization) and approximately 97% from the original runtime average.
Implementing a more dynamic interface for Web-based ACT allows for an easier, more
productive experience. The Web-based interface alone is more structured and organized with the
incorporation simple CSS. The use of jQuery enabled the incorporation of several new features.
The user can filter the list of genomes on the ACT Start-up Page form. The user is also able to
keep track of those HMMs which have already been assessed with the addition of the Comments
functionality. This reduces the chance that the user will evaluate the same evidence more than
necessary by keeping record of the assessments made for any single evidence. Also, only those
inconsistent evidence information tables which have not yet been viewed and commented on will
be showed in the expanded form. This reduces the clutter of information shown on the page.
However, even with these vast improvements to ACT, there remains room for further