Open Access
Research
Costs and consequences of large-scale vector control for malaria
Joshua O Yukich
1, Christian Lengeler*
1, Fabrizio Tediosi
1,2, Nick Brown
1,3,
Jo-Ann Mulligan
4, Des Chavasse
5, Warren Stevens
6, John Justino
7,
Lesong Conteh
1,4, Rajendra Maharaj
8, Marcy Erskine
9, Dirk H Mueller
4,
Virginia Wiseman
4, Tewolde Ghebremeskel
10, Mehari Zerom
10,
Catherine Goodman
4,11, David McGuire
12, Juan Manuel Urrutia
13,
Fana Sakho
14, Kara Hanson
4and Brian Sharp
Address: 1Department of Public Health and Epidemiology, Swiss Tropical Institute, P.O. Box, 4002 Basel, Switzerland, 2Centre for Research on
Health and Social Care Management, Università Bocconi, Milan, Italy, 3ITN Cell, National Malaria Control Programme, Ministry of Health, Dar
Es Salaam, Tanzania, 4Health Economics and Financing Programme, London School of Hygiene and Tropical Medicine, Keppel Street, London,
WC1E 7HT, UK, 5Population Services International, Nairobi, Kenya, 6Medical Research Council Laboratories, Banjul, Gambia, 7Population
Services International, Blantyre, Malawi, 8Malaria Lead Programme, Medical Research Council of South Africa, Durban, KwaZulu-Natal, South
Africa, 9Canadian Red Cross, Ottawa, Ontario, Canada, 10National Malaria Control Programme, Ministry of Health, P.O. Box 212, Asmara, Eritrea, 11KEMRI/Wellcome Trust Programme, PO Box 43640, Nairobi, Kenya, 12Abt Associates Inc., Bethesda, MD, USA, 13NetMark Partnership, Academy
for Educational Development, Johannesburg, South Africa and 14NetMark Partnership, Academy for Educational Development, Dakar, Senegal
Email: Joshua O Yukich - [email protected]; Christian Lengeler* - [email protected];
Fabrizio Tediosi - [email protected]; Nick Brown - [email protected]; Jo-Ann Mulligan - [email protected]; Des Chavasse - [email protected]; Warren Stevens - [email protected]; John Justino - [email protected];
Lesong Conteh - [email protected]; Rajendra Maharaj - [email protected]; Marcy Erskine - [email protected]; Dirk H Mueller - [email protected]; Virginia Wiseman - [email protected];
Tewolde Ghebremeskel - [email protected]; Mehari Zerom - [email protected];
Catherine Goodman - [email protected]; David McGuire - [email protected]; Juan Manuel Urrutia - [email protected]; Fana Sakho - [email protected]; Kara Hanson - [email protected]; Brian Sharp - [email protected]
* Corresponding author
Abstract
Background: Five large insecticide-treated net (ITN) programmes and two indoor residual spraying (IRS) programmes were compared using a standardized costing methodology.
Methods: Costs were measured locally or derived from existing studies and focused on the provider perspective, but included the direct costs of net purchases by users, and are reported in 2005 USD. Effectiveness was estimated by combining programme outputs with standard impact indicators.
Findings: Conventional ITNs: The cost per treated net-year of protection ranged from USD 1.21 in Eritrea to USD 6.05 in Senegal. The cost per child death averted ranged from USD 438 to USD 2,199 when targeting to children was successful.
Long-lasting insecticidal nets (LLIN) of five years duration: The cost per treated-net year of protection ranged from USD 1.38 in Eritrea to USD 1.90 in Togo. The cost per child death averted ranged from USD 502 to USD 692.
Published: 17 December 2008
Malaria Journal 2008, 7:258 doi:10.1186/1475-2875-7-258
Received: 27 October 2008 Accepted: 17 December 2008
This article is available from: http://www.malariajournal.com/content/7/1/258
© 2008 Yukich et al; licensee BioMed Central Ltd.
IRS: The costs per person-year of protection for all ages were USD 3.27 in KwaZulu Natal and USD 3.90 in Mozambique. If only children under five years of age were included in the denominator the cost per person-year of protection was higher: USD 23.96 and USD 21.63. As a result, the cost per child death averted was higher than for ITNs: USD 3,933–4,357.
Conclusion: Both ITNs and IRS are highly cost-effective vector control strategies. Integrated ITN free distribution campaigns appeared to be the most efficient way to rapidly increase ITN coverage. Other approaches were as or more cost-effective, and appeared better suited to "keep-up" coverage levels. ITNs are more cost-effective than IRS for highly endemic settings, especially if high ITN coverage can be achieved with some demographic targeting.
Background
Prevention of malaria in highly endemic countries relies largely on vector control through one of two main meth-ods: insecticide treated (mosquito) nets (ITNs) and indoor residual (house) spraying (IRS). Both methods are known to be highly effective and current evidence suggests they are very similar in their impact [1]. Given the increas-ing availability of resources for malaria control, the Roll Back Malaria Partnership (RBM) has set the ambitious tar-get for 2010 of 80% protection of high-risk groups by a "locally appropriate" vector control measure [2]. While few countries were near this objective in 2007, substantial progress has been made. Inevitably, this has been accom-panied by vigorous debate as to the best way forward with regard to the different implementation models for ITNs, as well as the relative merits of ITNs versus IRS [3-8]. While the implementation of IRS is typically through ver-tical programmes, available options for ITN implementa-tion are more diverse.
Besides feasibility, sustainability and health impact, cost is obviously an important factor in the choice between dif-ferent strategic options. Unfortunately, little is known on comparative costs and operational requirements for the delivery of ITNs and IRS. Direct comparisons in single set-tings in sub-Saharan Africa (SSA) have shown conflicting results on cost per person protected using either control method [9-11]. A comprehensive modelling study has been conducted covering ITNs and IRS [12] and the authors found overlapping cost-effectiveness ranges for the two interventions. For ITNs, four studies have exam-ined large-scale programmes using field data in The Gam-bia, Malawi, Tanzania and Togo [13-16]. However, each of these studies focused on only one strategy and method-ological differences make direct comparisons difficult [17]. With the scale up of ITN activities in several SSA countries it has become possible to collect and analyse such information for a range of settings. This was under-taken for ITNs in five sub-Saharan countries, and for IRS in two countries. The present work allows, for the first time, a direct cost-effectiveness comparison between dif-ferent ITN strategies and IRS implementation on a large scale. Hence, this work provides a solid evidence base for
a discussion of malaria vector control strategies in the most highly malarious areas of the world.
Methods
Programme selection
The ITN programmes were deliberately chosen to repre-sent the major existing distribution strategies operating at large or fully national scale in sub-Saharan Africa. At the beginning of this research, few large-scale ITN pro-grammes utilizing similar distribution systems existed, thus the choice of a representative country for each strat-egy was limited. The main exception was subsidized com-mercial distribution, which was implemented in several countries. Senegal was chosen for this category mainly to increase representation of West African countries. The strategies were defined using terminology derived from Webster et al [18]: (1) free ITN delivery through public sector health services and at the community level – Eritrea [19,20]; (2) free public sector ITN delivery through inte-grated vaccination campaigns – Togo [21]; (3) highly sub-sidized mixed public-private sector ITN delivery through routine services – Malawi [22]; (4) partially subsidized private retail sector promotion – Senegal [23]; (5) par-tially subsidized private retail sector promotion with a partially subsidized, mixed public-private, routine serv-ices voucher scheme – Tanzania [24]. Table 1 presents programme details with regard to size, time frame, total economic costs and the latest available coverage figures.
The ITN programmes also adopted different strategies for the provision of re-treatments for existing nets: Eritrea – free re-treatment through community level campaigns, Malawi – commercial sector cost recovery sales in urban areas, Senegal – partially subsidized private retail sector promotion, and Tanzania – cost recovery private retail sec-tor sale and free delivery to pregnant women at antenatal care visits. Unfortunately, empirical cost evidence was only available for a single country where long-lasting insecticidal nets (LLINs) were introduced, doing away with the need for re-treatment (Togo).
both. They represented: (1) a programme funded locally (KwaZulu-Natal, South Africa) and (2) an international intervention funded by donors and a public-private part-nership (Lubombo Spatial Development Initiative – LSDI, Southern Mozambique).
The full programme descriptions are available elsewhere [25].
Costs
The data on costs were either collected retrospectively for the purpose of the study from financial and operational records (Eritrea, Tanzania, Senegal, Malawi), or taken from raw data sets or published studies which could be adapted to this framework (KwaZulu-Natal, Mozam-bique, Malawi, Togo). The collection of cost data covered different periods between 1996–2005 (Table 1).
Where possible, the ingredients approach was used: inputs were identified, valued, and classified into activity categories. Where this approach was not possible, either because the information was deemed too sensitive (typi-cally for salaries) or was not available in adequate detail, aggregated expenditures were used. All costs were con-verted to United States Dollars (USD) based on official yearly average exchange rates for the period during which the costs were incurred (excepting Togo where the exchange rate for the month when most expenditure occurred was used). All costs were adjusted for inflation to 2005 prices using the US gross domestic product deflator [26]. Some costs were estimated using the WHO Choos-ing Interventions which are Cost-Effective (WHO-CHOICE) unit cost and activity database, specifically those for public sector inputs in Tanzania [27]. No
adjust-ments for purchasing power have been made, and in some cases this may result in problems of comparability across countries due to differences in country specific price lev-els.
Where possible, both financial and economic costs were collected in order to both estimate the financing require-ments for programmes and to examine their efficiency. Financial costs represent purely monetary flows, while economic costs represent the value (or opportunity cost) of all resources necessary to implement a given interven-tion. Only economic costs are presented here as they are considered the appropriate tool for comparisons of pro-gramme efficiency. Financial costs are available elsewhere [25].
A modified provider perspective was used; travel or time costs to users, or other household-level costs or cost sav-ings have not been included. However, the direct costs of net purchases incurred by users have been included where the nets were partially subsidized or sold at full cost. Dou-ble counting was avoided by excluding the provider costs which were offset by these user fees. Details on included costs are presented in Table 2.
Costing scenarios
[image:3.612.54.560.100.302.2]The base case costing scenarios relied on the following set of assumptions: a discount rate of 3% was applied to cap-ital costs; nets were assumed to last for three years (physi-cal lifetime), but the effect of initial treatment as well as of subsequent re-treatments were assumed to provide only one year of protection (protective lifetime) [28]; fifty per-cent of the nets delivered were assumed to be used by chil-dren under five years of age and only one child was
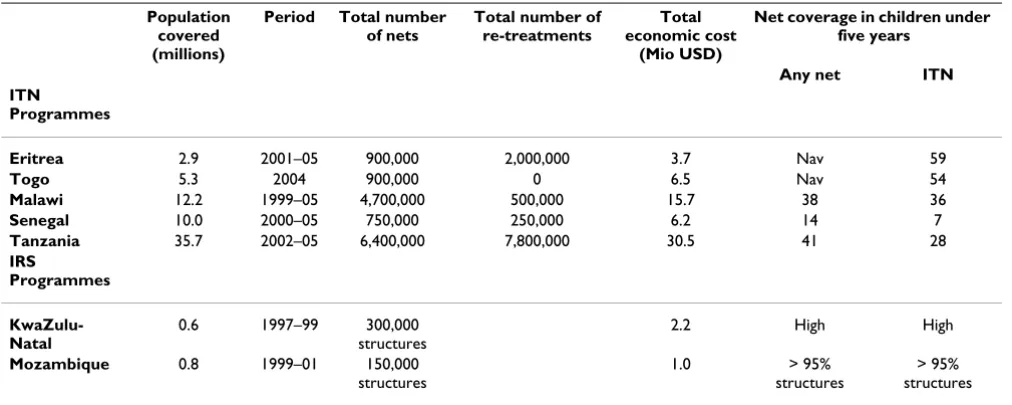
Table 1: Main characteristics of the ITN and IRS programmes that were reviewed.
Population covered (millions)
Period Total number of nets
Total number of re-treatments
Total economic cost
(Mio USD)
Net coverage in children under five years
Any net ITN ITN
Programmes
Eritrea 2.9 2001–05 900,000 2,000,000 3.7 Nav 59
Togo 5.3 2004 900,000 0 6.5 Nav 54
Malawi 12.2 1999–05 4,700,000 500,000 15.7 38 36
Senegal 10.0 2000–05 750,000 250,000 6.2 14 7
Tanzania 35.7 2002–05 6,400,000 7,800,000 30.5 41 28
IRS
Programmes
KwaZulu-Natal
0.6 1997–99 300,000
structures
2.2 High High
Mozambique 0.8 1999–01 150,000 structures
1.0 > 95%
structures
> 95% structures
assumed to sleep under each of these nets on a given night. These are believed to be conservative assumptions [19,29]. The cost of nets was based on the cost, insurance and freight (c.i.f.) price of the nets or on the full retail price paid by users plus any subsidies (direct or via vouch-ers) as estimated by survey data (Senegal and Tanzania) or key informant interviews and project records (Senegal and Malawi). For IRS, it was assumed that the given number of annual spraying rounds (one or two) protected an entire household for one year, with perfect post-spraying com-pliance (no re-plastering of walls). Reported coverage by IRS was always very high, over 95% at the time of data col-lection in Mozambique, though high levels of re-plaster-ing have been reported in some IRS interventions (Table 1) [30,31].
Several alternative scenarios were also calculated. One involved the delivery of conventional ITNs in Togo, where only long-lasting insecticidal nets (LLINs) were actually distributed. The other programmes distributed a majority of conventional nets and therefore the costs and outputs in Togo were recalculated assuming a net cost of only USD 3.00 instead of the USD 4.33 paid per LLIN [16,32]. Other alternative scenarios estimated the potential impact of LLIN use on the cost-effectiveness of the programmes. These scenarios were estimated in two ways. The first approach was simply to change the net parameters, including physical lifetime (three or five years), protective lifetime (three or five years) and cost (USD 5.00 to USD 7.00) to values believed to be representative of available LLINs, while not changing the properties, costs or benefits associated with re-treatments [31-34]. The second
approach used the same changes for the nets but removed the benefits and commodity costs associated with treat-ments. While it might be reasonable to expect that re-treatments will not be delivered in a LLIN programme, this dual approach was required due to difficulty in sepa-rating management and other costs associated with re-treatment. Thus, comparing the two approaches helped us to identify biases in the comparison between programmes due to different re-treatment approaches as well as to bet-ter quantify the potential benefits from a shift to LLINs, which would probably result in the discontinuation of most re-treatment activities. One way sensitivity analysis was conducted on all cost estimates.
Outputs
[image:4.612.53.556.99.296.2]Two main output measures were used for ITN pro-grammes: (1) number of nets delivered, and (2) number of re-treatments performed. These measures were used to calculate a third combined output measure: treated net years of protection (TNY), assuming that either a re-treat-ment or a new conventional ITN provided one potential year of protection for anyone sleeping under the net. For IRS programmes two related outputs have been measured: (1) number of persons of any age protected, and (2) number of under-five children protected. Both calcula-tions were made by applying the reported coverage rates to the total population of the sprayed areas – based on census information adjusted for population growth [35,36].
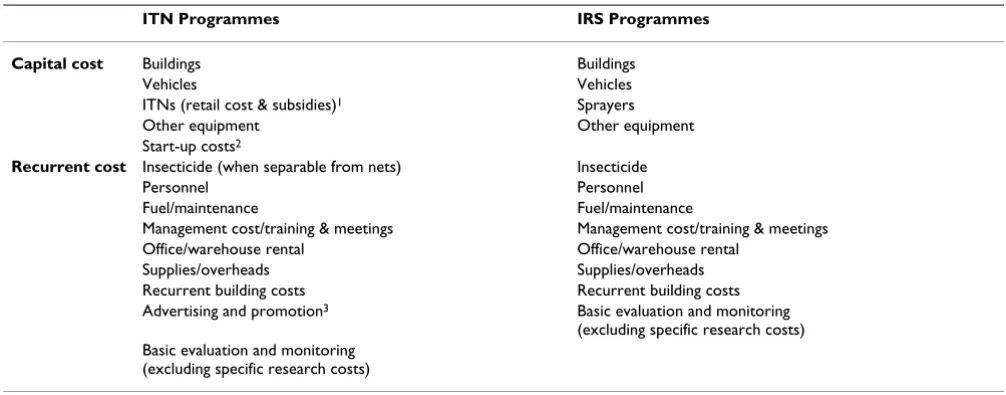
Table 2: Types of costs included in the analysis of the ITN and IRS programmes.
ITN Programmes IRS Programmes
Capital cost Buildings Buildings
Vehicles Vehicles
ITNs (retail cost & subsidies)1 Sprayers
Other equipment Other equipment
Start-up costs2
Recurrent cost Insecticide (when separable from nets) Insecticide
Personnel Personnel
Fuel/maintenance Fuel/maintenance
Management cost/training & meetings Management cost/training & meetings
Office/warehouse rental Office/warehouse rental
Supplies/overheads Supplies/overheads
Recurrent building costs Recurrent building costs
Advertising and promotion3 Basic evaluation and monitoring
(excluding specific research costs) Basic evaluation and monitoring
(excluding specific research costs)
1Procurement costs in Eritrea and Togo, subsidies plus user payments in Senegal, Tanzania, and Malawi.
2Economic costs which arose before outputs of those programmes occurred; these costs apply in Tanzania, Senegal and Malawi; they accounted for
fewer than 3% of total economic costs in all cases.
Outcomes
In order to combine cost data with public health impact, two outcomes were considered. First, the impact of ITNs and IRS on child mortality was estimated. Country-spe-cific estimates were not available but robust impact esti-mates are available for ITNs from a Cochrane review [37]: ITN use in a high endemicity and high coverage situation averts 5.5 child deaths per 1,000 child-years. For IRS, how-ever, unbiased impact estimates are scarce and have not been systematically reviewed. This is a recognized prob-lem and a Cochrane review is currently investigating this issue [38]. In the absence of a better data set for IRS, and because the impact of ITNs and IRS was found to be sim-ilar in the five available randomized comparisons [1,39], the same estimate of impact for both ITNs and IRS (i.e. 5.5 child deaths averted per 1,000 child-years of use) was applied.
Secondly, disability-adjusted life years (DALYs) averted, discounted at 3%, were calculated based on years of life lost due to malaria-specific child mortality. These calcula-tions exclude: (1) DALYs due to disability, and (2) DALYs lost in persons over five years of age. In highly endemic areas the burden of malaria is largely dominated by mor-tality in children under five years [40]. In addition, quan-titative data on the effects of the two interventions are very limited for older children and adults [40,41]. In areas of low malaria transmission or epidemic-prone areas, the burden of disease is more evenly spread over the different age groups and these assumptions do not hold. All child deaths were treated as infant deaths and assigned a value of 33 DALYs lost for each death [42]. This is also a con-servative choice as estimates based on deaths distributed across children from one and four years of age would have yielded a higher number of DALYs averted.
Cost-effectiveness calculations
In a final analysis, the cost per TNY (for ITNs) and per child protected (for IRS) were combined with the impact estimates to produce comparable cost-effectiveness ratios for both interventions. For calculation of impact estimates for ITNs, the number of treated net years (TNYs) delivered was adjusted for net wastage and usage among children by assuming that only 50% of delivered nets (or re-treat-ments) would be used by under five children and that only one child would sleep under each of these nets. These assumptions are examined in the sensitivity analysis.
The full set of country-specific operational and costing results is available in an unpublished report [25]; selected results only are presented here.
Results
Tanzania and Malawi were the largest programmes and also the most expensive ones, with a total economic cost of 30.5 and 15.7 million dollars for the periods under review (Table 1). All the ITN programmes were larger in terms of population protected than the two IRS pro-grammes. When the scale of the largest annual ITN deliv-ery is compared to the size of the population at risk for the particular country [43], Togo and Malawi had the highest ITN to population ratios (1:6) and (1:8), respectively, while Senegal had the lowest (1:30). According to the most recent data available for each country, Eritrea had the highest reported ITN usage rate among children under five years of age, while Senegal had the lowest. Both IRS programmes reported very high coverage rates in the tar-geted areas.
Economic costs for conventional ITNs
[image:5.612.53.557.535.711.2]Annualized economic costs per conventional ITN distrib-uted varied from USD 3.23 in Togo (or USD 2.75 if the net
Table 3: Average annual economic costs for ITN and IRS programmes.
ITN programmes Average annual cost per ITN distributed
Average annual cost per TNY
Cost per death averted** Cost per DALY averted**
Eritrea 3.98 1.21 438/1,449 13/44
Togo 3.23 3.23 1,174 36
Togo* 2.75 2.75 998 30
Malawi 3.36 3.04 1,105/1,222 33/37
Senegal 8.05 6.05 2,199/2,926 67/89
Tanzania 4.80 2.17 788/1,745 24/53
IRS programmes Cost per person protected (whole population)
Cost per under-five child protected
Cost per death averted Cost per DALY averted
KwaZulu-Natal 3.27 23.96 4,357 132
Mozambique 3.90 21.63 3,933 119
price is set to USD 3.00 instead of USD 4.33 – see meth-ods) to USD 8.05 in Senegal (Table 3). Costs per treated net year (TNY) were lower in some cases due to the inclu-sion of re-treatment of existing nets, which offered addi-tional years of full protection with low commodity costs (approximately USD 0.30. Both measures (cost per ITN and per TNY) include the cost of re-treatments. Hence, the costs per TNY delivered by conventional ITN programmes ranged from USD 1.21 in Eritrea to USD 6.05 in Senegal. It is important to note that higher costs in Senegal were driven to a large extent by higher net costs in the retail sec-tor.
There were important differences in the composition of costs for each programme. The percentage of the total cost born by the programme providers ranged widely: Togo 100%, Eritrea 83%, Malawi 69%, Tanzania and Senegal 45%. When a pure provider perspective is taken by remov-ing all costs paid directly by users of nets, the annualized costs to the provider per net distributed were fairly similar between sites (range USD 2.75–3.63; for detailed results see [25].
Additional calculations for the year during which the pro-gramme delivered the largest number of nets were not substantially different from the cost data presented in Table 3[25]. However, the programmes varied greatly in scale (200,000 to approximately three million ITNs per year) and this is likely to contribute to the observed differ-ences in unit costs.
Economic costs for IRS
In both IRS programmes cost data were only available for one or two years of operations, after the start of the pro-grammes. As a result, it was not possible to measure start-up costs. The annualized costs per person protected for IRS were USD 3.27 in KwaZulu Natal and USD 3.90 in Mozambique (Table 3). However, when only children under five years were included in the denominator for IRS (see methods section) the cost per under five child pro-tected by IRS was substantially higher: USD 23.96 per
child protected in KwaZulu Natal and USD 21.63 in Mozambique.
Sensitivity analysis: one way results
Sensitivity analysis was carried out on the main assump-tions and parameters used to calculate cost to output and cost-effectiveness ratios. Discount rate, physical lifetime of nets and costs of insecticide or re-treatment kits all had relatively small effects on the results, however, other parameters were more important, and fit into two groups: (1) those relating to net properties (cost or protective life-time) and (2) those related to net usage. For programmes involving retail net sales the attribution of commercial sales to programme activities also played an important role. All results were in the expected direction [25].
For the IRS programmes the discount rate also had rela-tively little effect on the results of the analysis, as did a change in the population growth rate. Several parameters had larger effects on the results, especially the compliance of the population with spraying. Additionally, the cost of adding or removing one of the annual spray rounds or of switching types of insecticides had large effects on the cost-effectiveness of the programmes. Longer transmis-sion seasons or shorter-lived insecticides would require additional spray rounds. The same applies if, for political or resistance reasons, a shorter-acting insecticide were used; more spray rounds imply a higher cost (and poten-tially higher refusal rates).
Sensitivity analysis: LLIN cost scenarios
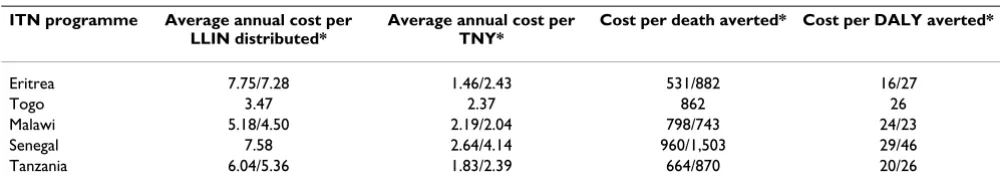
[image:6.612.54.554.608.699.2]Table 4 shows the annualized economic cost per unit delivered for long-lasting insecticidal nets (LLINs) with three years duration and a cost of USD 5.00. In most set-tings, annualized costs per net distributed were higher than for conventional nets because of the higher initial purchase price. Senegal was the exception because the commodity costs observed in the programme were much higher than in other programmes. In Togo, the costs changed little because the programme only delivered such LLINs. The annualized delivery costs ranged from USD 3.47 in Togo to USD 7.75 in Eritrea. The cost per TNY was
Table 4: Average annual economic costs for ITN (3-year LLIN) programmes.
ITN programme Average annual cost per LLIN distributed*
Average annual cost per TNY*
Cost per death averted* Cost per DALY averted*
Eritrea 7.75/7.28 1.46/2.43 531/882 16/27
Togo 3.47 2.37 862 26
Malawi 5.18/4.50 2.19/2.04 798/743 24/23
Senegal 7.58 2.64/4.14 960/1,503 29/46
Tanzania 6.04/5.36 1.83/2.39 664/870 20/26
* In paired numbers the left value includes protection from re-treatment kits while the right value results from removing both protection and commodity costs related to re-treatment kits (see main text for details).
lower than for conventional nets in most cases, ranging from USD 1.46 in Eritrea to USD 2.64 in Senegal (when re-treatments were dropped: USD 2.04 in Malawi to USD 4.14 in Senegal).
The annualized cost per delivered 5-year LLIN costing USD 7.00 generally fell compared to the three-year sce-nario, though the differences were not large (Table 5). They ranged from USD 3.23 in Togo to USD 10.08 in Eri-trea (when re-Eri-treatments are dropped: USD 3.23 in Togo to USD 9.60 in Eritrea). The cost per TNY was also lower than for conventional nets or for three-year LLINs, ranging from USD 1.38 in Eritrea to USD 1.90 in Togo (when re-treatments are dropped: USD 1.69 in Malawi to USD 3.25 in Senegal).
Cost-effectiveness of ITNs, LLINs and IRS for child mortality prevention
The results for targeted conventional nets are shown in Table 3, the cost per death averted ranged from USD 438 to USD 2,199. The cost per DALY averted was below USD 100 in all cases. Under scenarios with targeted LLINs with three-year physical and protective lifetimes (Table 4), the range of cost per death and DALY averted was lower than in conventional ITN scenarios, although when re-treat-ment benefits and commodity costs were excluded Tanza-nia and Eritrea did not show cost-effectiveness improvements. For targeted LLINs with five-year physical and protective lifetimes (Table 5), the cost per death averted in all cases showed cost-effectiveness improve-ments when compared to the three-year LLIN scenarios.
For IRS, the cost per death averted ranged from USD 3,933 in Mozambique to USD 4,357 in KwaZulu-Natal (Table 3). The cost per DALY averted ranged from USD 119 to USD 132.
LLINs, when targeted to high-risk groups in highly endemic areas appear more cost-effective than conven-tional nets and also more cost-effective than IRS delivered population-wide. Interestingly, the only circumstances in
which LLINs did not clearly improve the cost-effectiveness of treated net programmes were in Eritrea and Tanzania (Figure 1). In Eritrea the initial commodity costs for nets were substantially lower than in other settings and in both countries the numbers of re-treatments delivered com-pared to nets delivered was high.
Sensitivity analysis: usage of nets by children
A major difference between ITNs and IRS is that the latter intervention cannot be targeted to high-risk demographic groups (pregnant women and small children), since IRS has to be applied to a large proportion of all houses in a geographic area to be effective. This has implications for total cost and also cost-effectiveness, which was explored in a sensitivity analysis. In the base analysis, only one child per net was allowed and it was assumed that only 50% of nets were used to protect children. In sensitivity analysis this usage parameter had an important effect on the cost-effectiveness of every ITN programme because it altered the number of child years of protection provided without changing the costs. At lower usage levels (below 20–30%), the cost-effectiveness of net programmes (espe-cially with conventional nets) resembled that of IRS pro-grammes [25].
An important element that is not considered here for lack of reliable empirical evidence is how coverage of the inter-vention relates to its health impact. So far, few large-scale vector control programmes have been evaluated reliably with regard to health impact. However, it is well described that with ITN coverage above 50% there is a substantial community effect [44,45], while impact is reduced at lower coverage levels. Since all programmes aim at a high coverage rate (60–80%) and since all reliable impact data has been gathered under this level of coverage [37], it seemed best to consider only one set of impact values.
Discussion
Main findings [image:7.612.55.553.601.690.2]These results confirm previous work showing that vector control for malaria in sub-Saharan Africa is extremely
Table 5: Average annual economic costs for ITN (5-year LLIN) programmes.
ITN programme Average annual cost per LLIN distributed*
Average annual cost per TNY*
Cost per death averted* Cost per DALY averted*
Eritrea 10.08/9.60 1.38/1.92 502/698 15/21
Togo 3.23 1.90 692 21
Malawi 5.05/4.36 1.79/1.69 651/616 20/19
Senegal 7.36/6.96 1.67/3.25 606/1,181 18/36
Tanzania 5.74/5.06 1.62/2.28 588/828 18/25
* In paired numbers the left value includes protection from re-treatment kits while the right value results from removing both protection and commodity costs related to re-treatment kits (see main text for details).
cost-effective, as even with conservative assumptions the cost per death averted was typically below USD 1,000 for LLINs. Clearly, the move from conventional ITNs to LLINs needs to be effected as soon as possible. In this review, all major types of programmes were covered, with the excep-tion of programmes distributing free LLINs to the whole population (and not only special risk groups such as chil-dren) – as promoted recently by WHO [28]. No such pro-grammes had taken place at the time of this work and, therefore, no data could be collected on this strategy. Although the implications of such a large change in the scale of ITN activities are difficult to quantify at present, it should be possible to estimate the cost of such an approach on the basis of this data.
In all programmes under review the cost per treated net-year was surprisingly close in the LLIN scenarios, indicat-ing that programme managers do have real options. How-ever, cost-effectiveness is only one criterion for comparing strategies and decision makers must also consider other important aspects including: (1) the value of continuous
promotion (such as found in social marketing pro-grammes) versus a more intermittent approach; (2) the potential of a strategy to strengthen clinics/health facili-ties and improve uptake of antenatal care or immuniza-tion services; (3) the total cost of the strategy in relaimmuniza-tion to available resources; (4) the equity implications of each strategy; (5) which stakeholders and sectors bear the bur-den of a given strategy; (6) the opportunity cost in relation to other available health interventions.
It appears that the most cost-effective means of preventing child deaths from malaria is through successfully targeting LLINs to under-five children, while still achieving a rela-tively high coverage in the rest of the population. If nets were to only protect children little community effect would be realized as children represent less than 20% of the population in sub-Saharan Africa [45]. Under any sce-nario these findings suggest that LLINs are more cost-effective in high endemicity settings compared to IRS. In areas of year round transmission, especially those with limited physical and human infrastructure, LLINs are also Cost-effectiveness results of shifting to long-lasting insecticidal nets
Figure 1
Cost-effectiveness results of shifting to long-lasting insecticidal nets. Cost-effectiveness results of shifting to three-year (USD 5) or five-three-year (USD 7) long-lasting insecticidal nets (LLINs) relative to conventional ITN estimates. LLIN CE esti-mates do not include protection from re-treatment kits but may include some costs associated with their distribution (see main text).
Cost per death averted
0
500
1000
1500
2000
2500
Eritrea
Togo
Malawi
Senegal
Tanzania
Program
200
5
U
S
D
likely to be more feasible than IRS. By contrast, IRS is competitive with ITNs and may be the better option in areas where few spray rounds are required due to either short transmission seasons, the use of inexpensive but long lasting insecticides (such as DDT), or in epidemic prone areas and other situations where good geographic and temporal targeting is possible [46].
Economies of scale and scope need to be considered, as they may have significant effects on the unit cost per ITN by creating efficiencies within the supply chain or by improving demand through the integration of ITN deliv-ery or promotion with a wider range of desirable products or services. In this study, the effects were found to be com-plex and not clearly present in all reviewed programmes. In Malawi this effect is well documented and the cost per unit in the 5th year of operation fell to approximately 30%
of the first year [14]. To some extent, differences in scope and scale may also confound these comparisons given the large differences in the operational scale of each pro-gramme as well as relative to the context in which they operate.
Limitations in the comparability of vector control programmes
In making inter-country comparisons, uncontrollable dif-ferences in infrastructure, society, culture, and other vari-ables can induce bias. This study presents selected case studies believed to be representative of different ITN and IRS programmes and delivery approaches in sub-Saharan Africa. However, there may be significant variations in the performance and costs of implementation of these strate-gies in other settings. Also, in comparing cost information other limitations inevitably arise because of the nature and timing of large scale implementation. For example, it was not possible to compare data sets corresponding to the exact same time period, either temporally or in the his-tory of the programme, nor was it possible to completely control for differences in the scale of programmes. Simi-larly, it was not possible to control perfectly for variations in price level, although all five ITN countries fit the World Bank definition of a low-income country (GNI per capita below USD 905 in 2006). New country-specific impact data at varying levels of coverage and over the long-term
could improve the impact predictions, although ulti-mately all malaria vector control programmes will aim towards a high coverage of LLINs and hence these differ-ences might not ultimately be marked. Additionally, only the economic costs of programmes are presented here and though this can give guidance in and towards the selection of strategies, decisions must be made in each setting, in the light of both ecological and epidemiological factors as well as local health systems and resources.
Health system effects
Prevention of malaria can lead to a drastic reduction in the number of patients in health facilities, reducing pres-sure on over-stretched health facilities and thus benefit the whole health system. The provision of free or low-cost nets at health facilities (through vouchers or as a direct donation) may also be an enticement to pregnant women and mothers to use preventive services. In Malawi a por-tion of income received from the sale of highly subsidized nets is retained at the facility level and may act as an incen-tive for staff. On the other hand, comprehensive vector control programmes can burden weak health systems with new activities and lead to additional problems.
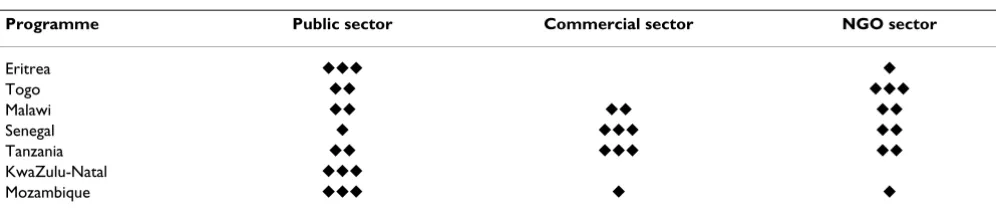
[image:9.612.56.554.624.729.2]ITN programmes with their range of strategic options and possible interactions with non-health sectors appeared more flexible in their demands on the health system than the IRS programmes examined – though some recent IRS programmes, in Bioko Island, Uganda, and Zanzibar have shown that this burden may be shifted to NGOs or com-mercial organizations [47]. In any case, vector control scale-up requires a capacity expansion in the preventive health care delivery sector. All of the ITN case studies examined here depended to some extent on public sector involvement (though levels of public input were highly variable). Table 6 attempts to summarize qualitatively the demands of the seven vector control programmes on three sectors (public, commercial, non-governmental) based on the results of interviews, document reviews and costing. In the case of the two programmes with a high commercial sector involvement (Tanzania and Senegal), reliance on this sector comes with profit incentives for the actors involved.
Table 6: Level of involvement of public, private and non-governmental (NGO) sectors in vector control programmes.
Programme Public sector Commercial sector NGO sector
Eritrea 䉬䉬䉬 䉬
Togo 䉬䉬 䉬䉬䉬
Malawi 䉬䉬 䉬䉬 䉬䉬
Senegal 䉬 䉬䉬䉬 䉬䉬
Tanzania 䉬䉬 䉬䉬䉬 䉬䉬
KwaZulu-Natal 䉬䉬䉬
IRS programmes require a high level of expertise in ento-mology and management, which might put overwhelm-ing demands to public systems in the face of the generally low availability of trained personnel in many endemic set-tings. However, a programme can also help to develop local capacity in these areas. The South African example has demonstrated the many ways in which vector control programmes can contribute not only to the reduction of disease but also to the development of local capacity and the training of technicians and scientists.
Coverage and timing
Major differences were seen in both the levels of coverage achieved in the various ITN programmes, as well as in the duration of time that was required to achieve these cover-age levels, or alternatively the time over which they were able to maintain coverage levels. The coverage levels achieved generally correlated with the price charged to users for ITNs: those programmes which delivered nets to users freely achieving the highest measured coverage lev-els and those with user charges reporting lower coverage and usage. The time to achieve increases in coverage was also generally much faster in programmes without user charges, but only one programme, Eritrea's, allowed for the examination of the long term implications of main-taining coverage with no user charges. While coverage in Eritrea has been successfully maintained for several years without user charges the overall cost per ITN was higher than in several other programmes. The free ITN pro-grammes appeared to be highly effective at achieving higher coverage more quickly than those with user charges, while maintaining lower or competitive cost-effectiveness.
"Catch-up" versus "keep-up"
Currently, there is a consensus for ITNs that both "catch-up" (to rapidly increase ITN coverage) and "keep-"catch-up" (to maintain high ITN coverage) strategies are required in each country [2,48]. Integrated vaccination/ITN cam-paigns such as those carried out in Togo (studied here), Mozambique, Niger and other settings have achieved good coverage rates (50–60%) within a short period of time [21,49]. Such campaigns can therefore be seen as serving the initial need for "catch-up" in ITN usage levels. However, there is also a strong need for "keep-up" pro-grammes to maintain high net usage levels, especially in newly pregnant women and newborns. Three of the ITN programmes reviewed tended to represent "keep-up" strategies (Malawi, Senegal, Tanzania) while one (Eritrea) mixed both. Recent work in Ghana [49,50] and on the Kenyan ITN programme [51] have highlighted the com-plementarity of both "catch up" and "keep-up" approaches in achieving high ITN coverage and impres-sive health impact. Further information and effort will be required to determine which methods can be the most
effective and cost-effective to "keep-up" coverage over time.
Financing
None of the ITN programmes appear to be independently financially sustainable. Even the largely commercial sys-tems, such as the SMARTNET programme in Tanzania or the NetMark programme in Senegal, had substantial donor input and would be unlikely to continue operating at the same scale without continuing donor funding. However, all the programmes under review appeared to be operationally feasible and sustainable in the presence of continued funding. Additionally, in terms of financing, particular attention should be paid to pure provider costs which are more reflective of the inputs of programmes, donors or health ministries because they exclude costs which are borne specifically by users. These costs were similar across the ITN programmes examined here [25].
Conclusion
These findings confirm that large-scale delivery of ITNs and IRS in sub-Saharan Africa is feasible and highly cost-effective using a range of strategies. Delivery of LLINs through campaigns provides a highly cost-effective and achievable method for rapidly improving ITN coverage. However, many other options exist for ITN programming, some well suited to maintain coverage levels after cam-paigns. IRS, or a combination of ITNs and IRS, remain attractive and viable options in some settings. Given that sustainable high-level funding appears to be available in the long-term through new global financing mechanisms, every malaria endemic country should aim to upscale their vector control programmes as rapidly and sustaina-bly as possible.
Funding
The United States Agency for International Development (USAID), the Research Triangle Institute, and the Bill and Melinda Gates Foundation provided funding for this research. These organizations played no role in the design or conduct of the study nor did they play any role in the analysis or interpretation of the results.
Competing interests
are employed by the National Malaria Control Pro-gramme of Eritrea and are involved in the implementa-tion of the Eritrean ITN programme. D. McGuire, J.M. Urrutia and F. Sakho are employed by the Academy for Educational Development and were involved in the implementation of the NetMark Senegal programme.
Authors' contributions
JY, CL, KH and FT took the lead in the design, planning and analysis of the inter-country comparisons, as well as in the writing of the manuscript. NB and J-AM were involved in the design, data collection, analysis and writ-ing up of the Tanzania case study; DC, WS and JJ were involved in the design, data collection, analysis and writ-ing up of the Malawi case study; LC and RM were involved in the design, data collection, analysis and writing up of the Mozambique case study; ME, DHM and VW were involved in the design, data collection, analysis and writ-ing up of the Togo case study; TG and MZ were involved in the design, data collection, analysis and writing up of the Eritrea case study; CG and RM were involved in the design, data collection, analysis and writing up of the South Africa case study; JMU and FS and DMcG were involved in the design, data collection, analysis and writ-ing up of the Senegal case study. All authors contributed to the writing of the manuscript and reviewed the final version before submission.
Brian Sharp passed away in April 2007. He was a key driver behind the planning and execution of this work and we would like to honour his memory by listing him as an author.
Role of funder
The funder of this study played no role in the design, anal-ysis or write-up of the study.
Acknowledgements
We would like to thanks the following persons for their support in the gen-eration of this large multi-country dataset:
Eritrea: Kate Macintyre, Paul Hutchinson
Malawi: Jeptha M'tema, Charles Yuma, Carlos Campbell.
Tanzania: Greg Foster, Romanus M'tunge, Haji Mponda, Alex Mwita, Jane E. Miller, Karen Kramer, Ally Mnzava.
Togo: Adam Wolkon, Désiré Bakusa, Kodjo Morgah, Jason Peat, Aboudou Daré, Potougnima Tchamdja.
Senegal: Martin Alilio, Mbaye Khouma, Mamadou Diop, Jules Correa, Chad Blaine, Delphine Johnson.
KwaZulu-Natal & Mozambique: Frank Tanser, Mano Konar, Musawenkosi Mubaso, Immo Kleinschmidt, Ishen Seocharan.
Additionally we would like to thank Don deSavigny, the Global Fund to fight AIDS, Tuberculosis, and Malaria, Mennonite Economic Development Asso-ciates, WorldVision, CARE, the World Bank, the Eritrea Social Marketing Group, PHARPE, UNICEF, the WHO, the US Centres for Disease Control and Prevention, the International Federation of the Red Cross and Red Crescent Societies and the National Malaria Control Programmes of all the involved countries for their assistance and willingness to share time and information.
References
1. Lengeler C, Sharp B: Indoor Residual Spraying and Insecticide-Treated Nets. In Reducing Malaria's Burden: evidence of effectiveness for decision makers Edited by: Murphy C, Ringheim K, Woldehanna S, Volmink J. Washington, D.C.: Global Health Council; 2003:17-24. 2. Roll Back Malaria Partnership: Global Strategic Plan: Roll Back Malaria
2005–2015. Geneva 2005.
3. Curtis C, Mnzava A: Treated nets vs house spraying. Bull World Health Organ 2001, 79:687.
4. Lengeler C: Comparison of malaria control interventions. Bull World Health Organ 2001, 79:77.
5. Curtis C, Maxwell C, Lemnge M, Kilama WL, Steketee RW, Hawley WA, Bergevin Y, Campbell CC, Sachs J, Teklehaimanot A, Ochola S, Guyatt H, Snow RW: Scaling-up coverage with insecticide-treated nets against malaria in Africa: who should pay? Lancet Infect Dis 2003, 3:304-307.
6. Lines J, Lengeler C, Cham K, de Savigny D, Chimumbwa J, Langi P, Carroll D, Mills A, Hanson K, Webster J, Lynch M, Addington W, Hill J, Rowland M, Worrall E, MacDonald M, Kilian A: Scaling-up and sustaining insecticide-treated net coverage. Lancet Infect Dis 2003, 3:465-466.
7. Teklehaimanot A, Sachs JD, Curtis C: Malaria control needs mass distribution of insecticidal bednets. Lancet 2007,
369:2143-2146.
8. Lengeler C, deSavigny D: Programme diversity is key to the suc-cess of insecticide-treated bednets. Lancet 2007,
370:1009-1010.
9. Curtis CF, Maxwell CA, Finch RJ, Njunwa KJ: A comparison of use of a pyrethroid either for house spraying or for bednet treat-ment against malaria vectors. Trop Med Int Health 1998,
3:619-631.
10. Goodman CA, Mnzava AE, Dlamini SS, Sharp BL, Mthembu DJ, Gumede JK: Comparison of the cost and cost-effectiveness of insecticide-treated bednets and residual house-spraying in KwaZulu-Natal, South Africa. Trop Med Int Health 2001,
6:280-295.
11. Guyatt HL, Kinnear J, Burini M, Snow RW: A comparative cost analysis of insecticide-treated nets and indoor residual spray-ing in highland Kenya. Health Policy Plan 2002, 17:144-153. 12. Goodman CA, Coleman PG, Mills AJ: Cost-effectiveness of
malaria control in sub-Saharan Africa. Lancet 1999,
354:378-385.
13. Aikins MK, Fox-Rushby J, D'Alessandro U, Langerock P, Cham K, New L, Bennett S, Greenwood B, Mills A: The Gambian National Impregnated Bednet Programme: costs, consequences and net cost-effectiveness. Soc Sci Med 1998, 46:181-191.
14. Stevens W, Wiseman V, Ortiz J, Chavasse D: The costs and effects of a nationwide insecticide-treated net programme: the case of Malawi. Malar J 2005, 4:22.
15. Mulligan JA, Yukich J, Hanson K: Costs and effects of the Tanza-nian national voucher scheme for insecticide-treated nets.
Malar J 2008, 7:32.
16. Mueller DH, Wiseman V, Bakusa D, Morgah K, Dare A, Tchamdja P:
Cost-effectiveness analysis of insecticide-treated net distri-bution as part of the Togo Integrated Child Health Cam-paign. Malar J 2008, 7:73.
17. Kolaczinski JH, Hanson K: Costing the distribution of insecti-cide-treated nets: a review of cost and cost-effectiveness studies to provide guidance on standardization of costing methodology. Malar J 2006, 5:37.
18. Webster J, Hill J, Lines J, Hanson K: Delivery systems for insecti-cide treated and untreated mosquito nets in Africa: catego-rization and outcomes achieved. Health Policy Plan 2007,
Publish with BioMed Central and every scientist can read your work free of charge
"BioMed Central will be the most significant development for disseminating the results of biomedical researc h in our lifetime."
Sir Paul Nurse, Cancer Research UK
Your research papers will be:
available free of charge to the entire biomedical community
peer reviewed and published immediately upon acceptance
cited in PubMed and archived on PubMed Central
yours — you keep the copyright
Submit your manuscript here:
http://www.biomedcentral.com/info/publishing_adv.asp
BioMedcentral 19. Macintyre K, Keating J, Okbaldt YB, Zerom M, Sosler S,
Ghe-bremeskel T, Eisele TP: Rolling out insecticide treated nets in Eritrea: examining the determinants of possession and use in malarious zones during the rainy season. Trop Med Int Health 2006, 11:824-833.
20. Nyarango PM, Gebremeskel T, Mebrahtu G, Mufunda J, Abdulmumini U, Ogbamariam A, Kosia A, Gebremichael A, Gunawardena D, Ghe-brat Y, Okbaldet Y: A steep decline of malaria morbidity and mortality trends in Eritrea between 2000 and 2004: the effect of combination of control methods. Malar J 2006, 5:33. 21. U.S. Centers for Disease Control and Prevention: Distribution of
insecticide-treated bednets during an integrated nationwide immunization campaign–Togo, West Africa, December 2004. MMWR Morb Mortal Wkly Rep 2005, 54:994-996.
22. Chavasse D, Kolwicz C, Smith B: Preventing Malaria in Malawi.
Essential Drugs Monitor 2001, 30:.
23. Academy for Educational Development: NetMark: a case study in sus-tainable malaria prevention through partnership with business 2005. 24. Magesa SM, Lengeler C, deSavigny D, Miller JE, Njau RJ, Kramer K,
Kitua A, Mwita A: Creating an "enabling environment" for tak-ing insecticide treated nets to national scale: the Tanzanian experience. Malar J 2005, 4:34.
25. Yukich J, Tediosi F, Lengeler C: Operations, costs and cost-effec-tiveness of five insecticide treated net programs (Eritrea, Malawi, Tanzania, Togo, Senegal) and two indoor residual spraying programs (KwaZulu-Natal, Mozambique). 2005 [http://www.rollbackmalaria.org/partnership/wg/wg_itn/docs/ Yukich2007.pdf].
26. U.S.Bureau of Economic Analysis: U.S. Implicit Price Defla-tors for Gross Domestic Product [http://www.bea.gov] 27. World Health Organization: Choosing interventions which
are cost effective [http://www.who.int/choice/en/]
28. World Health Organization: Insecticde-Treated Mosquito Nets: a WHO position statement. 2007.
29. Baume CA, Marin MC: Intra-household mosquito net use in Ethiopia, Ghana, Mali, Nigeria, Senegal, and Zambia: Are nets being used? Who in the household uses them? Am J Trop Med Hyg 2007, 77:963-971.
30. Conteh L, Sharp BL, Streat E, Barreto A, Konar S: The cost and cost-effectiveness of malaria vector control by residual insecticide house-spraying in southern Mozambique: a rural and urban analysis. Trop Med Int Health 2004, 9:125-132. 31. Mnzava AEP, Ntuli VM, Sharp B, Ngxongo S, Mthembu JD, le Seur D:
House spraying and replastering in KwaZulu-Natal. South Afri-can Medical Journal 1998, 88:1024-1028.
32. World Health Organization, Roll Back Malaria, United Nations Chil-dren's Fund, the Joint United Nations Programme on HIV/AIDS, Pop-ulation Services International, Management Sciences for Health: Sources and Prices of Selected Products for the Prevention, Diagnosis and Treatment of Malaria 2004.
33. Tami A, Mubyazi G, Talbert A, Mshinda H, Duchon S, Lengeler C:
Evaluation of Olyset insecticide-treated nets distributed seven years previously in Tanzania. Malar J 2004, 3:19. 34. N'Guessan R, Darriet F, Doannio JM, Chandre F, Carnevale P: Olyset
Net efficacy against pyrethroid-resistant Anopheles gambiae
and Culex quinquefasciatus after 3 years' field use in Cote d'Ivoire. Med Vet Entomol 2001, 15:97-104.
35. World Health Organization: The world health report 2006: working together for health 2006.
36. Population Division of the Department of Economic and Social Affairs of the United Nations Secretariat: World Pop-ulation Prospects: the 2004 revision [http://esa.un.org/unpp] 37. Lengeler C: Insecticide-treated bed nets and curtains for
pre-venting malaria. Cochrane Database Syst Rev 2004:CD000363. 38. Tanser FC, Pluess B, Lengeler C, Sharp B: Indoor residual spraying
for preventing malaria (protocol). Cochrane Database Syst Rev 2007.
39. Curtis CF, Mnzava AE: Comparison of house spraying and insec-ticide-treated nets for malaria control. Bull World Health Organ 2000, 78:1389-1400.
40. Breman JG, Mills A, Snow RW, Mulligan J, Lengeler C, Mendis K, Sharp B, Morel C, Marchesini P, White NJ, Steketee RW, Doumbo OK:
Conquering Malaria. In Disease Control Priorities for Developing Countries 2nd edition. Edited by: Jamison DT, Breman JG, Measham AR, Alleyne G, Claeson M, Evans DB, Jha P, Mills A, Musgrove P. New
York, NY & Washington, D.C.: Oxford University Press/World Bank; 2006:413-432.
41. Lalloo DG, Olukoya P, Olliaro P: Malaria in adolescence: burden of disease, consequences, and opportunities for intervention.
Lancet Infect Dis 2006, 6:780-793.
42. World Health Organization: Disability adjusted Life years (DALYs) [http://www.who.int/healthinfo/global_burden_disease/ en/index.html]
43. Mapping Malaria Risk in Africa [http://www.mara.org.za/] 44. Hawley WA, Phillips-Howard PA, Ter Kuile FO, Terlouw DJ, Vulule
JM, Ombok M, Nahlen BL, Gimnig JE, Kariuki SK, Kolczak MS, Hight-ower AW: Community-wide effects of permethrin-treated bed nets on child mortality and malaria morbidity in western Kenya. Am J Trop Med Hyg 2003, 68:121-127.
45. Killeen GF, Smith TA, Ferguson HM, Mshinda H, Abdulla S, Lengeler C, Kachur SP: Preventing childhood malaria in Africa by pro-tecting adults from mosquitoes with insecticide-treated nets. PLoS Med 2007, 4:e229.
46. Worrall E, Connor SJ, Thomson MC: A model to simulate the impact of timing, coverage and transmission intensity on the effectiveness of indoor residual spraying (IRS) for malaria control. Trop Med Int Health 2007, 12:75-88.
47. President's Malaria Initiative: indoor residual spraying [http:/ /www.fightingmalaria.gov/technical/irs/index.html]
48. Lengeler C, Grabowsky M, McGuire D, deSavigny D: Quick wins versus sustainability: options for the upscaling of insecticide-treated nets. Am J Trop Med Hyg 2007, 77:222-226.
49. Grabowsky M, Nobiya T, Ahun M, Donna R, Lengor M, Zimmerman D, Ladd H, Hoekstra E, Bello A, Baffoe-Wilmot A, Amofah G: Dis-tributing insecticide-treated bednets during measles vacci-nation: a low-cost means of achieving high and equitable coverage. Bull World Health Organ 2005, 83:195-201.
50. Grabowsky M, Nobiya T, Selanikio J: Sustained high coverage of insecticide-treated bednets through combined Catch-up and Keep-up strategies. Trop Med Int Health 2007, 12:815-822. 51. Noor AM, Amin AA, Akhwale WS, Snow RW: Increasing coverage