R E S E A R C H A R T I C L E
Open Access
An optimization framework for measuring
spatial access over healthcare networks
Zihao Li
1, Nicoleta Serban
1and Julie L. Swann
1,2*Abstract
Background:Measurement of healthcare spatial access over a network involves accounting for demand, supply,
and network structure. Popular approaches are based on floating catchment areas; however the methods can overestimate demand over the network and fail to capture cascading effects across the system.
Methods:Optimization is presented as a framework to measure spatial access. Questions related to when and why
optimization should be used are addressed. The accuracy of the optimization models compared to the two-step floating catchment area method and its variations is analytically demonstrated, and a case study of specialty care for Cystic Fibrosis over the continental United States is used to compare these approaches.
Results:The optimization models capture a patient’s experience rather than their opportunities and avoid overestimating patient demand. They can also capture system effects due to change based on congestion. Furthermore, the optimization models provide more elements of access than traditional catchment methods. Conclusions:Optimization models can incorporate user choice and other variations, and they can be useful towards targeting interventions to improve access. They can be easily adapted to measure access for different types of patients, over different provider types, or with capacity constraints in the network. Moreover, optimization models allow differences in access in rural and urban areas.
Keywords:Optimization, Health access, Measurement of access, Intervention
Background
Access to healthcare is widely recognized as essential for ensuring not only care of immediate health needs but also to enable health and wellness in the population. Access has multiple dimensions including accessibility, availability, affordability, accommodation, and accept-ability [1–3] and is of great importance to decision makers in public health. In this paper, we focus on measurement models for spatial access over a health network with patients and providers, which is most closely related to the elements ofaccessibility(e.g., loca-tion and travel distance for care) and availability (e.g., coverage or the volume of providers). A healthcare net-work is defined as a transportation netnet-work with pa-tients as demand nodes and providers as supply nodes,
and an arc between patient and provider if the provider is accessible for the patient.
The measurement models studied in this paper are designed to measure potential access based on the services that are available for use relative to population and distance. On the contrary,realizedaccess reflects actual use of services, which can be affected by finances, behaviors, and other factors. Potential access is measurable although it is not observable.
An optimization-based approach is described in this paper for quantifying potential access over the health-care network and for estimating the impact of changes to the network. Optimization is a mathematical science that is widely accepted in engineering and science as providing a way to balance complex interactions across a system, and there is a history of using optimization to assist medical decision making [4–6]. In this paper, the-oretical and practical optimization modeling techniques are used to assist with health care policy development by measuring access and computing the economics behind discrepancy of access. Specifically, questions such as how
* Correspondence:[email protected] 1
H. Milton Stewart School of Industrial and Systems Engineering, Georgia Institute of Technology, Atlanta, USA
2
School of Public Policy by courtesy, Georgia Institute of Technology, Atlanta, USA
optimization models can be used to measure access, on what types of networks they offer the most accurate esti-mates of access, and ultimately, why they should be used for measuring and for suggesting interventions to improve access are addressed in this paper. The answers to these questions are useful for improving the health of popula-tions and assisting with health policy development by informing areas of greatest need.
The optimization models are compared to some exist-ing methods. In particular, comparisons are made to var-iations of the two-step floating catchment area (2SFCA) method [7], including the Enhanced 2SFCA (E2SFCA) method [8] and the Modified 2SFCA (MSFCA) method [9], with some discussion of other catchment methods. The catchment methods, which are offsprings of a grav-ity model of attractions between populations and pro-viders, estimate the size of population served at each provider using distance zones and compute accessibility of a community based on the availability of providers in the community’s zones; communities can be cap-tured in the zones of multiple providers. In contrast, optimization models match patients and providers based on both distances and the relatively crowdedness of each provider, and estimate the accessibility of a pa-tient using the matching results to determine the travel distance and the corresponding crowdedness of each patient. Optimization models can take on the perspec-tive of a centralized planner in making assignments, or they can be adapted to directly incorporate patient choice over the network.
To compare the measurement models for spatial ac-cess, several specific network structures are examined, which are designed so that access measures can be compared analytically. Results on a large case study of specialty care of Cystic Fibrosis (CF), where the network has varying levels of accessibility are also provided.
Analytically, this paper demonstrates that the total number of patient visits captured by all facilities in the 2SFCA methods is larger than the number of visits expected based on population size. The three-step floating catchment area (3SFCA) method [10] adds an assignment mechanism to address the competition by facilities, but the assignments are only based on distance. In contrast, in the optimization models, the willingness to travel is not only a function of distance but also of facility congestion including its size. As a result, the optimization models can capture cascading effects in the system, where a change in congestion for one population leads to different decisions and thus impacts individuals in another location. The optimization models also allow for simultaneous esti-mation of measures of access across the five dimen-sions outlined [1].
More generally, optimization models can be adapted to many contexts including different patient types (e.g., Medicaid or not), provider constraints, or others. They are also useful in optimizing interventions, where the intervention can target different aspects of access (e.g., distance versus congestion).
Methods
Optimization framework
In healthcare decision making and service research areas, optimization models have been used to determine the best location for a new clinic [11–13], ensure that resource locations are sufficient to cover the need across a network [14], route nurses for home health services [15], improve health outcomes among communities [16, 17], and evaluate policies for pandemic influenza, breast cancer, and HIV over a network [18–20], among others. Wang [21] reviewed several cases where optimization models could be used to improve access or service over a network.
In our models, the cost of an individual is associ-ated with two dimensions of access [1]: accessibility and availability. The first is measured with travel dis-tance (or time). The second is measured with conges-tion, which for an individual is associated with the relative number of people (or visits) at a provider compared to the resources available. One can also think of this as capturing the waiting time until an appointment is available. Studies show that individuals are willing to drive further to receive an appointment more quickly [22]. Thus we assume that the utility (or disutility) associated with a patient’s access is a weighted sum of the distance and a congestion term, where we scale the congestion term to trade-off the relative importance between the two. We expect that the congestion weight (α) may be different for differ-ent types of healthcare services, such as primary care or specialty care (i.e., distance may have a relatively lower cost). The congestion weight can also represent the resources available at a facility.
Several elements are defined for our formulation. The total number of patients isnand the total number of fa-cilities ism. Leti= 1,…, nbe the indices of patients and
j= 1,…, m be the indices of facilities. The distance be-tween patient i and provider j is dij; vi is the estimated
number of visits that patient i= 1,…, n will make (demand);and αj is the congestion weight at provider j.
A dummy location can be introduced for the assignment of demand that cannot be met.
The decision variables are xij, which is the percentage
of time assigned to facilityjfrom patient or community
i, for eachi= 1,…,nandj= 1,…,m.
Objective function:
minXn
i¼1
Xm
j¼1dijxijviþ
Xm j¼1αj
Xn i¼1xijvi
2
ð1Þ
Constraints:
Xm
j¼1xijvi¼vi;∀i¼1;…;n ðassignment constraintÞ ð2Þ
0≤xij≤1;∀i¼1;…;nand∀j¼1;…;m: ð3Þ
The objective function (1) states that the total number of visits assigned should be vi for each patient or
com-munity i. Constraint (2) requires that all individuals be assigned, and equation (3) requires non-negativity of the decision variables. Each individual’s congestion at a visit is proportional to the total number of visits at that facil-ity scaled by αj. The congestion term in the objective
sums over the congestion experienced by all patients resulting in an overall term that is squared. The choice of quadratic function comes from the following idea: ifn
patients receive care from a provider location, then each patient experiencesn units of congestion, then the total congestion is n×n = n2 (similar to total latency in net-work congestion net-work [23]). Note that when α= 0, this model gives equivalent results to assignment by shortest distance, and whenα=∞, this model gives equivalent re-sults to equally distributing patient visits to each facility. See Additional file 1 section 1 for a process to select the congestion weight.
For a patient, the number of visits to a close location is expected to be more than the number of visits to a far location because of the willingness to travel. Thus, the number of visits to each location using a function that decays with distance is determined. This is analogous to step 1 in the E2SFCA method where the population is multiplied by a weight. This also implies that the num-ber of visits covered in the network may be less than 100 %.
From the results of an optimization model, several measures of spatial access are calculated. The measures include i) the distance traveled for each patient or com-munity; ii) the congestion experienced by each patient or community; iii) the coverage, which is defined as the ratio of visits assigned to visits needed for an individual or community.
Variations on the optimization model
With optimization models, many variations are possible, including through the addition of constraints, the use of different objective function values, or by differentiating decision variables by type. Here we describe a major variation in our model, optimization with user choice (“Decentralized”), and include many others such as
capacity, unmet demand, and willingness to travel in Additional file 1 section 2.
The traditional deterministic optimization model (as presented above) often assumes a centralized planner who makes decisions for every patient in a healthcare network to achieve the best overall objective. However, user choice can be incorporated by an equilibrium con-straint that represents individual choices as in game the-ory [24]; we call the resulting optimization model
decentralized.
An overall equilibrium solution requires a user choice constraint to be satisfied for each patient visit in the net-work, where the constraint states that the individual cannot improve their distance and congestion of that visit by switching to another facility given the other deci-sions on the network.
The decision variable and equilibrium constraint are defined below:
xijk= decision variable is 1 if patientichooses facilityj
for visitk, or 0 otherwise;
dijþαj
Xn p¼1
Xvp
k¼1xpjk≤diq
þαq
Xn p¼1
Xvp
k¼1xpqkþ1
;∀q≠j;∀i;∀k
ð4Þ
The equilibrium condition includes a separate con-straint for each patient’s visit and each location when there is no distance decay function. The left-hand side is the distance and congestion associated with current fa-cility choicejfor a visitk, and the right-hand side is the distance and congestion at any location other thanj. See Additional file 1 section 3 for more details.
Review of catchment models
Gravity models use the following general form to calcu-late an“attraction”measure for each patienti:
AGi ¼Xm
j¼1
Sjw dij
Xk
i¼1Piw dij
; ð5Þ
where Sj is the supply at provider j, Pi is the
popula-tion at locapopula-tion i, w(dij) is the decay function based on
distance of each patient-provider pair (i,j).
The original 2SFCA method was introduced by Luo and Wang [7]; it allows the catchment of each provider and patient to float based on the distances between each pair. E2SFCA is a variation that suggests applying differ-ent weights within travel time zones to account for decaying of the willingness to travel as distance increases [8]. Under the E2SFCA model, in the first step the
visits by replicating each patient using visits demanded (e.g., a patient demanding 10 visits can be viewed as 10 patients) [25, 26]. We make a minor adjustment to allow for each patient to have multiple visits to a provider, so we use physician-to-visits ratio instead. Thus we obtain:
Rj¼
Sj
X
r
X
i∈fdij<DrgViWr
; ð6Þ
where Sjis the number of physicians available at
pro-vider j, Wr is the weight value corresponding to the
catchment zone of dij. The value of Wr is calculated
using the distance decay function, which is usually non-linear.Dris the distance threshold of catchment zone r.
The parameter Vi is the number of potential visits if
there is no decay in willingness to travel or the maximal demand for patient or community i. The original E2SFCA method introduced the model with three catch-ment zones, but an extension is to allow a different number of zones or even a continuous decay (“ imped-ance”) function across a single zone. Example choices of impedance functions include Gaussian [7, 27], exponen-tial, inverse power, and others; [27] discusses parameter setting for the impedance function. In the second step of E2SFCA, the method defines the accessibility of each patient or communityi based on the ratios at each pro-vider and the zone weights:
Ai¼
X
r
X
j∈fdij<DrgRjWr: ð7Þ
Another catchment approach is the 3SFCA method, which incorporates competitions among multiple pro-viders within the same catchment zone of a patient and makes assignments of patients by distance. The M2SFCA method [9] modifies the patient level accessibility in [7] by multiplying the distance weight twice, while another ap-proach [28] allows for zones to differ by transportation modes.
For a simple system, the individual measures of spatial access from optimization models can be combined to directly compare with the accessibility measures of 2SFCA methods (E2SFCA and M2SFCA). The simplest supply network consists of n communities in a circular population area with a facility at the center. Letdibe the
distance from community i to the facility and S the number of physicians in the facility. Calculate the facility population-to-physician ratio R and patient accessibili-tyAi using [6] and [7]. Define a decay function w(di) ∈
[0,1]. For this system, the optimization method is equivalent to assigning by shortest distance. LetFdenote the congestion at the facility, then F¼1
R. The coverage of communityiis calculated as w(di). Therefore, for this
system, the patient accessibility is AEi ¼congestioncoverage, for the
E2SFCA method. For the M2SFCA method, a similar calculation can be made, where the composite patient accessibility measure isAMi ¼congestioncoverage2.
Human subject study approval
The Institutional Review Board of the Georgia Institute of Technology approved the overall research project using data from the Cystic Fibrosis Foundation, and the Cystic Fibrosis Foundation also approved the study to use registry data previously collected from patients with their signed consent. The submitted article uses the existing locations of Cystic Fibrosis care centers, the dis-tances traveled by patients to CF centers for care, and simulated patient locations with corresponding distances to CF centers. Simulated locations of patients are ran-domly generated according to the prevalence of CF and the composition of populations at the county level.
Results
Analytical comparisons
In this section, analytical results on accessibility as mea-sured by the optimization method and catchment models are provided. Most analyses in this section focus on simple systems where service areas are non-overlapping. For simple networks with overlapping service areas, the detailed analysis can be found in Additional file 1 section 4. Notations that will be used frequently in the analysis are defined below. The dis-tance decay functionw(dij) is between 0 and 1. Ifdijis
the distance between communityiand facility j, andvi
is the visits needed by community i, then we assume that facility jreceives w(dij)vi visits from community i
as in the catchment models. In optimization models, letPij be the proportion of the population in
commu-nityithat visits facilityj.
Result 1 (Opportunities vs. Experiences): optimization
models capture a patient’s experience rather than their
opportunities. As a result, 2SFCA methods tend to overestimate the total number of visits
For many catchment models, the estimated accessibility measure increases when more facility choices are available to a population. However, assignments models (including optimization and the 3SFCA method), are es-timating the cost of potential access, and this does not increase if a new choice is congested or inconsequential. This is illustrated with a simulated system of populations and facilities, as in Delamater (2013) [9] .
Consider System 1 as described in Fig. 1. When facility
than in the first system, with the distances betweenA - X
andB - Y retained and b closer toYthanA. The 2SFCA methods show that the accessibility ofYincreases due to the possibility of service atA, while the accessibility ofX
decreases because of demand on facility Afrom popula-tionY. However, the optimization method shows there is no change in accessibility for reasonable congestion weights. From the perspective of a person atY, service at facility A would be associated with a higher congestion cost and a further distance, thus he would neither be assigned to facilityAnor choose that facility. This is still the cost associated withpotentialaccess rather than real-ized access, but the cost is associated with the potential
experience of a patient. In contrast, the 2SFCA methods always realize additional choices regardless of their relative competitiveness to existing choices. Therefore the total number of visits implied by the 2SFCA methods is higher compared to the optimization method, and can be higher than the total number of visits demanded.
Result 2 (System Effects): the 2SFCA methods do not capture the cascading effects based on congestion
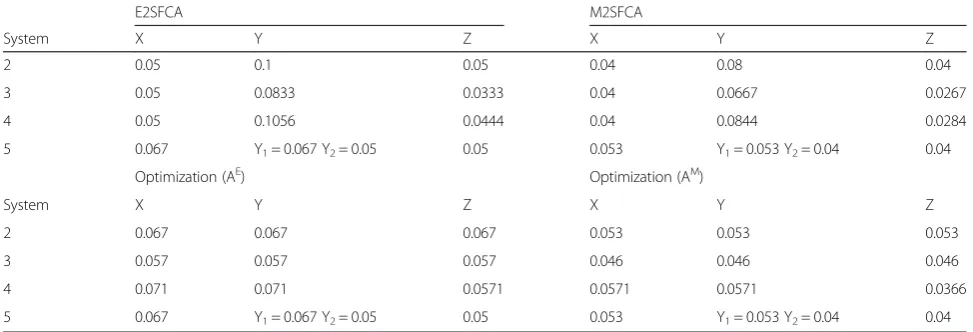
For methods focused primarily on catchment zones without assignment, there are some system effects that may not be captured over the network. In Fig. 2, we define several systems to illustrate this point. Define Sys-tem 2, with population z added to system 1, and with a population of 100 for each ofX,Y, andZ. In this system, the optimization method and the 3SFCA both compute the same accessibility for each population, while in the 2SFCA methods the accessibility is higher forYsince it is capturing opportunities for access rather than the patient experience.
Consider System 3 with increased population at loca-tion Z. In the catchment models, as the population ofZ
increases, the accessibility for Yand Z decrease, while the accessibility for X remains the same no matter how largeZ is. In the optimization method, as Z gets larger, more of the population from Ygoes to facility A, so the accessibility at all population locations decreases. The Fig. 1System 1, with populations 100 at locationXand 1 atY. Facilities (a) and (b) each have 10 beds
[image:5.595.62.540.89.165.2] [image:5.595.59.538.454.701.2]accessibility at each location is the same because the sys-tem is constructed in a very specific and symmetric way.
A similar effect can be seen when System 2 is varied by moving population Z further away from the center (System 4). In this case, more patients from Yswitch to B to reduce congestion, resulting in better access for population X in the optimization method, while the 2SFCA methods show no change forX.
Define System 5 the same as 1 but with an unbreak-able barrier separating populationYin half, and a popu-lation ofZequal to 150. The 3SFCA quantifies the same access with and without the barrier, because the assign-ment is based on distance alone. On the other hand, the optimization method shows different access in System 5 compared to 3, because assignment is based on both dis-tance and congestion. The accessibility estimates for the different systems are summarized in Table 1.
Result 3 (Composite Measures vs. Individual Measures): the composite measures of the 2SFCA methods are insufficient to distinguish multiple elements of access
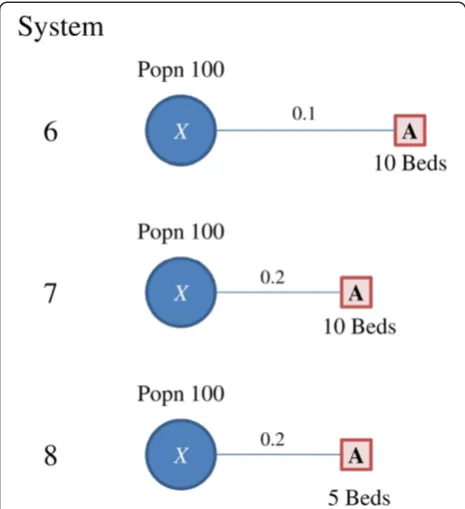
Consider systems 6 ~ 8 in Fig. 3. System 6 has 100 people in X and 10 beds in A, and the distance weight betweenX and Ais 0.1. System 7 is similar to system 6 but with a distance weight 0.2 (which implies the popu-lation is closer to the facility). System 8 is similar to sys-tem 7 but has 5 beds in A.As we move from system 6 to system 7 and then to system 8, either the population
is closer to the facility, the facility has fewer beds, or both, so the network is getting more congested and the accessibility ofX should reflect this change. However, as Delamater [9] points out, the E2SFCA method shows the same accessibility for populations in system 6 and 7. Similarly, the M2SFCA method shows the same accessi-bility for populations in system 6 and 8.
The individual measures in the optimization method indicate the coverage increases as you move to system 8 but that the congestion also increases (see Table 2).
Case study
The analytical analysis above illustrates several direct comparisons between the 2SFCA methods and the optimization method. In this section access is estimated for the specific health service network associated with Cystic Fibrosis (CF), which is a chronic condition that requires specialty care. Recent studies have shown that Medicaid status is related to survival rate and outcomes [29], but spatial access may also be a factor. The condi-tion has prevalence in the United States of about 30,000 patients with 208 CF care centers in the continental US [30]. Though it is a rare disease, the service network displays heterogeneity, with the spatial access varying greatly over the network.
Focusing on potential spatial access, locations of CF patients are simulated according to the incidence of the disease rather than using existing locations of actual pa-tients (which may be biased by service locations). With CF, the population eligible for Medicaid is considered separately, since they may need to receive service in their home state. 30,000 virtual patients are generated with CF located in county centroids in the continental US, where the prevalence was generated proportionally to the populations in each race/ethnicity who are above or below 2 times the federal poverty level [31], using the incidence matrix for race/ethnicity in Additional file 1 section 5 (see Additional file 5 for raw population data). Patient demand is defined as 10 visits per year to a cen-ter (this captures more than 90 % of the patients with location information available in the CF Foundation Registry data) [30]. We assume the actual number of visits is decreasing with the distance to selected service facility, patients will not visit facilities more than 150 miles away (again, this captures more than 90 % of the patients in the registry with location information) [30], and low-income patients will only visit a CF center within the patient’s state due to restrictions of the Medicaid program.
The zip code of each CF center (see Additional file 6) is obtained using patient encounter data from the CF Foundation [30], and the road distance from each CF virtual patient to each CF center is computed using Radical Tools [32] . We assume all facilities are the same Fig. 3Systems 6 ~ 8, with population of 100 at locationX, and a
[image:6.595.57.290.89.344.2]size (e.g., can serve 1500 visits a year); the exact number can be changed and the relative comparisons between methods will hold.
Accessibility measures were calculated for E2FSCA, M2SFCA, and the decentralized (with user choice) optimization model. The optimization model was imple-mented using C++ and the CPLEX solver on a UNIX system (see Additional file 2). The decay functions are such that 10 visits will be made when distance is zero, and visits approach zero when distance is 150 miles; see specific functions in section 7 in Additional file 1: Table S4. There are many functions that can be used to model the decaying willingness of travel. We have chosen to use the exponential function for the rare disease setting of Cystic Fibrosis. Because CF is rare and access to care is relatively low compared to primary care, patients are willing to travel longer distances than for some conditions. The parameter used in the case study was calibrated to be in line with realized utilization derived from the CF regis-try data (see section 7 in Additional file 1: Figure S12). For the optimization model, a congestion weight of 10 is used unless otherwise specified (see Additional file 1 section 1). For the 2SFCA methods, Medicaid patients were only in-cluded in catchment areas of facilities in their own states.
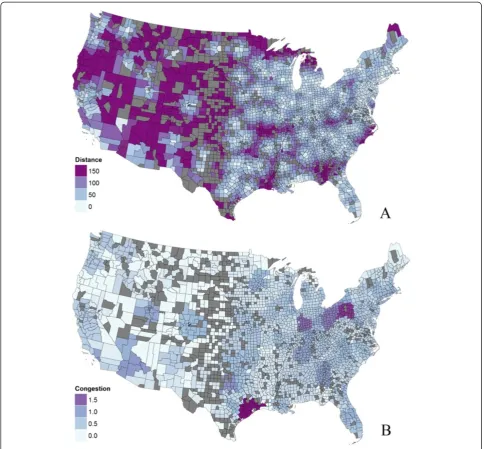
Maps of the decentralized optimization model display the distance traveled and the congestion experienced by each person, averaged at the county level, in Fig. 4(a) and 4(b). In general, distance is small close to centers, especially in areas with multiple centers such as the coastal northeast. There are a few pockets with higher distance, especially in parts of the West. Congestion is
higher in a few areas, such as around Houston and some parts of Ohio and Pennsylvania. Some counties have no simulated patients, while others have uncovered de-mand, such as in many counties in the Midwest or Western regions. There are also isolated areas that are uncovered, such as near southwest Georgia, southern Missouri, and some counties at the boundary of the US. A summary histogram is provided for distance, conges-tion and coverage for each county in Addiconges-tional file 1 section 6. The distribution of coverage shows that many needed visits are not met, due to the distance patients need to travel to CF centers.
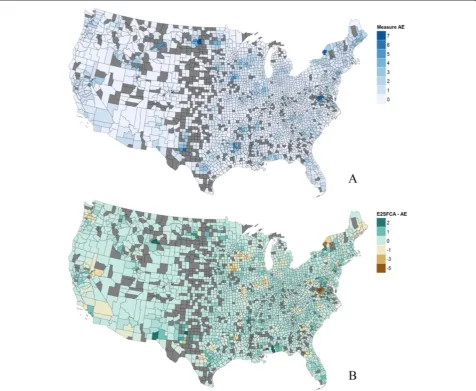
The composite measureAEgenerated from the decen-tralized optimization model is shown in Fig. 5(a). The main areas with high accessibility are near CF centers and around urban areas. There are pockets of low accessi-bility in many places; however, these can occur for differ-ent reasons. In Pittsburg, Pennsylvania, and Columbus, Ohio, Fig. 5(a) shows that the congestion was high, while in Springfield, Missouri, Fig. 5(a) shows that the travel dis-tance is high. Pockets of low accessibility in New York arise from a combination of longer distances and higher congestion.
[image:7.595.55.542.101.267.2]Figure 5(b) shows the difference between the decentra-lized optimization model composite measureAEand the result from the E2SFCA method using the same scale. In comparison to the optimization approach, the E2SFCA method tends to show higher accessibility in areas with many centers (e.g., near Los Angeles and around New York). It also shows higher accessibility in many areas that lie in overlapping service areas for centers (e.g., northern South Carolina, eastern Arkansas, and New Mexico). A pairwise t-test (1-tail) shows that for coun-ties with more than 50 CF patients (127“large”counties) or less than 5 CF patients (1289 “small” counties), the measure from the E2SFCA method is significantly higher than measures from the optimization method (respect-ively, with p-values 0.20 × 10⁻⁶ and 2.00 × 10⁻²); for
Table 2Accessibility estimates for systems 6 ~ 8
System E2SFCA M2SFCA Opt coverage Opt congestion
6 0.1 0.01 0.1 1
7 0.1 0.04 0.2 2
8 0.05 0.01 0.2 4
Table 1Accessibility estimates for systems 2 ~ 5
E2SFCA M2SFCA
System X Y Z X Y Z
2 0.05 0.1 0.05 0.04 0.08 0.04
3 0.05 0.0833 0.0333 0.04 0.0667 0.0267
4 0.05 0.1056 0.0444 0.04 0.0844 0.0284
5 0.067 Y1= 0.067 Y2= 0.05 0.05 0.053 Y1= 0.053 Y2= 0.04 0.04
Optimization (AE) Optimization (AM)
System X Y Z X Y Z
2 0.067 0.067 0.067 0.053 0.053 0.053
3 0.057 0.057 0.057 0.046 0.046 0.046
4 0.071 0.071 0.0571 0.0571 0.0571 0.0366
[image:7.595.55.291.677.733.2]counties of other sizes (“medium” counties), the test is inconclusive. The F-test shows that for all groups of counties, the variance of the E2SFCA measure is higher (with p-value 1.88 × 10⁻⁴ for small counties, value less than 10−6for medium counties, and 3.90 × 10⁻²for large counties. The Mann–Whitney-Wilcoxon test shows that the E2SFCA measure is greater in median than the optimization composite measure withp-values less than 10−6for small and medium counties, and 2.02 × 10⁻²for large counties. The finding is consistent with the analyt-ical results in Additional file 1 section 4 showing that with overlapping catchment areas, E2SFCA quantifies higher access when distances are relatively small. The comparison between the composite measureAMand the
M2SFCA method is similar but the magnitude of differ-ences is smaller.
The number of visits captured in the E2SFCA method is shown in Fig. 6 in comparison to the visits needed by the population. It is highest around facilities, and espe-cially with multiple facilities such as around New York. For the optimization model, the realized visits per facil-ity are estimated to be 0 to 3000. In contrast, the range for the E2SFCA result is 0 to 10,540 per facility. This is consistent with the analytical result that the number of visits is higher in the E2SFCA approach. The F test indi-cates that the variance of the facility congestion is significantly higher for the E2SFCA approach, with a
[image:8.595.56.541.88.537.2]result that the optimization model always has a lower facility congestion.
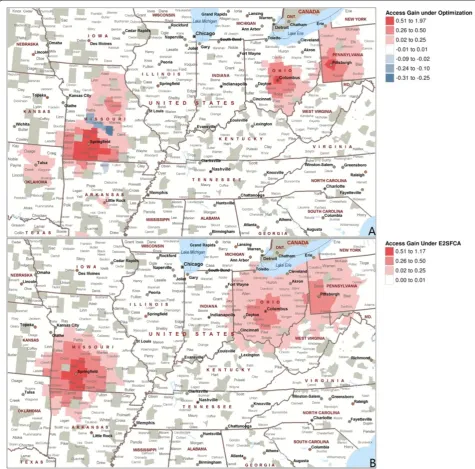
The results showing access over the network indicate a number of areas that have uncovered populations, high congestion, and/or high travel distances. Figure 7 shows the results in several local areas after network interven-tions. One new facility was added to the network in lo-cations with uncovered populations (Springfield, MO), and the capacity of existing facilities was doubled in two locations (Columbus, OH; and Pittsburgh, PA). For the E2SFCA method, the gain in access is centered over the interventions and decays with distance within 150 miles. The gain is positive in all areas with change, as the new facilities increase the opportunities available or have no impact. Under the optimization method, the coverage in an area increases when a new facility is added, and con-gestion in an area decreases when new capacity is added. Although the total access increases, some populations
show a worse composite measure, which indicates that they are traveling shorter distances but experiencing higher congestion (or the reverse) based on new network dynamics. Note also that when the new location is added in Springfield, there are cascading effects under the optimization approach, and access increases for the population around Jefferson City, since their congestion is decreasing due to the new facility. We performed a pairwiseT-test comparing the impact of intervention on both measures for each of the 479 counties that had a change under the intervention. The test shows that the E2SFCA measure estimates a greater improvement from the intervention compared to the optimization measure, which is consistent with our discussion above.
Discussion and conclusions
[image:9.595.60.537.90.481.2]interventions. They can be applied across heterogeneous networks with both dense and sparse areas, and they allow user choice to balance travel and congestion within communities. The approach presented includes a way to select the specific parameters of a model. Optimization models also provide both a picture of the status quo and an approach for evaluating a potential change to a network. Fundamentally, the optimization models have a different framework than many catch-ment methods, since they estimate the access costs asso-ciated with a patient’s experience (albeit the potential
experience rather than actual utilization).
Under optimization models, the presence of additional opportunities only provides gains in potential access when they provide better access compared to existing opportunities, while in the 2SFCA methods, additional opportunities always provides gains in potential access. This difference shows that many 2SFCA methods over count visits when there are facilities with overlapping catchment zones. This effect is stronger in areas with the greatest infrastructure of health services, so inter-preting accessibility over a network with sparse and dense areas may not be reasonable. One could adapt the approach by dividing the population by the number of facilities in the zone, or use other adaptations as in the
assignment mechanism of the 3SFCA approach. How-ever, these adaptations do not address other issues, such as the cascading effects across the system. The catch-ment methods tend to capture effects in a defined area, but they do not capture the interactions between areas (or the cascading effects over a network if there are changes introduced) as well as assignment models do. This also means catchment methods may misestimate availability across a network for complicated networks.
[image:10.595.59.540.87.391.2]of access like spatial accessibility to consider the other dimensions of access [1].
This study focus on estimating potential health access using optimization models. There are limitations with the approach. The optimization models assume that patients are trading off travel distance and congestion rationally across a network, while in reality there might be many other factors considered by patients. In addition, the optimization models are built using deter-ministic known data. In the case study, the possibility of using satellite clinics or services provided through
telemedicine are not considered. Results are also dependent on the specific decay function and parameter chosen [27]. Furthermore, the case study also assumes that the transportation modes used by all patients are the same.
[image:11.595.58.534.90.559.2]paper are provided for use without a license in Additional file 4 (see Additional file 3 for the software package). It may be most important to use optimization models when a network has facilities with overlapping zones, when one wants to capture the nuances of access across populations, or when one needs to develop interventions to improve access. We hope that the use of optimization models will provoke more discussion in how to measure access, and ultimately how to improve access, especially in light of the increase in computing power and big data that will be coming online in the US health system.
Availability of supporting data
The data sets supporting the results of this article are included within the article and its additional files (see Additional file 6).
Additional files
Additional file 1:Appendix file that provides detailed supplementary arguments and analysis of the methods and data in the article.The file also contains a histogram of distances traveled by CF patients compared to estimated distances by the model.
Additional file 2:Computer codes used to implement the optimization method in this article.
Additional file 3:The free AMPL package that researchers can use to implement optimization models to measure access described in this article.We provide example codes and instructions to use the AMPL package for researchers who want to implement optimization models to measure access.
Additional file 4:Contains example codes and instructions to implement optimization models in AMPL and to utilize the free online NEOS solver to solve the optimization models.
Additional file 5:Contains population information to calculate the incidence rate by race/ethnicity who are above or below 2 times the federal poverty level.
Additional file 6:Provides Cystic Fibrosis care center locations and simulated patient locations and demands that this article used to carry out the case study.
Abbreviations
2SFCA:Two-step floating catchment area; E2SFCA: Enhanced two-step floating catchment area; M2SFCA: Modified two-step floating catchment area; CF: Cystic fibrosis.
Competing interests
The authors declare that they have no competing interests.
Authors’contributions
ZL participated in the design of the study, implemented the computational model and data analysis, and drafted the manuscript. NS and JLS carried out the study design and coordination and participated in data analysis. All authors contributed to interpretation of findings, preparing the manuscript, read and approved the final manuscript.
Authors’information
Zihao Li is an Operations Research Ph.D. student in the School of Industrial and System Engineering (ISyE) at Georgia Institute of Technology (GT). Dr. Nicoleta Serban is the Coca-Cola Associate Professor in the School of ISyE at GT. She received her B.S. in Mathematics and an M.S. in Theoretical Statistics and Stochastic Processes from the University of Bucharest. She went on to earn her Ph.D. in Statistics at Carnegie Mellon University. In 2010, she was granted the NSF CAREER award for research in service equity and access. Her research
record is quite diverse, from mathematical statistics to modeling to data analysis to qualitative insights on causality and complexity. Dr. Serban’s research interests on Health Analytics span various dimensions including large-scale data representation with a focus on processing patient-level health information into data features dictated by various considerations, such as data-generation process and data sparsity; machine learning and statistical modeling to acquire knowledge from a compilation of health-related datasets with a focus on geographic and temporal variations; and integration of statistical estimates into informed decision making in healthcare delivery and into managing the complexity of the healthcare system.
Dr. Julie Swann is the Harold R. and Mary Anne Nash Professor in the School of ISyE at GT. She is also a co-founder and co-director of the Health and Humanitarian Systems Center at GT. She received her B.S. in
Industrial Engineering from GT in 1996 and her Ph.D. in Industrial Engineering and Management Sciences from Northwestern in 2001. In 2009–2010 she was on loan to the Centers for Disease Control and Prevention (CDC) as a Senior Science Advisor for the H1N1 pandemic response to advise and evaluate the logistics of vaccine and medical countermeasures distribution to protect the American public. Her research specializes in supply chain management (especially humanitarian networks) and health systems. Her research methods have focused on integrating optimization models with economic concepts related to decentralized agents and on collaborating with other disciplines to solve problems in health policy. Dr. Swann was awarded the NSF career award in 2004 and 2014.
Acknowledgments
The authors thank Michael S. Schechter for providing knowledge of the current health network of the disease and the Cystic Fibrosis Foundation for providing the location of care centers. The study was supported by the National Science Foundation Grant CMMI-0954283 and a seed grant awarded by the Healthcare System Institute and Children’s Healthcare of Atlanta. Dr. Swann was also supported by the Harold R. and Mary Anne Nash Junior Faculty Endowment Fund.
Received: 21 August 2014 Accepted: 10 June 2015
References
1. Penchansky R, Thomas JW. The concept of access: definition and relationship to consumer satisfaction. Med Care. 1981;19(2):127–40. 2. Khan AA. An integrated approach to measuring potential spatial access to
healthcare services. Socio Econ Plan Sci. 1992;26(4):275–87.
3. Khan AA, Bhardwaj SM. Access to healthcare - a conceptual framework and its relevance to healthcare planning. Eval Health Prof. 1994;17(1):60–76. 4. Beck JR. Optimized resource-allocation in medicine using network flows.
Med Decis Mak. 1984;4(4):532.
5. da Silva MEM, Santos ER, Borenstein D. Implementing regulation policy in Brazilian Health Care Regulation Centers. Med Decis Mak. 2010;30(3):366–79. 6. Parkan C, Hollands L. The use of efficiency linear programs for sensitivity
analysis in medical decision-making. Med Decis Mak. 1990;10(2):116–25. 7. Luo W, Wang FH. Measures of spatial accessibility to health care in a GIS
environment: synthesis and a case study in the Chicago region. Environ Plann B-Plann Des. 2003;30(6):865–84.
8. Luo W, Qi Y. An enhanced two-step floating catchment area (E2SFCA) method for measuring spatial accessibility to primary care physicians. Health Place. 2009;15(4):1100–7.
9. Delamater PL. Spatial accessibility in suboptimally configured health care systems: A modified two-step floating catchment area (M2SFCA) metric. Health Place. 2013;24:30–43.
10. Wan N, Zou B, Sternberg T. A three-step floating catchment area method for analyzing spatial access to health services. Int J Geogr Inf Sci. 2012;26(6):1073–89.
11. Griffin PM, Scherrer CR, Swann JL. Optimization of community health center locations and service offerings with statistical need estimation. IIE Trans. 2008;40(9):880–92.
12. Daskin MS, Dean LK. Location of Health Care Facilities. In: Sainfort MB F, Pierskalla W, editors. Handbook of OR/MS in Health Care: A Handbook of Methods and Applications. 2004. p. 43–76.
14. Alejo JS, Martin MG, Ortega-Mier M, Garcia-Sanchez A. Mixed integer programming model for optimizing the layout of an ICU vehicle. BMC Health Serv Res. 2009;9:224.
15. Begur SV, Miller DM, Weaver JR. An integrated spatial DSS for scheduling and routing home-health-care nurses. Interfaces. 1997;27(4):35–48. 16. Deo S, Iravani S, Jiang TT, Smilowitz K, Samuelson S. Improving health
outcomes through better capacity allocation in a community-based chronic care model. Oper Res. 2013;61(6):1277–94.
17. Rosenhead J. Community-based operations research: decision modeling for local impact and diverse populations. Interfaces. 2013;43(6):609–10. 18. Ekici A, Keskinocak P, Swann JL. Pandemic influenza response: food distribution logistics. Manuf Serv Oper Manage. 2014;16(1):11–27. 19. Enns EA, Mounzer JJ, Brandeau ML. Optimal link removal for epidemic
mitigation: a two-way partitioning approach. Math Biosci. 2012;235(2):138–47. 20. Xiong W, Hupert N, Hollingsworth EB, O’Brien ME, Fast J, Rodriguez WR. Can
modeling of HIV treatment processes improve outcomes? Capitalizing on an operations research approach to the global pandemic. BMC Health Serv Res. 2008;8:166.
21. Wang FH. Measurement, optimization, and impact of health care accessibility: a methodological review. Ann Assoc Am Geogr. 2012;102(5):1104–12.
22. Ahmed A, Fincham JE. Physician office vs retail clinic: patient preferences in care seeking for minor illnesses. Ann Fam Med. 2010;8(2):117–23. 23. Kontogiannis S, Spirakis P. Atomic selfish routing in networks: A survey. In:
Deng X, Ye Y, editors. Internet and Network Economics, Proceedings, vol. 3828. Berlin: Springer-Verlag Berlin; 2005. p. 989–1002.
24. Heier Stamm J. Design and Analysis of Humanitarian and Public Health Logistics Systems, Ph.D. Dissertation. Atlanta, GA: PhD thesis available from Georgia Institute of Technology; 2010.
25. McGrail MR, Humphreys JS. A new index of access to primary care services in rural areas. Aust N Z J Public Health. 2009;33(5):418–23.
26. Ngui A, Apparicio P. Optimizing the two-step floating catchment area method for measuring spatial accessibility to medical clinics in Montreal. BMC Health Serv Res. 2011;11:166.
27. Wan N, Zhan FB, Zou B, Chow E. A relative spatial access assessment approach for analyzing potential spatial access to colorectal cancer services in Texas. Appl Geogr. 2012;32(2):291–9.
28. Mao L, Nekorchuk D. Measuring spatial accessibility to healthcare for populations with multiple transportation modes. Health Place. 2013;24:115–22.
29. Schechter MS, Margolis PA. Relationship between socioeconomic status and disease severity in cystic fibrosis. J Pediatr. 1998;132(2):260–4.
30. Knapp E. Cystic Fibrosis Foundation Patient Registry (1986–2010). In: Cystic Fibrosis Foundation. 2012.
31. Ratio of Income to Poverty Level (C17002). In., 2012 edn. http:// factfinder2.census.gov/: U.S. Census Bureau; 2010.
32. Radical Tools 5. In., 5 edn. http://www.radicallogistics.com/: Radical Logistics; 2011.
Submit your next manuscript to BioMed Central and take full advantage of:
• Convenient online submission
• Thorough peer review
• No space constraints or color figure charges
• Immediate publication on acceptance
• Inclusion in PubMed, CAS, Scopus and Google Scholar
• Research which is freely available for redistribution