City, University of London Institutional Repository
Citation
:
Andriotis, Adamantios (2009). Investigation of Cavitation inside Multi-holeInjectors for large Diesel Engines and its Effect on the Near-nozzle Spray Structure. (Unpublished Doctoral thesis, City University London)
This is the unspecified version of the paper.
This version of the publication may differ from the final published
version.
Permanent repository link: http://openaccess.city.ac.uk/1087/
Link to published version
:
Copyright and reuse:
City Research Online aims to make research
outputs of City, University of London available to a wider audience.
Copyright and Moral Rights remain with the author(s) and/or copyright
holders. URLs from City Research Online may be freely distributed and
linked to.
City Research Online: http://openaccess.city.ac.uk/ publications@city.ac.uk
School of Engineering and Mathematical Sciences
Investigation of Cavitation inside
Multi-hole Injectors for large Diesel
Engines and its Effect on the
Near-nozzle Spray Structure
B.Eng Adamantios Andriotis
This thesis is submitted for the fulfilment of the requirements for the Degree
of Doctor of Philosophy
Στηνµητέραµου, Μαίρη, στηνθείαµου, Χριστίνα, στηνγιαγιάµουΒιολέττακαιστον παππούµου, ∆ιαµαντή.
Table of Contents
LIST OF FIGURES ...9
LIST OF TABLES... 22
ACKNOWLEDGEMENTS ... 24
DECLARATION ... 26
ABSTRACT ... 27
NOMENCLATURE ... 30
CHAPTER 1 INTRODUCTION ... 33
1.1MOTIVATION ... 33
1.2AIR POLLUTION ... 36
1.2.1 Ship Exhaust Emissions ... 42
1.2.2 Kyoto Protocol ... 44
1.3THE DIESEL ENGINE ... 46
1.3.1 History of the invention, components and early applications ... 46
1.3.2 Diesel Engine Process ... 49
1.4MODERN TWO-STROKE MARINE DIESEL ENGINE ... 50
1.4.1 Introduction ... 50
1.4.2 Marine Engine Components and Operation... 51
1.5CAVITATION ... 55
1.6THESIS OUTLINE ... 59
CHAPTER 2 LITERATURE REVIEW ... 62
2.1INTRODUCTION ... 62
2.2INTERNAL NOZZLE FLOW AND SPRAY INVESTIGATIONS ... 62
2.3NOZZLE AND INJECTION HOLE GEOMETRIES ... 68
2.3.1 Review of manufacturing methods for nozzle injection holes ... 75
2.4VORTEX CAVITATION ... 77
2.5CAVITATION AND EROSION ... 80
2.6CAVITATION AND EMERGING SPRAY STRUCTURE ... 83
2.6.1 Background knowledge on Fuel Atomization ... 84
2.7SUMMARY OF LITERATURE REVIEW ... 87
3.1INTRODUCTION ... 91
3.1.1 Large scale marine nozzles for internal nozzle flow ... 92
3.1.2 Manufacturing methods ... 99
3.1.3 Large scale marine injector nozzle for internal nozzle flow investigation with tapered injection holes ... 101
3.1.4 Transparent marine nozzles for spray and internal flow visualization ... 105
3.1.5 Large-scale transparent marine injecting nozzles ... 109
3.1.6 Manufacturing methods of injecting nozzles ... 112
3.1.7 Large scale conventional multi-hole nozzles ... 113
3.2CONTINUOUS FLOW TEST-RIG ... 121
3.3IMAGING TECHNIQUES ... 122
3.3.1 Imaging in large scale nozzles with expansion tubes and injecting ... 122
3.3.2 Spray visualization... 125
3.4IMAGE PROCESSING TOOLS ... 127
3.4.1 Mean image calculation ... 127
3.4.2 String Cavitation 3-D reconstruction ... 130
3.4.3 Spray Cone Angle calculation ... 137
3.4.4 String cavitation sequence and radius measurement ... 140
3.4.5 Needle seat cavitation sequence and intensity measurement... 143
3.5DISCUSSION AND QUANTIFICATION OF EXPERIMENTAL ERRORS AND UNCERTAINTY... 144
3.6SUMMARY ... 145
CHAPTER 4 NUMERICAL INVESTIGATION RESULTS ... 147
4.1INTRODUCTION ... 147
4.2MARINE NOZZLE INTERNAL FLOW OVERVIEW ... 148
4.3EFFECT OF GRID ... 149
4.3.1 grid effect on pressure distribution and cavitation prediction ... 151
4.3.2 Grid Effect on Flow Rate, Discharge Coefficient and Mean Exit Velocity ... 153
4.4EFFECT OF NEEDLE LIFT ... 155
4.5PARAMETRIC STUDIES ... 161
4.5.1 Effect of upstream needle geometry... 161
4.5.2 Effect of nozzle geometries ... 166
4.6REAL-SIZE TEST CASES ... 182
4.6.1 Transient flow inlet boundary ... 182
4.6.2 Preliminary Nozzle Hole Cavitation Modeling Results ... 184
4.6.3 Further Numerical Analysis: Velocity Profiles... 188
4.6.4 Hole Interaction Effect ... 191
4.6.5 L/d Effect ... 193
4.7.1 Effect of turbulence model and grid size on vortex core prediction ... 195
4.8SIMULATION WORK:CONCLUSIONS ... 207
CHAPTER 5 EXPERIMENTAL RESULTS-INTERNAL FLOW IN LARGE SCALE MARINE NOZZLES ... 208
5.1INTRODUCTION ... 208
5.2RESULTS -INTERNAL NOZZLE FLOW MARINE CYLINDRICAL INJECTOR - HOLE CAVITATION ... 218
5.3RESULTS -INTERNAL NOZZLE FLOW MARINE CYLINDRICAL INJECTOR - STRING CAVITATION ... 222
5.4RESULTS -INTERNAL NOZZLE FLOW MARINE TAPERED INJECTOR - STRING CAVITATION ... 249
5.5RESULTS -INTERNAL NOZZLE FLOW MARINE INJECTOR -STRING CAVITATION EFFECT ON HOLE FLOW CHARACTERISTICS ... 258
5.6RESULTS -INTERNAL NOZZLE FLOW MARINE INJECTOR - EFFECT OF HOLE INTERACTION ON STRING CAVITATION ... 265
5.7INTERNAL NOZZLE FLOW MARINE INJECTOR –UNDERSTANDING THE MECHANISM OF STRING CAVITATION FORMATION ... 269
5.7.1 Description of test cases ... 270
5.7.2 Cavitation regimes in the cylindrical-hole nozzle ... 272
5.7.3 Cavitation formation in the cylindrical-hole nozzle ... 274
5.7.4 Cavitation formation in the Tapered-hole nozzle... 276
5.7.5 Quantitative string cavitation characterization ... 278
5.8INTERNAL NOZZLE FLOW MARINE INJECTOR –CONCLUSIONS ... 281
CHAPTER 6 NEAR NOZZLE HOLE EXIT SPRAY STRUCTURE VISUALIZATION ... 284
6.1INTRODUCTION ... 284
6.2SPRAY INVESTIGATION -PREDICTED FLOW FIELD OF THE NOZZLES ... 291
6.3SPRAY INVESTIGATION –DISCHARGE COEFFICIENT OF THE INJECTING NOZZLES ... 295
6.4SPRAY INVESTIGATION –EFFECT OF THE SAC VOLUME GEOMETRY ON STRING CAVITATION LOCATION . 296 6.5SPRAY INVESTIGATION –STRING CAVITATION EFFECT ON SPRAY STRUCTURE FOR BOTH CYLINDRICAL AND TAPERED INJECTION HOLES ... 298
6.6SPRAY INVESTIGATION –STRING CAVITATION IN HOLE ORIENTATION EFFECT ON SPRAY STRUCTURE ... 300
6.7SPRAY INVESTIGATION –SPRAY STRUCTURE OF FIVE HOLE NOZZLES ... 302
6.8SPRAY INVESTIGATION –EFFECT OF STRING CAVITATION INTENSITY ON SPRAY STRUCTURE ... 303
6.9SPRAY INVESTIGATION –FIVE-HOLE NOZZLES SPRAY STRUCTURE AND SPRAY ANGLE PARAMETRIC INVESTIGATION ... 306
6.10SPRAY INVESTIGATION –FIVE-HOLE NOZZLES SPRAY STRUCTURE AND SPRAY ANGLE PARAMETRIC INVESTIGATION ... 314
6.11SPRAY INVESTIGATION –EFFECT OF IMAGING AND MEASURING PARAMETERS ON SPRAY ANGLE CALCULATION ... 324
6.13SPRAY INVESTIGATION – NUMERICAL INVESTIGATION AND INTERPRETATION OF EXPERIMENTAL
RESULTS... 331
6.14SPRAY INVESTIGATION –CONCLUSIONS ... 335
CHAPTER 7 EXPERIMENTAL RESULTS-INTERNAL FLOW IN LARGE SCALE MULTI-HOLE NOZZLES ... 337
7.1INTRODUCTION ... 337
7.2CAVITATION STRUCTURES INSIDE VCO NOZZLE WITH CYLINDRICAL AND TAPERED HOLES ... 338
7.3VCO NOZZLE WITH CYLINDRICAL AND TAPERED HOLES-PARAMETRIC STUDIES ... 348
7.4INTERNAL FLOW IN LARGE SCALE CONVENTIONAL MULTIHOLE SAC-TYPE NOZZLE ... 354
7.4.1 Erosion & needle seat cavitation ... 355
7.4.2 Needle seat cavitation quantitative analysis ... 364
7.4.3 Needle Seat Cavitation 3-D Reconstruction ... 389
7.5STRING CAVITATION INSIDE THE SAC-TYPE NOZZLE WITH CYLINDRICAL HOLES ... 392
7.5.1 String Cavitation 3-D reconstruction ... 404
7.6CONCLUSIONS ... 409
CHAPTER 8 CONCLUSIONS & RECOMMENDATIONS FOR FUTURE WORK ... 411
8.1NUMERICAL INVESTIGATION IN MARINE NOZZLES ... 411
8.2INTERNAL NOZZLE FLOW PATTERNS –MARINE &MULTI-HOLE NOZZLES ... 412
8.3NEAR HOLE EXIT SPRAY CHARACTERISTICS ... 414
8.4NEEDLE SEAT CAVITATION ... 415
8.5RECOMMENDATIONS FOR FUTURE WORK ... 416
List of Figures
Figure 1-1: Relative fraction of man-made GHGs per category. [According to Emission Database for Global
Atmospheric Research (2000)] ... 38
Figure 1-2: GHGs in Europe (EU-15 2005). Modified from [1] ... 39
Figure 1-3: CO2 Emissions in transport according to [4].(presented by European Environment Agency) ... 44
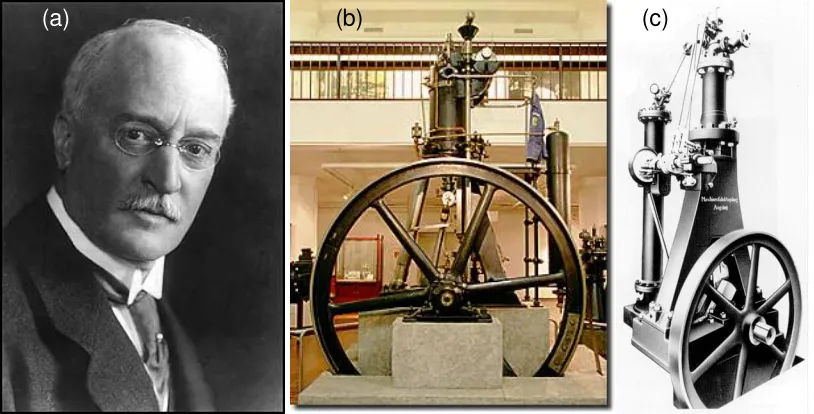
Figure 1-4: a) Rudolf Diesel (1858 – 1913). b) and c) first successful Diesel engine in 1897 (20hp, 172min-1) ... 46
Figure 1-5: M/s Selandia 1912-1937. The first oceangoing ship powered by Diesel engines.[5] ... 47
Figure 1-6: Cross section of MAN B&W K98MC-C Two-Stroke slow speed Diesel engine. [courtesy of [10] ... 53
Figure 2-1: Schematic of needle eccentricity effect in a multi-hole VCO nozzle (modified from [39]) ... 69
Figure 2-2: Hole-to-hole and cycle-to-cycle variation from a 3 –hole VCO single guided nozzle. [20 kg m-3 in-cylinder density, 2 MPa in-cylinder pressure, 60 MPa injection pressure, the images are captures 0.17 ms after first sight of fuel]. (by courtesy of [39]) ... 70
Figure 2-3: Effect of injection time on hole-to-hole spray variations for a 5-hole VCO nozzle (a & b) [Pinj=140 MPa, Pback=1MPa]. Effect of number of injection holes on hole-to-hole spray variations for a 3-hole, 5-hole and 7-hole VCO nozzle (c, d & e respectively) [ Pinj=60 MPa, Pback=1MPa]. (by courtesy of [39]) ... 71
Figure 2-4: Typical examples of different injection hole geometries. (Modified from [28]) ... 72
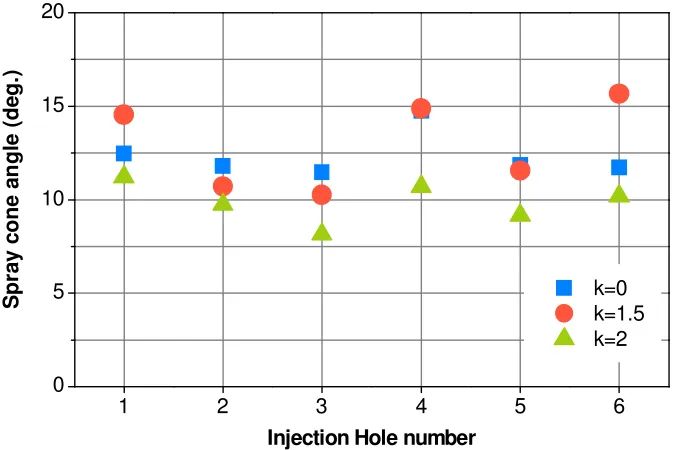
Figure 2-5: Effect of k-factor on spray cone angle from individual holes for a 6-hole VCO nozzle.[PInj =1200 bar, PChamber=15 bar](modified from [47]) ... 74
Figure 2-6: Hydrogrinding Phases and its effect on Discharge coefficient. (modified from[45]) ... 77
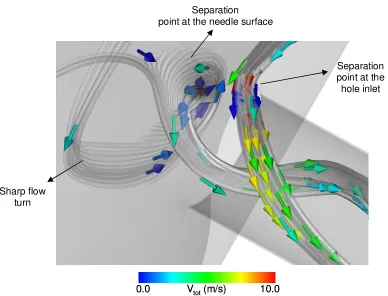
Figure 2-7: Visualisation of flow separation points present in typical Diesel automotive injector nozzles. Velocity vector coloured with the magnitude of velocity showing locations of sudden deceleration. ... 79
Figure 3-1: 3-D schematic of a) a marine nozzle and b) the injector needle (also referred as cut-off shaft) .... 92
Figure 3-2: Schematic of the internal marine nozzle flow pattern ... 93
Figure 3-3: Enlarged transparent and metal needle parts ... 94
Figure 3-4: schematic of the cross-section of the large-scale nozzle model used ... 95
Figure 3-5: 3-D schematic of the large-scale transparent marine nozzle ... 96
Figure 3-6: 3-D schematic of the large-scale transparent marine nozzle. (Top-View) ... 97
Figure 3-7: Photograph of the large-scale marine model fitted on the test rig. ... 98
Figure 3-8: Photograph of the large-scale marine model fitted on the test rig. Bottom view ... 99
Figure 3-9: image showing a defective injection hole of the large scale marine nozzle model. ... 100
Figure 3-10: Photograph of the large scale marine tapered nozzle model. Bottom-view... 103
Figure 3-11: photographs of the large scale marine tapered nozzle model. Side-view. ... 103
Figure 3-12: specially made cutting tool for manufacturing of the tapered injection holes (outward converging) of the large scale marine nozzle model. ... 104
Figure 3-13: Close-Up view of the tapered injection holes of the large scale transparent marine nozzle model. ... 104
Figure 3-14: 3-D schematic and photograph of the transparent marine injecting models. ... 107
Figure 3-16: Photograph of injecting marine nozzle model sac volume detail ... 109
Figure 3-17: Photograph marine nozzle model fitted on the test rig used for spray visualisations ... 110
Figure 3-18: 3-D schematic of all marine nozzle models used for spray visualization. a) 5-hole cylindrical (real & large scale), b) 2-hole cylindrical (large scale), c) 1-hole cylindrical (large scale), d) 5-hole tapered (large scale), e) 2-hole tapered (large scale) and f) 1-hole tapered (large scale). ... 111
Figure 3-19: Geometry of the VCO nozzle (a) and sac-type nozzle (b) investigated. ... 113
Figure 3-20: Photographs of large-scale VCO nozzle. ... 114
Figure 3-21: photograph of the large-scale transparent model of the sac-type nozzle. (Side view)... 115
Figure 3-22: Perspex block of the large-scale transparent VCO Tapered nozzle, with injection holes before bonding. ... 116
Figure 3-23: Schematic of the injection hole geometry of the investigated VCO nozzle. ... 116
Figure 3-24: From real-size to large-scale injector. (as shown in [114]) ... 117
Figure 3-25: 3-D schematic of the eccentricity mechanism for the large-scale multi-hole nozzles. ... 118
Figure 3-26: 3-D schematics of the Perspex needle models used with the large-scale multi-hole models. ... 119
Figure 3-27: photographs of selected enlarged transparent needle parts used with multi-hole nozzles... 120
Figure 3-28: Schematic of the improved refractive index matching flow test rig with incorporated Large-Scale model nozzle ... 122
Figure 3-29: Schematic of HSDV imaging in large-scale 3-D model nozzle ... 123
Figure 3-30: Photograph of HSDV imaging in large-scale 3-D nozzle (Bottom) ... 124
Figure 3-31: Schematic of CCD imaging in Real-Size nozzle ... 125
Figure 3-32: Photograph of typical arrangement of the equipment ... 126
Figure 3-33: a) image with string, b) background image, c) subtraction of (a) with (b), d), e) and f) same as (a), (b) and (c) but with ‘jet’ color map to increase image contrast. ... 129
Figure 3-34: a) Figure 3-33 (c) after thresholding, b) a typical mean image calculation result and c) same as (b) superimposed on a 3-d schematic of the nozzle. ... 130
Figure 3-35: a) Schematic showing the cameras position with respect to the nozzle, b) typical side view image and c) typical bottom view image. ... 131
Figure 3-36: a) Bottom view background image, b) indexed image after subtracting Figure 3-36 (a) from Figure 3-35 (c) and c) Figure 3-36 (b) converted to binary. ... 131
Figure 3-37: a) Gaussian low pass filter used, b) Figure 3-36 (c) after applying filter and c) after labelling all image features... 133
Figure 3-38: a) image of the isolated object of interest (i.e. string), b) image of string after filling of internal gaps and after restoring the string size and c) image of the string boundary and centreline. ... 134
Figure 3-39: 3-D reconstructed string a) side view, b) bottom view and c) stereoscopic view. ... 136
Figure 3-40: a) typical spray image from the single hole cylindrical nozzle and b) the corresponding background image. ... 137
Figure 3-41: a) thresholded section of the original spray image Figure 3-40 (a) before processing and b) after image processing. ... 138
Figure 3-42: Original spray image with the boundary, after the processing, superimposed for comparison. . 139
Figure 3-43: Schematic showing the spray cone angle measurement. ... 140
Figure 3-44: Large-scale VCO nozzle with tapered injection holes. a) background image, b) image with string and c) thresholded image. ... 141
Figure 3-46: selected regions for hole-to-hole string cavitation in large-scale multi-hole nozzle models. ... 143
Figure 3-47: Selected regions for string cavitation in large-scale marine injecting nozzles. ... 143
Figure 3-48: Selected regions for Needle-Seat cavitation in large-scale Multi-hole internal flow nozzles. ... 144
Figure 4-1: 3-D standard geometry for numerical investigation ... 148
Figure 4-2: 3-D Mesh of Standard Geometry for Numerical investigation. (a) 67,000 cells, (b) 164,000 cells and (c) 460,000 cells ... 150
Figure 4-3: 3-D Mesh of Standard Geometry (Hole 3 Cross-section). (a) 67,000 cells, (b) 164,000 cells and (c) 460,000 cells ... 150
Figure 4-4: Grid Effect on Pressure Distribution. (a) 67,000 cells, (b) 164,000 cells and (c) 460,000 cells .. 151
Figure 4-5: Grid Effect on Cavitation Prediction, Steady State results. Single-Phase Tension. (a) 67,000 cells, (b) 164,000 cells and (c) 460,000 cells ... 152
Figure 4-6: Grid Effect on Discharge Coefficient of Individual Holes. Steady State results. ... 153
Figure 4-7: Grid Effect on Flow rate Variation of Individual Holes. Steady State results. ... 153
Figure 4-8: Grid Effect on Mean Exit Velocity of Individual Holes. Steady State results... 154
Figure 4-9: Grid Effect on Mean Exit Velocity Variation. Steady State results. ... 154
Figure 4-10: 3-D schematic of Full (a), 80% (b), 60% (c) and 40% (d) Needle Lift Nozzle Geometry for Steady-State simulations ... 156
Figure 4-11: Needle Lift Effect on Pressure Distribution @ Full (a), 80% (b), 60% (c) and 40% (d) Lift. Global Scale ... 157
Figure 4-12: Needle Lift Effect on Pressure Distribution @ Full (a), 80% (b), 60% (c) and 40% (d) Lift. Local Scale ... 157
Figure 4-13: Needle Lift Effect on Predicted flow structure inside the nozzle volume and the injection holes @ Full (a), 80% (b), 60% (c) and 40% (d) Lift. (Hole 1) ... 158
Figure 4-14: Needle Lift Effect on Predicted flow structure inside the nozzle volume and the injection holes @ Full (a), 80% (b), 60% (c) and 40% (d) Lift. (Hole 3) ... 159
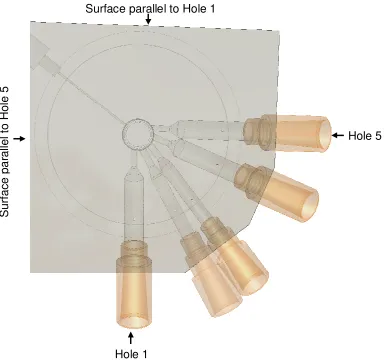
Figure 4-15: Needle Lift Effect on Predicted flow structure inside the nozzle volume and the injection holes @ Full (a), 80% (b), 60% (c) and 40% (d) Lift. (Hole 5) ... 159
Figure 4-16: Needle Lift Effect on Predicted Flow rate Variation [%] of Individual Holes @ Full, 80%, 60% and 40% Lift. ... 160
Figure 4-17: Needle Lift Effect on Predicted Mean Exit Velocity Variation [%] of Individual Holes @ Full, 80%, 60% and 40% Lift. ... 160
Figure 4-18: 3-D Schematic of full lift complete geometry grid ... 161
Figure 4-19: Complete Geometry Pressure and Velocity Distribution @ XZ Plane. Full Lift. ... 162
Figure 4-20: Contour plots of pressure distribution at hole cross-section. Complete Vs short geometry. Full lift. ... 163
Figure 4-21: Contour Plots of Velocity Distribution at hole cross-section. Complete Vs Short Geometry. Full Lift. ... 163
Figure 4-22: Needle geometry Effect on Mean Exit Velocity. Complete Vs Short Geometry. Full Lift. ... 164
Figure 4-23: Needle geometry Effect on Flow rate Variation [%] of Individual Holes. Complete Vs Short Geometry. Full Lift... 164
Figure 4-24: Needle geometry Effect on Predicted flow structure inside the nozzle volume (Hole 5). Full Lift. ... 165
Figure 4-26: 3-D schematic of Conceptual Nozzle Designs (Uniform Flow). (a) 5-Spheres, (b) Without
Spheres and (c) Single Groove designs. ... 167
Figure 4-27: Pressure Distribution of Conceptual Nozzle Designs Vs Standard Design. (a) Standard, (b) 5-Spheres, (c) Without Spheres and (d) Single Groove designs. ... 167
Figure 4-28: Flow rate Variation [%] of Conceptual Nozzle Designs Vs Standard Design ... 169
Figure 4-29: Discharge Coefficient of Conceptual Nozzle Designs Vs Standard Design ... 169
Figure 4-30: Predicted flow structure inside the nozzle volume. (a) Standard, (b) 5-spheres, (c) without spheres and (d) single groove. ... 170
Figure 4-31: Predicted Single-Phase Tension. (a) Standard, (b) 5-spheres, (c) without spheres and (d) single groove design. ... 171
Figure 4-32: Isosurface plots of predicted velocity @ 240 m/s. (a) Standard, (b) 5-spheres, (c) without spheres and (d) single groove design. ... 172
Figure 4-33: Predicted velocity vectors on the nozzle exit plane, indicating that the liquid may be deflected relative to the hole axis orientation (Hole 1). (a) Standard, (b) 5-spheres, (c) without spheres and (d) single groove design. ... 173
Figure 4-34: 3-D schematic of further conceptual nozzle designs. (a) Modified sac volume, (b) Middle-hole spheres and (c) Tapered holes designs. ... 174
Figure 4-35: Pressure Distribution (Global Scale-Bottom View) of Standard (a), Modified Sac Volume (b), Middle-hole spheres (c) and Taped Holes (d) Designs... 175
Figure 4-36: Pressure Distribution (Global Scale-top View) of Standard (a), Modified Sac Volume (b), Middle-hole spheres (c) and Taped Holes (d) Designs... 176
Figure 4-37: Flow rate Variation [%] of Conceptual Nozzle Designs Vs Standard Design (2) ... 177
Figure 4-38: Discharge Coefficient of Conceptual Nozzle Designs Vs Standard Design (2) ... 178
Figure 4-39: Predicted Single-Phase Tension. Standard (a), Modified Sac Volume (b), Middle-hole spheres (c) and Taped Holes (d) Designs.(2) ... 179
Figure 4-40: Predicted Flow structure inside the nozzle volume. Standard (a), Modified Sac Volume (b), Middle-hole spheres (c) and Taped Holes (d) Designs. (Overview) ... 180
Figure 4-41: Predicted flow structure inside the nozzle volume. Standard (a), Modified Sac Volume (b), Middle-hole spheres (c) and Taped Holes (d) Designs.(2) ... 181
Figure 4-42: Mass flow rate Vs Time (Standard Design - Short Version) ... 182
Figure 4-43: Discharge Coefficient Vs Time (Standard Design – Short Version) ... 183
Figure 4-44: Cavitation Number of each hole at which tension regions are predicted. Transient Simulation. Original Vs 5-Spheres design. ... 183
Figure 4-45: 3-D schematic of the predicted tension regions time history. Standard Design. ... 185
Figure 4-46: History of the predicted tension volume reduction. Standard design. ... 186
Figure 4-47: 3-D view of calculated cavitation bubbles inside the injection holes, vapour-liquid inter-phase and flow structure (Hole 3 only). Standard Design. ... 186
Figure 4-48: 3-D Void Fraction Distribution (different views). Standard Design... 187
Figure 4-49: Time History of the Flow rate Reduction and Blockage. Standard Design ... 187
Figure 4-50: Coordinate system translation for velocity profile calculation... 188
Figure 4-51: Tangent velocity vectors. Standard design different holes ... 189
Figure 4-52: Axial velocity Distribution. Standard design different holes ... 190
Figure 4-53: Hole interaction effect on discharge coefficient ... 191
Figure 4-55: Hole interaction effect on Tension Volume. (a) Default Case and (b) Only Hole 2 open ... 192
Figure 4-56: Hole interaction effect on Pressure and total velocity Distribution. (a) Default Case Hole 2 and (b) Only Hole 2 open. ... 192
Figure 4-57: Hole interaction effect on Predicted flow structure inside the nozzle volume. (a) Default Case and (b) Only Hole 2 open ... 193
Figure 4-58: 3-D numerical grids used in the Hole Length effect investigation ... 193
Figure 4-59: Hole Length effect on discharge coefficient ... 194
Figure 4-60: Hole Length effect on Mean Exit Velocity ... 194
Figure 4-61: Hole length effect on Predicted flow structure inside the nozzle volume. (a) Standard Design and (b) Long Holes Design. Hole 4 ... 195
Figure 4-62: Computational parameters for the turbulence model effect investigation. ... 196
Figure 4-63: Computational grids for the turbulence model effect investigation ... 197
Figure 4-64: iso-surfaces of swirl intensity inside the core of the nozzle volume vortex coloured with the axial velocity component of the liquid. [Default grid, Std. k-ε] ... 199
Figure 4-65: Predicted temporal variation of hole-to-hole flow rate. ... 199
Figure 4-66: iso-surfaces of swirl intensity inside the core of the nozzle volume vortex coloured with the axial velocity component of the liquid. [Default grid, Std. k-ω] ... 201
Figure 4-67: Predicted temporal variation of hole-to-hole flow rate. [Default grid, Std. k-ω] ... 201
Figure 4-68: iso-surfaces of swirl intensity inside the core of the nozzle volume vortex coloured with the axial velocity component of the liquid. [Default grid, RNG k-ε] ... 202
Figure 4-69: Predicted temporal variation of hole-to-hole flow rate. [Default grid, RNG k-ε] ... 202
Figure 4-70: iso-surfaces of swirl intensity inside the core of the nozzle volume vortex coloured with the axial velocity component of the liquid. [Default grid, Neq. k-ε]... 203
Figure 4-71: Predicted temporal variation of hole-to-hole flow rate. [Default grid, Neq. k-ε] ... 203
Figure 4-72: iso-surfaces of swirl intensity inside the core of the nozzle volume vortex coloured with the axial velocity component of the liquid. [Dense grid, Std. k-ε] ... 204
Figure 4-73: iso-surfaces of swirl intensity inside the core of the nozzle volume vortex coloured with the axial velocity component of the liquid. [Dense grid, Std. k-ω] ... 204
Figure 4-74: iso-surfaces of swirl intensity inside the core of the nozzle volume vortex coloured with the axial velocity component of the liquid. [Dense grid, RNG k-ε] ... 205
Figure 4-75: iso-surfaces of swirl intensity inside the core of the nozzle volume vortex coloured with the axial velocity component of the liquid. [Dense grid, Neq. k-ε] ... 205
Figure 4-76: Predicted temporal variation of hole-to-hole flow rate. [Dense grid] ... 206
Figure 5-1: Schematic showing the viewing area of the camera for the side and bottom view focusing in the hole (black rectangle) and in the sac volume (red rectangle). ... 217
Figure 5-2: Cavitation structure and its variation with CN inside hole 5 for side and bottom view [Case: 20, 21, 22, 26, 27]. Red line describes the boundary of cavitation inside the injection hole... 218
Figure 5-3: Cavitation structure and its variation with Re inside hole 5 side and bottom view [Case: 4, 7, 13]. Red line describes the boundary of cavitation inside the injection hole. ... 219
Figure 5-4: Measured nozzle discharge coefficient as function on cavitation number for different Reynolds numbers and needle lifts. ... 220
Figure 5-6: Typical image of string cavitation formed inside the nozzle volume at two different time instances with ∆τ∼100 (a) bottom view and (b) side view [nominal needle lift, CN =4.0, Re =68 000]. ... 224
Figure 5-7: unstructured computational grid for the 5-hole nozzle with local refinement upstream and at the entry to the injection holes. ... 225
Figure 5-8: Predicted flow structure inside the nozzle volume and the injection holes (a) flow structure with two large vortices entering in holes 1 and 5, (b) flow structure with a large vortex entering in hole 1 (c) the same flow structured as seen from the front view and (d) flow lines entering into string cavitation-free holes 3 and 4. (color scale not significant) ... 226
Figure 5-9: Prediction of flow structure inside the sac volume (a) path lines of vortex in front of hole 1, (b) vortical structure at ∆τ∼100 relative to previous flow, showing the vortical structure located in front of hole 5.
... 227
Figure 5-10: Predicted cavitation vapour volume fraction iso-surfaces inside the nozzle holes and core of the nozzle volume vortex colored with the axial velocity component of the incoming liquid, as seen from two different views [nominal needle lift, CN =4.0, Re =68 000]. ... 228
Figure 5-11: 3-D reconstruction of cavitation string inside the nozzle volume superimposed with predicted flow lines exiting from hole No 1 [Case 7]. (colour scale not significant) ... 230
Figure 5-12: 3-D reconstruction of cavitation string inside the nozzle volume superimposed with predicted flow lines exiting from hole No 5 [Case 7]. (colour scale not significant) ... 231
Figure 5-13: 3-D reconstruction of cavitation string (red) inside the nozzle volume superimposed with predicted flow lines exiting from hole No 4 [Low needle lift, CN=4, Re=53,000]. (colour scale not
significant) ... 232
Figure 5-14: Effect of increasing flow rate on two-dimensional temporally and spatially averaged images of string cavitation probability, showing the initial stages of the development of hole and string cavitation. [Low needle lift] ... 234
Figure 5-15: Sequence of images showing string induced hole cavitation [Nominal needle lift, CN=0.6]... 235
Figure 5-16: Effect of cavitation number on two-dimensional temporally and spatially averaged images of cavitation string probability [nominal needle lift, Re ∼53 000] ... 237
Figure 5-17: Effect of Reynolds numbers on two-dimensional temporally and spatially averaged images of cavitation string probability [Full lift]. ... 238
Figure 5-18: CCD image of cavitation structures formed in the space upstream the inlet of the injection holes and the edge of the needle [Nominal needle lift, CN=4.0, Re=53,000]. ... 239
Figure 5-19: Hole Cavitation structure, and its variation with needle lift, inside Hole 1. Side and Bottom View [CN∼1, Re∼32,000]. Red line describes the boundary of cavitation inside the injection hole. ... 240
Figure 5-20: Typical image of string cavitation formed inside the nozzle volume at three different lifts (a) bottom view and (b) side view [CN =4.0, Re =53,000]. ... 241
Figure 5-21: Effect of needle lift on two-dimensional temporally and spatially averaged images of cavitation string probability [CN=4, Re=53,000]... 242
Figure 5-22: 3-D scematice showing two strings corresponding to different time instances in the nozzle sac volume. ... 243
Figure 5-23: Three-dimensional iso-surfaces of cavitation string cavitation probability for (a) low lift and (b) nominal lift [CN=4, Re=53,000]. ... 244
Figure 5-24: Comparison between measured temporal development of string cavitation presence next to holes 1 and 5 and predicted vortex core presence attached to these holes for (a) Re =68,000, with expansion tubes, (b) Re =53,000, with expansion tubes, (c) Re =68,000, without expansion tubes. [CN ∼4.0, nominal needle lift] ... 246
vortex presence in holes 1 and 5; the similarity with the large-scale nozzle presented in figure 2-23 (c) is evident. ... 248
Figure 5-26: Predicted pressure distribution inside the tapered large-scale 5-hole nozzle [High needle lift, CN=3.0, Re=53,000] ... 250
Figure 5-27: Prediction of flow structure inside the sac volume of the tapered large scale nozzle (a) path lines of vortex in front of hole 1, (b) vortical structure located in front of hole 5. (color scale not significant) ... 251
Figure 5-28: Representative images for the tapered 5-hole large scale nozzle for different CN values, showing no string cavitation. [Nominal needle lift, Re ∼55,000]. ... 252
Figure 5-29: Representative images for the tapered 5-hole large scale nozzle at low needle lift showing presence of string cavitation next to hole 4 [CN=2.0, Re =52,000]. ... 254
Figure 5-30: Representative images for the tapered 5-hole large scale nozzle at low needle lift and high CN showing presence of string cavitation next to hole 2 [Re ∼53,000]. ... 255
Figure 5-31: Representative images for the tapered 5-hole large scale nozzle at high needle lift showing presence of string cavitation exiting through hole 1 [CN=4.5, Re =68,000]. ... 256
Figure 5-32: Pressure taping used in order to introduce air bubbles directly inside the sac volume of the large scale tapered marine nozzle ... 257
Figure 5-33: Representative image for the geometric hole cavitation-free tapered 5-hole nozzle with air bubbles introduced into the sac volume in the area of the vortex development at high needle lift, resulting to an induced string-like two-phase flow structure [CN=3.0, Re=53,000]. ... 258
Figure 5-34: Effect of string cavitation on the flow distribution inside the injection hole, as seen from the side view (a) with string cavitation and (b) without string cavitation (nominal needle lift, CN=4.0, Re =53 000). ... 259
Figure 5-35: Predicted temporal hole-to-hole flow rate variation [CN=4.0, Re=53,000]. ... 260
Figure 5-36: Experimental hole-to-hole flow rate variation for a set of measurements [Re=53,000]. ... 261
Figure 5-37: Measured mean hole-to-hole flow rate variation (a) without strings, (b) with string in hole 1 only and (c) with strings in holes 1 and 5 [CN=4.0, Re=53,000, Full lift]. ... 262
Figure 5-38: Measured hole-to-hole flow rate variation at low needle lift, with strings always present in holes 4 and 5 [CN=4.0, Re=53,000]. ... 263
Figure 5-39: Predicted temporal variation of hole-to-hole flow rate for (a) cylindrical 5-hole nozzle and (b) tapered large-scale 5-hole nozzle [Nominal needle lift, CN=4.0, Re=68,000]. ... 264
Figure 5-40: Two-dimensional spatially averaged images of cavitation string probability or different scenarios of hole combination blocking [Low needle lift, CN=2.6, Re∼20,000) ... 267
Figure 5-41: typical CCD image and Two-dimensional spatially averaged image of cavitation string
probability having hole 2 blocked [nominal needle lift, CN=2.6, Re =45 000] ... 268
Figure 5-42: typical CCD image and Two-dimensional spatially averaged image of cavitation string
probability having only hole 3 open [nominal needle lift, CN=2.6, Re =13,000] ... 269
Figure 5-43: Single-Hole Large-Scale marine nozzle replicas schematic and photo ... 270
Figure 5-44: Images showing four distinct cavitation patterns inside the injection hole of the single-hole cylindrical nozzle, a) only geometric cavitation, b) string cavitation at the lower part of the injection hole, full mixing with geometric cavitation, c) string cavitation at the centre of the hole, partially mixing with geometric cavitation and d) string cavitation at the upper part of the injection hole, string cavitation separated from geometric cavitation [CN=2, Re=52,950] ... 273
Figure 5-45: Sequence of high speed images showing the formation of string cavitation inside the single-hole cylindrical nozzle at low cavitation number [CN=1, Re=52,950] ... 275
Figure 5-47: Post-processed high speed images revealing the formation of string cavitation inside the tapered single-hole nozzle [CN=2, Re=70,600] ... 277
Figure 5-48: Post-processed high speed images revealing the formation of string cavitation inside the tapered single-hole nozzle at increased cavitation number [CN=4, Re=91,770] ... 278
Figure 5-49: Spatial probability of string cavitation location inside the tapered single-hole nozzle [CN=2, Re=70,600] ... 279
Figure 5-50: Effect of cavitation number on string appearance sequence for the cylindrical single-hole nozzle at high needle lift (a) CN=1, Re=49,400, (b) CN=2, Re=52,950 and (c) CN=7, Re=88,250. Top row
corresponds to region 1 and bottom to region 2 of Figure 3-47, respectively. ... 280
Figure 5-51: Effect of needle lift on string appearance sequence for the cylindrical single-hole nozzle at nominal cavitation number (a) CN=4, Re=70,600, nominal lift & (b) CN=4, Re=67,060, low lift. Top row corresponds to region 1 and bottom to region 2 of Figure 3-47, respectively. ... 281
Figure 6-1: CFD calculation of the flow structure inside the sac volume of the cylindrical five-hole nozzle, showing the main flow path entering into the upper part of the hole and the secondary vortical flow structure forming inside the nozzle volume and entering into the injection hole from the bottom part [CN=4,
Re≈65,000, Nominal Lift]. (color scale not significant) ... 292
Figure 6-2: CFD calculation of the flow structure inside the sac volume of the cylindrical two-hole nozzle, showing the main flow path entering into the upper part of the hole and the secondary vortical flow structure forming inside the nozzle volume and entering into the injection hole from the bottom part [CN=4,
Re≈65,000, Nominal Lift]. (color scale not significant) ... 293
Figure 6-3: CFD calculation of the flow structure inside the sac volume of the cylindrical single hole nozzle, showing the main flow path entering into the upper part of the hole and the secondary vortical flow structure forming inside the nozzle volume and entering into the injection hole from the bottom part [CN=4,
Re≈65,000, Nominal Lift]. (colour scale not significant) ... 294
Figure 6-4: Averaged (over three needle lifts) measured discharge coefficient for all nozzle designs tested . 296
Figure 6-5: Image showing string location inside the no-groove five-hole nozzle. ... 297
Figure 6-6: Measured discharge coefficient for five-hole a) Cylindrical, b) Tapered and c) No groove design nozzle for different lifts. ... 297
Figure 6-7: Spray images from the (a) cylindrical single-hole nozzle at Re=65,900 and (b) tapered single-hole nozzle at Re=88,250. The images show the near-nozzle deflection angle above and below the hole axis of symmetry attributed to the presence of string cavitation [CN=4, Nominal needle lift]. ... 299
Figure 6-8: Effect of string cavitation exiting location on the near nozzle spray angle of the cylindrical two-hole nozzle (a) without string cavitation, (b) cavitation string exiting from the upper part of the injection two-hole and (c) cavitation string exiting from the bottom part of the injection hole [CN=2, Re=48,300, Low needle lift]. ... 301
Figure 6-9: Effect of string cavitation on near-nozzle spray angle of the No. 5 hole of the cylindrical 5-hole nozzle (a) without string cavitation and (b) with string cavitation [CN = 4, Re = 64,000, nominal needle lift]. ... 302
Figure 6-10: Effect of string cavitation extent on the near nozzle spray angle of the Tapered single-hole nozzle (a) ‘exiting string’ (b) cavitation ‘non-exiting string’ (c) ‘no string’ [CN=4, Re=68,000, Nominal needle lift] ... 303
Figure 6-11: Measured temporal variation of the upper and bottom spray angle for the tapered single-hole nozzle. The presence of string cavitation inside the nozzle hole recorded simultaneously with the spray angle is also indicated [CN=4, Re=68,000, Nominal needle lift] ... 304
Figure 6-12: Measured probability distribution function of the maximum deflection spray angle above and below the hole axis of symmetry for the cylindrical single-hole nozzle at Re=65,900 and tapered single-hole nozzle at Re=88,250 [CN=4, Nominal needle lift]. ... 305
Figure 6-14: CCD images of the spray injected from holes No 4 and 5, taken at 0.5µs exposure time at CN=4. (a) without String and (b) with string. ... 307
Figure 6-15: 2-D liquid probability, averaged over 300 spray images and showing the effect of cavitation string on spray cone angle of holes No 4 and 5 [CN=4]. (a) without String and (b) with string. ... 308
Figure 6-16: 2-D liquid probability, averaged over 300 spray images and showing the effect of cavitation string on spray cone angle of hole No 1 [CN=4]. (a) without String and (b) with string. ... 308
Figure 6-17: 2-D liquid probability, showing the effect of CN on spray dispersion for Hole No 1. (a) CN=1, (b) CN=1.5, (c) CN=2, (d) CN=3, (e) CN=3.5 and (f) CN=5. ... 310
Figure 6-18: 2-D liquid probability, showing the effect of Needle Lift on spray Dispersion for Hole No 1. (a) CN=2, (b) CN=2, High Needle Lift, (c) CN=15 and (d) CN=15, High Needle Lift... 311
Figure 6-19: CCD images of the spray injected from holes No 1, taken at 0.5µs exposure time at CN=3. The spray deviation from the hole axis is revealed. (a) without String and (b) with string. ... 312
Figure 6-20: CCD images of the spray injected from hole No 1, taken at 5µs exposure time at CN=4. The spray deviation from the hole axis is revealed. (a) without String and (b) with string. ... 312
Figure 6-21: Measured spray cone angle and deflection angle from the axis of injection of hole No 1 as function of cavitation number. ... 313
Figure 6-22: Measured spray cone angle of hole No 4 as function of cavitation number for 300µs exposure time. Spray cone angles in the presence and absence of string are indicated by the two different lines. ... 314
Figure 6-23: 2-D liquid probability, showing the effect of CN on spray dispersion for the Single Hole Cylindrical Nozzle. (a) CN=1, (b) CN=2, (c) CN=4 and (d) CN=7. ... 315
Figure 6-24: measured temporal variation of upper, bottom and total spray angle of the cylindrical single-hole nozzle for a) CN=1, b) CN=2, c) CN=4 and d) CN=7. ... 317
Figure 6-25: PDF distribution of upper and bottom spray angle of the cylindrical single-hole nozzle for a) CN=1, b) CN=2, c) CN=4 and d) CN=7. ... 318
Figure 6-26: 2-D liquid probability, showing the effect of CN on spray dispersion for the Single Hole Tapered Nozzle. (a) CN=2, (b) CN=4 and (c) CN=7. ... 319
Figure 6-27: measured temporal variation of upper, bottom and total spray angle of the Tapered single-hole nozzle for a) CN=2, b) CN=4 and c) CN=7... 320
Figure 6-28: PDF distribution of upper, bottom and total spray angle of the Tapered single-hole nozzle for a) CN=2, b) CN=4 and c) CN=7. ... 321
Figure 6-29: 2-D liquid probability, showing the effect of lower needle lift on spray dispersion for the Single Hole Nozzle. (a) Cylindrical, (b) Tapered. [CN=4] ... 322
Figure 6-30: Measured temporal variation (Top Row) and PDF distribution (Bottom Row) of upper, bottom and total spray angle for the Single Hole Nozzle. (Left) Cylindrical, (Right) Tapered. [CN=4, Low Lift].... 323
Figure 6-31: Typical spray investigation image showing the regions used to measured the cone angle at two hole lengths from the outlet. ... 325
Figure 6-32: 2-D liquid probability of the Single Hole Nozzle with larger viewport. (a) Cylindrical, (b) Tapered [CN=4, Full Lift]... 325
Figure 6-33: Measured temporal variation (Top Row) and PDF distribution (Bottom Row) of upper, bottom and total spray angle for the Single Hole cylindrical Nozzle. a) 1-hole length @ original resolution, b) 1-hole length @ increased resolution and c) 2-hole length @ increased resolution.[CN=4, Full Lift]... 326
Figure 6-34: Projected on the 2-D viewing plane time averaged percentage liquid presence for the single-hole cylindrical nozzle with and without string cavitation [CN=4, Re=65,900, Nominal needle lift] ... 328
Figure 6-36: Subtraction between 2-D mean spray images for the single-hole nozzle, revealing: (a) effect of string cavitation in the cylindrical hole at Re=65,900 (b) effect of string cavitation in the tapered hole at Re=88,250 and (c) effect of geometric hole cavitation [CN=4, Nominal needle lift] ... 329
Figure 6-37: Mean spray angle (upper, bottom, and total) as a function of cavitation number for the one-hole and two-hole nozzles: (a) Cylindrical holes and (b) tapered holes (nominal needle lift). ... 331
Figure 6-38: Predicted vapour volume fraction and flow field on the hole exit cross section at two time instances, revealing the calculated temporal variation of cavitation distribution due to the different location of the nozzle volume vortex ... 332
Figure 6-39: Predicted nozzle hole exit maximum injection angle of the cylindrical single-hole nozzle (a) large-scale and (a) real-size. The velocity vectors indicate the direction of the liquid once injected from the injection hole ... 332
Figure 6-40: Comparison between the flow exit characteristics of the real-size and the large-scale single-hole nozzles (a) mean axial velocity, (b) mean vapour volume fraction, (c) vapour volume fraction standard deviation and (d) atomisation angle standard deviation. All scales are normalised with the maximum values. ... 333
Figure 6-41: Predicted spatial distribution of (a) maximum magnitude of spray injection angle and (b) mean vapour volume fraction for three out of the five injection holes of the cylindrical real-size five-hole injector. ... 334
Figure 6-42: Predicted spatial distribution of the standard deviation of the (a) maximum magnitude of spray injection angle and (b) mean vapour volume fraction for three out of the five injection holes of the cylindrical real-size five-hole injector ... 335
Figure 7-1: (a) 3-D CAD nozzle design of the VCO nozzle and (b) geometry of the injection hole. ... 339
Figure 7-2: Predicted normalised pressure distribution of the VCO nozzle inside the (a) cylindrical and (b) the tapered injection hole at two different needle lifts . ... 340
Figure 7-3: Measured and predicted VCO nozzle discharge coefficient as function of needle lift. ... 341
Figure 7-4: Sample representative images of cavitation structures formed in the injection hole of the VCO nozzle with grooved needle at three different needle lifts (a) cylindrical and (b) tapered hole, at the maximum Reynolds and cavitation numbers investigated. ... 343
Figure 7-5: Sequence of events showing the formation of string cavitation from cavitation bubbles formed at the top corner of the injection holes feeding the vortical structure present inside the injection hole of the VCO nozzle [Eq. Needle Lift=20µm, Re=38,000, CN=11.2]. ... 344
Figure 7-6: Sequence of events showing the formation of string cavitation originating from the air
downstream of the injection hole and developing upstream inside the injection hole of the VCO nozzle [Eq. Needle Lift=100µm, Re=65,000, CN=4.5] ... 345
Figure 7-7: (a) Instantaneous image and (b) time-averaged probability of string cavitation appearance between two adjacent injection holes and (c) SEM image (by courtesy of [161]) of cavitation erosion at the entry to the injection hole, believed to be caused by string cavitation. ... 346
Figure 7-8: Model predictions for the original VCO nozzle using slightly eccentric needle position. Calculations indicate (a) formation of a strong vortex formed in-between adjacent holes and (b) the vortex core inside the injection hole can be linked with the area where string cavitation has been observed. (by courtesy of [161]) ... 347
Figure 7-9: Effect of cavitation number of string cavitation structure inside the tapered injection hole of the VCO nozzle [Eq. Needle Lift=20µ, Re=38,000]. ... 348
Figure 7-10: Spatial extent and temporal development of string cavitation inside the injection hole of the VCO nozzle as function of Reynolds and cavitation numbers for 20 µm equivalent needle lift; colour according to normalised string diameter. ... 349
Figure 7-12: Effect of Reynolds and cavitation numbers on spatial probability of string cavitation location
[Eq. Needle Lift=20µ] ... 351
Figure 7-13: Effect of needle lift on spatial extent and temporal development of string cavitation inside the injection (a) Eq. Needle Lift=100µ, Re=66,000, CN≈11 and (b) Eq. Needle Lift=20µ, Re=38,000, CN≈11; colour according to normalised string diameter. ... 352
Figure 7-14: Effect of the needle lift on (a) string appearance along the hole length expressed as % of time and (b) normalised mean string diameter along the hole length... 353
Figure 7-15: Effect of needle lift on spatial probability of string cavitation location (a) Eq. Needle Lift=100µ, Re=66,000, CN≈11 and (b) Eq. Needle Lift=20µ, Re=38,000, CN≈11. ... 354
Figure 7-16: Flow map showing the normalised percentage hole area occupied by string cavitation as function of needle lift and cavitation number ... 354
Figure 7-17: 3D schematic of a) the transparent large-scale model of a sac-type Diesel nozzle and b) four different needle tip designs. ... 355
Figure 7-18: (a) picture of erosion damage of the needle and (b) erosion damage of the sac volume. (by courtesy of [161]) ... 356
Figure 7-19: Side view of Sac-type nozzle with needle design I at 20µm equivalent needle lift for a) CN =3, Re=23300, b) CN =15, Re=23,300 and c) CN =52, Re=38,200. ... 357
Figure 7-20: Typical bottom view images of the Sac-Type nozzle with needle design (I) at 20 µm equivalent needle lift... 360
Figure 7-21: time averaged images for needle seat cavitation in sac-type nozzle with needle tip design (I) for different flow conditions. [20µm Needle Lift] ... 361
Figure 7-22: Typical bottom view images of the Sac-Type nozzle with needle design (I) at 10 µm equivalent needle lift... 363
Figure 7-23: time averaged images for needle seat cavitation in sac-type nozzle with needle tip design (I) for different flow conditions. [10µm Needle Lift] ... 364
Figure 7-24: Injection pressure and needle lift diagram used for the real-size nozzle flow simulations for the sac-type nozzle... 365
Figure 7-25: Needle seat cavitation intensity frequency [Eq. Needle Lift=20µ CN=15, Re=23,300] ... 366
Figure 7-26: Needle seat cavitation intensity frequency [Eq. Needle Lift=20µ, CN=3, Re= 23,300] ... 366
Figure 7-27: Needle seat cavitation intensity frequency [Eq. Needle Lift=20µ, CN=19, Re=26,900] ... 367
Figure 7-28: Needle seat cavitation intensity frequency [Eq. Needle Lift=20µ, CN=10, Re= 26,900] ... 367
Figure 7-29: Needle seat cavitation intensity frequency [Eq. Needle Lift=20µ, CN=4, Re= 26,900] ... 368
Figure 7-30: Needle seat cavitation intensity frequency [Eq. Needle Lift=20µ, CN=27, Re= 33,200] ... 368
Figure 7-31: Needle seat cavitation intensity frequency [Eq. Needle Lift=20µ, CN=6, Re= 33,200] ... 369
Figure 7-32: Needle seat cavitation intensity frequency [Eq. Needle Lift=20µ, CN=52, Re= 38,200] ... 369
Figure 7-33: Needle seat cavitation intensity frequency [Eq. Needle Lift=10µ CN =15, Re=23,300] ... 371
Figure 7-34: Needle seat cavitation intensity frequency [Eq. Needle Lift=10µ, CN=3, Re= 8,500]... 371
Figure 7-35: Needle seat cavitation intensity frequency [Eq. Needle Lift=10µ, CN=19, Re= 11,300] ... 372
Figure 7-36: Needle seat cavitation intensity frequency [Eq. Needle Lift=10µ CN=4, Re= 11,300]... 372
Figure 7-37: Needle seat cavitation intensity frequency [Eq. Needle Lift=10µ, CN= 27, Re= 17,700] ... 373
Figure 7-38: Needle seat cavitation intensity frequency [Eq. Needle Lift=10µ, CN=6, Re= 17,700 ... 373
Figure 7-40: Side view of Sac-type nozzle with needle design IV at 10µm equivalent needle lift for CN =27,
Re=26900... 376
Figure 7-41: time averaged images for needle seat cavitation in sac-type nozzle with needle tip design (IV) for different flow conditions.[10 µm Needle Lift] ... 376
Figure 7-42: Typical bottom view images of the Sac-Type nozzle with needle design IV at 20 µm equivalent needle lift. ... 377
Figure 7-43: time averaged images for needle seat cavitation in sac-type nozzle with needle tip design (IV) for different flow conditions.[20 µm Needle Lift] ... 378
Figure 7-44: Needle seat cavitation intensity frequency [Eq. Needle Lift=10µm, CN= 15, Re= 13,500] ... 380
Figure 7-45: Needle seat cavitation intensity frequency [Eq. Needle Lift=10µm, CN= 19, Re= 19,800] ... 380
Figure 7-46: Needle seat cavitation intensity frequency [Eq. Needle Lift=10µm, CN= 4.0, Re= 19,800] ... 381
Figure 7-47: Needle seat cavitation intensity frequency [Eq. Needle Lift=10µm, CN= 27, Re= 26,900] ... 381
Figure 7-48: Needle seat cavitation intensity frequency [Eq. Needle Lift=10µm, CN= 6, Re= 26,900] ... 382
Figure 7-49: Needle seat cavitation intensity frequency [Eq. Needle Lift=20µm, CN= 19, ... 382
Figure 7-50: Needle seat cavitation intensity frequency [Eq. Needle Lift=20µm, CN= 10, Re= 28,300] ... 383
Figure 7-51: Needle seat cavitation intensity frequency [Eq. Needle Lift=20µm, CN= 27, Re= 32,500] ... 383
Figure 7-52: Needle seat cavitation intensity frequency [Eq. Needle Lift=20µm, CN= 6, Re= 32,500] ... 384
Figure 7-53: Needle seat cavitation intensity frequency [Eq. Needle Lift=20µm, CN= 52, Re= 35,300] ... 384
Figure 7-54: Typical bottom view images of the Sac-Type nozzle with needle design II at 10 µm equivalent needle lift. ... 386
Figure 7-55: Typical bottom view images of the Sac-Type nozzle with needle design II at 15 µm equivalent needle lift. ... 387
Figure 7-56: Typical bottom view images of the Sac-Type nozzle with needle design II at 20 µm equivalent needle lift. ... 388
Figure 7-57: figure showing trapped vapour inside the sac-volume of the nozzle attached to the needle tip (design III) a) [CN=15, Re=3,000] and b) [CN=15, Re=8000] ... 389
Figure 7-58: 3-Dimensional reconstruction of needle seat cavitation at 20 µm equivalent needle lift for needle design I. ... 390
Figure 7-59: 3-Dimensional reconstruction of needle seat cavitation at 20 µm equivalent needle lift for needle design IV... 391
Figure 7-60: 3-Dimensional reconstruction of needle seat cavitation at 20 µm equivalent needle lift for needle design III. ... 391
Figure 7-61: Sequence of events showing the formation of string cavitation originating from an injection hole and developing sideways inside the adjacent injection hole of the Sac-Type nozzle [Eq. Needle Lift=300µ, Re=44,500, CN=12] ... 392
Figure 7-62: Typical images showing the formation of string cavitation from the side view Sac-Type nozzle [Eq. Needle Lift=300µm, Re=44,500, CN=12] ... 393
Figure 7-63: Averaged images for Vortex cavitation in sac-type nozzle with needle tip design (I) for different flow conditions. [50 µm equivalent needle lift] ... 394
Figure 7-64: Typical bottom view images showing string cavitation structures inside the sac-type nozzle with needle design I [Eq. Needle Lift=50µm] ... 395
Figure 7-65: Averaged images for Vortex cavitation in sac-type nozzle with needle tip design (I) for different flow conditions. [300 µm equivalent needle lift] ... 397
Figure 7-67: Averaged images for Vortex cavitation in sac-type nozzle with needle tip design (III) for different flow conditions. [150 µm equivalent needle lift] ... 398
Figure 7-68: Averaged images for Vortex cavitation in sac-type nozzle with needle tip design (III) for different flow conditions. [300 µm equivalent needle lift] ... 399
Figure 7-69: Averaged images for Vortex cavitation in sac-type nozzle with needle tip design (IV) for different flow conditions. [50 µm equivalent needle lift] ... 400
Figure 7-70: Averaged images for Vortex cavitation in sac-type nozzle with needle tip design (IV) for different flow conditions. [150 µm equivalent needle lift] ... 401
Figure 7-71: Averaged images for Vortex cavitation in sac-type nozzle with needle tip design (IV) for different flow conditions. [300 µm equivalent needle lift] ... 403
Figure 7-72: comparison between a) region of high swirl intensity (cyan) and b) experimentally obtained strings for the sac-type nozzle with needle design IV at 300µm equivalent needle lift [CN: 15, RE: 67,100]404
Figure 7-73: comparison between a) region of high swirl intensity (yellow) and b)experimentally obtained probability of strings for the sac-type nozzle with needle design IV at 300µm equivalent needle lift [CN: 15, Re: 62,200]. ... 405
Figure 7-74: Predicted flow field inside sac-type nozzle with needle design I at 300µm equivalent needle lift along with a typical reconstructed string (cyan, side-view) and predicted regions of volume under tension (magenta) [CN: 15, RE: 67,100] ... 406
Figure 7-75: Predicted flow field inside sac-type nozzle with needle design I at 300µm equivalent needle lift along with a typical reconstructed string (cyan, front-view) and predicted regions of high swirl intensity (green) [CN: 15, RE: 67,100] ... 406
Figure 7-76: Predicted flow field inside sac-type nozzle with needle design IV at 300µm equivalent needle lift along with all reconstructed strings obtained between the monitored holes (gray, front-view) [CN: 15, Re: 62,200]. ... 407
List of Tables
Table 1-1: European emissions standards for Diesel passenger cars and Light commercial vehicles ... 40
Table 4-1: Properties of the Diesel Fuel Used for Real-Size simulations ... 151
Table 4-2: Summary of calculated parameters for Needle Lift Effect ... 156
Table 4-3: Summary of calculated parameters for Conceptual Nozzle Designs Vs Standard Design ... 168
Table 4-4 Summary of calculated parameters for Conceptual Nozzle Designs Vs Standard Design (2) ... 179
Table 5-1: Flow conditions inside the large-scale cylindrical marine model nozzle and representative results for hole 5 side and bottom views. ... 210
Table 5-2: Flow conditions inside the large-scale cylindrical marine model nozzle and representative results for hole 5 side and bottom sac volume view. [Full Lift] ... 211
Table 5-3: Flow conditions inside the large-scale cylindrical marine model nozzle and representative results for hole 1 side and bottom sac volume view. ... 212
Table 5-4: Flow conditions inside the large-scale cylindrical marine model nozzle and representative results for hole 1 side and bottom view. ... 213
Table 5-5: Flow conditions inside the large-scale cylindrical marine model nozzle and representative results for bottom sac volume view. ... 214
Table 5-6: Flow conditions inside the large-scale cylindrical marine model nozzle and representative results for bottom sac volume view. [80% needle lift] ... 215
Table 5-7: Flow conditions inside the large-scale cylindrical marine model nozzle, with air bubble seeding, and representative results for bottom sac volume view. ... 216
Table 5-8: Flow conditions inside the large-scale cylindrical and tapered single-hole marine model nozzle. 271
Table 6-1: Range of operating conditions for all L-S nozzles investigated ... 288
Table 6-2: Flow and visualization conditions used with the R-S model nozzle and representative results. .... 291
Table 7-1: Range of operating conditions investigated for the transparent VCO type nozzle with tapered holes. ... 342
Table 7-2: Range of operating conditions investigated for the transparent sac-type nozzle ... 356
Table 7-3: Range of operating conditions investigated for the transparent sac-type nozzle with needle design I at 20 µm equivalent needle lift. ... 359
Table 7-4: Range of operating conditions investigated for the transparent sac-type nozzle with needle design (I) at 10 µm equivalent needle lift. ... 362
Table 7-5: Range of operating conditions investigated for the transparent sac-type nozzle with needle design IV at 10 µm equivalent needle lift... 374
Table 7-6: Range of operating conditions investigated for the transparent sac-type nozzle with needle design IV at 20 µm equivalent needle lift... 374
Table 7-7: Range of operating conditions investigated for the transparent sac-type nozzle with needle design II at 10 µm equivalent needle lift. ... 385
Table 7-8: Range of operating conditions investigated for the transparent sac-type nozzle with needle design II at 15 µm equivalent needle lift. ... 385
Table 7-9: Range of operating conditions investigated for the transparent sac-type nozzle with needle design II at 20 µm equivalent needle lift. ... 385
Table 7-11: Range of operating conditions investigated for the transparent sac-type nozzle with needle design I at 300 µm equivalent needle lift. ... 396
Table 7-12: Range of operating conditions investigated for the transparent sac-type nozzle with needle design III at 50 µm equivalent needle lift. ... 397
Table 7-13: Range of operating conditions investigated for the transparent sac-type nozzle with needle design III at 150 µm equivalent needle lift. ... 398
Table 7-14: Range of operating conditions investigated for the transparent sac-type nozzle with needle design III at 300 µm equivalent needle lift. ... 399
Table 7-15: Range of operating conditions investigated for the transparent sac-type nozzle with needle design IV at 50 µm equivalent needle lift. ... 399
Table 7-16: Range of operating conditions investigated for the transparent sac-type nozzle with needle design IV at 150 µm equivalent needle lift. ... 401
Acknowledgements
Firstly, I would like to thank my supervisor, Dr. M. Gavaises, for his continuous professional and human support during the time towards the completion of my PhD. Furthermore, I am very grateful that he provided the opportunities, the freedom and the funding needed to pursue this research work as well as for widening my knowledge and expertise in areas different than cavitation. I am sure, that although he never liked my ‘last minute’ theory, we both managed our way towards a successful outcome.
I would also like to thank to my second supervisor, Professor C. Arcoumanis, for his support, guidance, ideas, and help with my research. Moreover, I would to thank him for giving the extra “push” forward to finish with my thesis when my motivation had started abandoning me.
In addition, I would like to warmly thank Dr. A. Theodorakakos for his support, help and patience all this time that I was ‘experimenting’ with the GFS code for my CFD simulations. Moreover, I would like to thank him and Fluid Research Co. for providing the precious computational resources needed.
I would also like to say a big thank you to Dr. J.M. Nouri, for his assistance, help and support on my experimental investigations as well as for his continues interest on my research outcomes and progress
For their technical support and help I thank Mr. J. Ford and Mr. T. Flemming. Without them everything would have been much more difficult or even impossible. For the same reasons I would also like to thank Dr. W.D. Gunawardana, Mr. J. Kenny and Mr. I. Wright.
Furthermore, I would like to thank Dr. D. Bouris for showing me the first steps into mesh generator software. Also, for the exchange of insight into various interesting numerical, theoretical and experimental issues, I would like to thank Dr. S. Tonini and Dr. H. Roth. Also, the help and assistance of Dr. N. Mitroglou and Dr. A. Marchi in the beginning of my experimental work as well as the useful discussions we had are highly appreciated. Thank you both guys!
A big and warm thank you goes also to my other friends and colleagues from the research group at City for being around and for helping me in one way or the other: Dr. P. Dellis, Dr. A. Dhunput, Mr. M. Hamid, Dr. J. Kashdan, Mr. K. Kinoshita, Mr. L. Liverani, Mr. K. Mori, Dr. T. Ous, Dr. S. Petropoulou and Mr. K. Wang.
Additionally I would like to thank Dr. E. Giannadakis, Dr. D. Papoulias and Ms. M. Spathopoulou for their help and support as colleagues as well as for being always on my side as friends. I would like you to know that many times you three gave me the missing courage to keep on walking.
like to thank Dr. G. Strotos for flooding our cold office with warm melodies coming from his radio; always tuned at ERA2 103.7fm (our favourite station).
At this point, I would like to say a warm thank you to Mr. S. Hatzigrigoris. Through his deep knowledge on marine diesel engines as well as been always interested on new research and technical improvement, he provided the link for sponsorship by the relative industry leader company and always provided the necessary help and support whenever it was needed. Moreover, I want to thank Mr. D. Styllianou, for providing me his house in London, for guiding me through my first steps abroad and for showing me what London can offer in order to make my stay more enjoyable.
I would like to acknowledge the financial support of MAN Diesel (ex. MAN B&W), who funded the first three years of my research work on marine fuel nozzles; in this context I would like to warmly thank and express my gratitude to Mr. D. Tsalapatis, for his personal interest in our research and ongoing collaboration. In the same spirit, I would like to thank CATERPILLAR, for the financial support of second part of my work with multi-hole Diesel injectors. ; in this context I would like to warmly thank Mr. A. Stockner and Mr. D. Ibrahim, for their interest in our research and ongoing collaboration.
A huge ‘thank you’ goes to the owner of G.M.T.H workshop in Piraeus, Greece, Mr. G. Kouvoutsakis. Without his personal interest and willing to sacrifice highly profitable ordinary production in order to make the precise and delicate job of nozzle model manufacture most parts of this work would have been impossible. Among his entire crew that showed interest to help on making these difficult pieces, I want to particularly thank Mr S. Beltzinitis and Mr. D. Kladis for providing all their experience, technique, knowledge, personal time and piece in order to manufacture the nozzles under time pressure and various uncontrollable situations. Thank you both!
Finally, on a personal level, I would like to thank my good friends Elena, Antonis, Semmy, Anastasia and Angelos for been next to me all these years. In addition, I would like deeply thank my cousins Dimitris and Giorgos for supporting me in various ways and for been my companion and advisors when stress levels were overtaking me. Moreover, a warm ‘thank you’ goes to my beloved Despina for reminding me that there are achievements that go beyond calculations and experiments.
Finally, I want to thank those that made me what I am. Those that always put my personal welfare and progress above their own lives. Those that flooded me with their loving support and took care of everything else in order for me to be solely concentrated on my research. My loving family! My mother Mary, my aunt Christina, my grandmother Violetta and my grandfather Diamantis who left before seen my work completed. Particularly for my aunt Christina, I want to mention that without her been with me during all these years in London, by putting aside her personal life to become my guardian angel, I would not have been able to do anything. Τακαταφέραµε!
Declaration
I hereby declare that the presented work in this thesis is my own or was developed in a joint effort with other members of the research group as it is stated and referenced in the text accordingly!
I grant powers of discretion to the University Librarian to allow this thesis to be copied in whole or in part without further reference to me. This permission covers only single copies made for study purposes, subject to normal conditions of acknowledgement.
London,
Abstract
The fuel injection system is considered among the most important components controlling engine’s performance and exhaust emissions. The fuel nozzle is the component that determines to a large extend the structure of the emerging liquid spray. Cavitation forming inside Diesel injection nozzles enhances the break-up of the fuel and this results to better atomization. In order to establish the link between complex cavitation structures developing inside Diesel nozzles and their effect to the emerging spray, a series of experimental investigations were carried out along with the aid of RANS numerical simulations.
Two distinct types, based on the engine to be used, of nozzles were manufactured and investigated; a) nozzles used with large low-speed two-stroke marine Diesel engines and b) multi-hole nozzles used with automotive or heavy duty Diesel engines.
Different nozzle geometries were considered and large scale transparent model were manufactured in order to allow optical access inside the nozzle. Both cylindrical and tapered holed nozzles were fabricated in order to allow for hole cavitation effects to be investigated in detail.
The experiments included extensive digital imaging of the different cavitation structures developing in the injection holes, the dynamic or ‘string’ cavitation forming in the nozzle sac volume and the ‘needle-seat’ cavitation. Moreover, the near hole exit spray formation was also visualized in direct link with the nozzle’s internal cavitating flow regimes.
CFD simulations showed that strong vortical structures exist in both marine nozzle sac volume and injection holes. The same was identified for multihole Diesel nozzle. In all times the pressure values at the core of the identified vortexes were only slightly decreased compared to the surrounding area. After comparison with experimental results it was proved that CFD simulations could accurately predict the internal nozzles flow and recirculation zones location variation with time.
factors that affect string cavitation. Similar findings were recorded also for multihole Diesel nozzles.
Visualization of the emerging near-hole exit spray structure along with nozzle internal flow for the marine injector revealed that string cavitation entering an injection hole can cause an increase of almost 20 degrees on the spray cone angle as well as a downward deflection of its direction.
In the multi-hole nozzle it was identified that hole-to-hole string cavitation is linked with metal parts erosion after comparing with SEM images. Moreover in the multi-hole nozzles, for low needle lifts and after comparing again with SEM images it was shown that needle seat cavitation is also linked with erosion of the metal parts.
With the aid of numerical simulations the pressure field, as well as the flow structure inside the investigated nozzles was identified and combined with digital image processing. A 3-D reconstruction method was developed and allowed correlation of the experimentally recorded vapour structures with the vortical flow developing inside the nozzle as well as the volume under tension. Out of this comparison it was found that strings are formed in the core of the recirculation areas. Also, for needle seat cavitation it was found that cavitation sites lye across region of volume under tension.
Investigation of nozzles with tapered, outwards converging holes, and combination with numerically identified flow field revealed that although recirculation zones exist strings are not formed. This finding along with experiments using air bubbles introduced in the flow field, showed that strings are formed by vapour from existing cavitation sited (hole cavitation) that is captured and transferred inside the strong vertical flow core.
Finally, for hole cavitation free tapered marine spraying nozzles, it was found that strings can form by trapped ambient air that is sacked inside the nozzle from the hole exit plane due to the strong vortex existing in the injection hole. Interestingly enough it was found that strings were developing in the opposite direction of the hole flow, travelling from the hole exit plane all the way upwards until they reach the sac volume. Similar results were also recorded for the multi-hole nozzles revealing the mechanism of string formation.
1) Investigation on nozzles used in large two-stroke slow speed marine Diesel engines. 2) Quantitative analysis of string cavitation formation and characteristics along with
simultaneous visualization of its effects on the internal nozzle flow and near hole exit spray structure.
3) Combined internal nozzle flow and spray structure investigation in enlarged transparent nozzle replicas with tapered holes and inlet rounding.
4) Mechanism of string cavitation formation in outwards converging tapered hole nozzles without geometric cavitation.
5) 3-D reconstruction of experimentally obtained string cavitation regimes and comparison with the local flow field obtained by CFD calculations.
6) Qualitative and quantitative analysis of needle seat cavitation and its link with erosion. Identification of string cavitation as a mechanism of erosion of the metal parts.
7) 3-D reconstruction of needle seat cavitation sites and comparison with the local flow field obtained by CFD calculations.
The aforementioned aspects will provide the future researcher with valuable results and conclusions in order to promote understanding of the complex phenomenon of cavitation.
![Figure 1-1: Relative fraction of man-made GHGs per category. [According to Emission Database for Global Atmospheric Research (2000)]](https://thumb-us.123doks.com/thumbv2/123dok_us/1616657.114691/39.595.57.487.74.358/relative-fraction-category-according-emission-database-atmospheric-research.webp)
![Figure 1-3: CO2Environment Agency) Emissions in transport according to [4].(presented by European](https://thumb-us.123doks.com/thumbv2/123dok_us/1616657.114691/45.595.67.483.198.399/figure-environment-agency-emissions-transport-according-presented-european.webp)
![Figure 1-6: Cross section of MAN B&W K98MC-C Two-Stroke slow speed Diesel engine. [courtesy of [10]](https://thumb-us.123doks.com/thumbv2/123dok_us/1616657.114691/54.595.141.529.80.635/figure-cross-section-stroke-speed-diesel-engine-courtesy.webp)
![Figure 2-3: Effect of injection time on hole-to-hole spray variations for a 5-hole VCO nozzle (a & b) [Pinj=140 MPa, Pback=1MPa]](https://thumb-us.123doks.com/thumbv2/123dok_us/1616657.114691/72.595.155.499.328.628/figure-effect-injection-spray-variations-nozzle-pinj-pback.webp)