Diffusion
Philip Shapira
Jan Youtie
Debbie Cox
Elvira Uyarra
Abullah Gök
Juan Rogers
Chris Downing
IDB-TN-832
Institutions for
Development Sector
Competitiveness and
Innovation Division
Philip Shapira
Jan Youtie
Debbie Cox
Elvira Uyarra
Abullah Gök
Juan Rogers
Chris Downing
Manchester Institute of Innovation Research, Manchester Business School, University
of Manchester
Institutions for technology diffusion / Philip Shapira, Jan Youtie, Debbie Cox,
Elvira Uyarra, Abullah Gök, Juan Rogers, Chris Downing
p. cm. — (IDB Technical Note ; 832)
Includes bibliographic references.
1. Technological innovations—Canada. 2. Technological innovations—Europe.
3. Technological innovations—Latin America. 4. Diffusion of innovations—
Canada. 5. Diffusion of innovations—Europe. 6. Diffusion of innovations—
Latin America. 7. Technology transfer—Canada. 8. Technology transfer—
Europe. 9. Technology transfer—Latin America. I. Shapira, Philip. II. Youtie,
Jan. III. Cox, Debbie. IV. Uyarra, Elvira. V. Gök, Abullah. VI. Rogers, Juan. VII.
Downing, Chris. VIII. Inter-American Development Bank. Competitiveness
and Innovation Division. IX. Series.
IDB-TN-832
Copyright © Inter-American Development Bank. This work is licensed under a Creative Commons IGO 3.0 Attribution-NonCommercial-NoDerivatives (CC-IGO BY-NC-ND 3.0 IGO) license (http://creativecommons.org/ licenses/by-nc-nd/3.0/igo/legalcode) and may be reproduced with attribution to the IDB and for any non-commercial purpose. No derivative work is allowed.
Any dispute related to the use of the works of the IDB that cannot be settled amicably shall be submitted to arbitration pursuant to the UNCITRAL rules. The use of the IDB's name for any purpose other than for attribution, and the use of IDB's logo shall be subject to a separate written license agreement between the IDB and the user and is not authorized as part of this CC-IGO license.
Note that link provided above includes additional terms and conditions of the license.
The opinions expressed in this publication are those of the authors and do not necessarily reflect the views of the Inter-American Development Bank, its Board of Directors, or the countries they represent.
http://www.iadb.org
Abstract
*This technical note analyzes international experiences and practices of public technology extension service programs. Technology extension services comprise varied forms of assistance provided directly to enterprises to foster technological modernization and improvement, with a focus on established small and mid-sized enterprises. The note discusses the definitions, rationales, and characteristics of selected technology extension service programs, drawing on examples from Europe, North America, and other regions. It presents four detailed case studies: the U.S. Manufacturing Extension Partnership; the National Research Council-Industrial Research Assistance Program in Canada; England’s Manufacturing Advisory Service; and Tecnalia, an applied technology organization in Spain. The case studies address several program elements including the history and evolution of the program, structure, program scale, financing structure, services and clients, governance, personnel, monitoring, and evaluation. The analysis highlights common and distinctive characteristics as well as program strengths, weaknesses, and key practices. The note provides a framework for positioning technology extension services within the broader mix of policies for technology transfer, business upgrading, and innovation, and offers conclusions and insights to support efforts to strengthen technology extension services in Latin America.
JEL codes: L6, O2, P5
Keywords: technology extension; technology diffusion; industrial extension; technology centers; small and medium-size enterprise; SMEs; institutions; policies; programs
* The project team gratefully acknowledges the time and assistance provided to by program staff and agents
Contents
1. Introduction ... 1
2. Technology Extension Services ... 2
3. Overview of Case Studies ... 17
4. U.S. Manufacturing Extension Partnership ... 20
5. The Industrial Research Assistance Program in Canada ... 50
6. The Manufacturing Advisory Service in England ... 65
7. Tecnalia, Basque Region, Spain ... 85
8. Lessons and Insights ... 100
The objective of this technical note is to analyze the international experiences and good practices of public technology extension service (TES) programs. The note begins with a discussion of the definition of TES, addressing key perspectives on providing services to small and medium-sized enterprises (SMEs), rationales for TES intervention, and selected characteristics of TES programs. The note explicitly gives a definition of TES and distinguishes it from other services (i.e., what TES is not), and draws on examples of programs from Europe, North America, and other regions.
2.
Technology Extension Services
This section reviews the scope, justification, and characteristics of technology extension services (TES), drawing on available literature and documentation. The review addresses four key areas: (i) scope and definition, (ii) rationale and market failures, (iii) basic program characteristics, and (iv) policy mix and institutional setting. It draws on selected key literature with relevance to TES from diverse global perspectives.
2.1. Defining TES
Technology extension service (TES) is defined as assistanceprovided directly to enterprises to foster technological modernization and improvement, with a focus on established SMEs. Although the literature on small business assistance is extensive, the literature on TES programs is more specific and bounded. Bellini (2003) refers to a diversity of potentially relevant terms for the former, which include but go beyond TES: business support services, business development services, industrial and manufacturing assistance services, external assistance or external advice. Bellini distinguishes these as “real services” in that they engage in activities directly with companies that transfer knowledge and stimulate learning using nonfinancial means, enabling innovation and economic development. In contrast, indirect assistance—such as tax credits—supports firms but does not directly engage with them.
looking, and for focusing on the immediate rather than longer-term opportunities. TES straddles these two idealized models. On the one hand, unlike supply-push, TES reaches out to businesses to ensure a connection between technology and the needs of business. On the other hand, it also gives importance to strategic trends in both hard and soft technologies and techniques to encourage and support businesses, especially SMEs, to have sufficient confidence and capacity to adopt these practices.
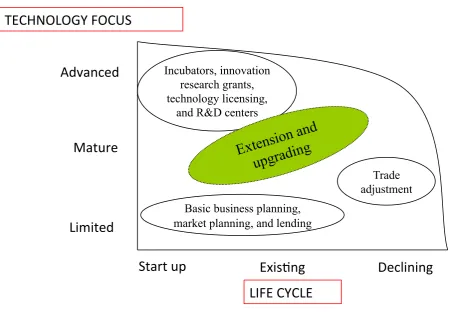
Figure 1. Positioning of Technology Extension Services
Source: Authors’ elaboration.
The differentiation of technological extension is not necessarily cut and dried around a particular set of services. By way of illustration, some of the excellent TES programs have found it best practice to link shop floor productivity services (which are at the core of TES) to business and marketing efforts (which are at the core of basic business assistance). The framework included in the study indicates that technology extension falls between basic business assistance (i.e., basic business planning and basic marketing) and sales planning and high-end R&D (i.e., startup incubators, technology transfer offices, and science centers of excellence). In short, TES should be situated in a middle position as they are aimed at improving the performance of the companies.
In considering the scope of TES, it is important to bear in mind what technology extension is not. TES is not just about technology transfer from labs to firms but rather about systemic measures to improve firms’ technological performance. It is not just about advanced technology but rather about pragmatic improvements in operations and practices, usually with commercially proven technologies. It is not a short-term jobs program as results will take time to materialize and require sustained efforts and some direct jobs may even be lost as productivity increases. It is not just a government program but rather a process that is driven by industry needs and market opportunities and leverages existing resources. It is not
Start%up
Exis,ng
Declining
LIFE%CYCLE
Advanced
Mature
Limited
Basic business planning, market planning, and lending Incubators, innovation
research grants, technology licensing,
and R&D centers
Trade adjustment
Extens
ion a
nd
upgra
ding
a resolution to crisis or radical economic transition, as it requires a reasonably stable industrial base (Shapira, 2001).
TES also may be characterized in terms of a set of service offerings (Box 1). These services can be grouped into the following categories:
• Providing information to an SME in response to a problem
• Sharing and comparing of practices within an industry or across industries • Engaging in in-depth projects through technical assistance or consultancy to
address problems
• Helping SMEs identify and utilize third party providers (i.e., brokering) for
certain types of services, including financing resources
• Leading training programs to disseminate knowledge mostly to company
managers but also to nonmanagerial employees
• Working with groups of companies from different industries or within a given
supply chain
• Linking and coordinating collaborative projects involving multiple firms • Giving ongoing coaching and mentoring for strategy development
• Encouraging the take-up of growth services that will eventually lead to new or
improved product and market development
There are other services that can complement typical TES offerings; these services are frequently focused on infrastructure such as for testing and machining on nontechnological needs related to human resources, accounting, and financing assistance.
Box 1. Typical and Related TES Services
TYPICAL TES SERVICES
• Information provision
• Benchmarking and assessment
• Technical assistance or consultancy
• Referral, links with finance
• Training
• Group or network services; supply chain
development
• Collaborative projects (R&D,
implementation)
• Strategy development; coaching and
mentoring
• Growth services
RELATED SERVICES
• Testing, finite element analysis
• Machining
• Modeling and simulation
• Rapid prototyping, additive manufacturing,
3D printing
• Machine and equipment design
• Computer-aided design
• Bar coding, RFID
• Incubator, accelerator
• Technology transfer
• Intellectual property searching
• Human resource programs (basic, technical
skills training)
• Recruitment
• Accounting, business valuation, trusts
• Funding for technology, capital, training, etc.
• Export assistance
• Computer hardware/network systems (e.g.,
operating systems, LAN, communications, computer networks)
• Website, e-commerce (e.g., search engine
optimization, traffic monitoring, site mapping, re-design)
Source: Authors’ elaboration.
Technology extension service is incompletely defined by a particular set of services alone. It can also be viewed as a set of activities that leverages tacit knowledge built up throughout the careers of TES professionals. This tacit knowledge is made available to SMEs through a locally distributed network and has the ability to address particular problems brought to the program by the local manufacturing facility in a demand-pull fashion (although the program may use follow-on project opportunities to encourage the adoption of the aforementioned services).
2.2. Rationale
for SMEs to universities, national laboratories and technology centers focused on research missions and high-end technologies, and existing government programs focused on economic development or generic nontechnological services.
TES programs vary in the ways in which they link the broad market and system level failure concerns with their particular program objectives. For instance, field service programs such as the Manufacturing Extension Partnership (MEP) in the United States and the Manufacturing Advisory Service (MAS) in the United Kingdom exemplify services, which address the information and market failures in markets for technology related services. Other programs such as the Industrial Research Assistance Program (IRAP) in Canada also use this justification but further address market failures related to underinvestment in innovation by firms.
There are also strategic concerns associated with economic competitiveness. Many countries have de-emphasized manufacturing, as their large corporations focused on core competencies, particularly in financial services. The economic downturn of the late 2000s demonstrated the need for rebalancing, a greater focus on manufacturing, and more of an emphasis on exporting. As a result, many developed countries have initiated major efforts to enhance the manufacturing ecosystem and increase support for advanced manufacturing. Furthermore, new rounds of technological growth are anticipated around supply chains and regional clusters to foster local and regional economic development.
Finally, recent technological and systemic trends create challenges as well as opportunities for SMEs. These trends include vertical disintegration; flexible specialization; the increasing presence of open markets; globalization and offshoring to low-cost but technologically capable competition; shifts from economies of scale to economies of scope; and new, open approaches to innovation (Caputo et al., 2002; López-Estornell et al. 2012; Mas-Verdu, Vaviera-Puig, and Martinez-Gomez, 2008; Shapira, 2001).
2.3. Organizing TES
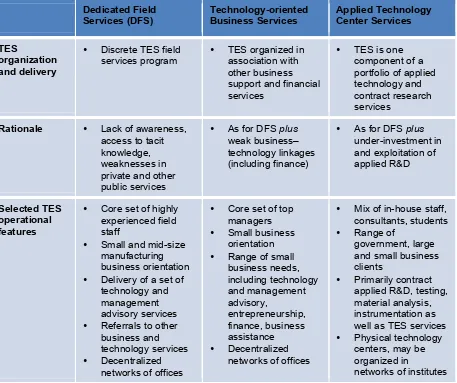
There are a range of approaches for organizing TES around the common theme of providing direct services to enterprises, fostering technological modernization and improvement. These various approaches reflect differences among countries in industrial structure, the landscape of existing services, institutional capabilities, and policies. While every program has some distinctive elements, we can identify three primary broad ways through which TES is organized and delivered: (i) dedicated field services, (ii) technology-oriented business services, and (iii) applied technology centers (see also Table 1).
management structures, staffing, funding, and branding. The underlying rationale for establishing such programs typically relates to market and other system failures, including lack of enterprise awareness of new technologies, access to tacit knowledge, and weaknesses in other private and other public services (as discussed in Section 2.2). Dedicated field services usually provide referrals to other programs and services where, for example, enterprises can obtain financial, applied research, or further private consulting assistance.
Table 1. Approaches to Organizing Technology Extension Services (TES)
Dedicated Field Services (DFS) Technology-oriented Business Services Applied Technology Center Services TES organization and delivery
• Discrete TES field
services program •
TES organized in association with other business support and financial services
• TES is one
component of a portfolio of applied technology and contract research services
Rationale • Lack of awareness, access to tacit knowledge, weaknesses in private and other public services
• As for DFS plus
weak business– technology linkages (including finance)
• As for DFS plus
under-investment in and exploitation of applied R&D
Selected TES operational features
• Core set of highly
experienced field staff
• Small and mid-size
manufacturing business orientation • Delivery of a set of
technology and management advisory services
• Referrals to other
business and technology services
• Decentralized
networks of offices
• Core set of top
managers
• Small business
orientation
• Range of small
business needs, including technology and management advisory, entrepreneurship, finance, business assistance
• Decentralized
networks of offices
• Mix of in-house staff,
consultants, students
• Range of
government, large and small business clients
• Primarily contract
applied R&D, testing, material analysis, instrumentation as well as TES services
• Physical technology
centers, may be organized in
networks of institutes Source: Authors’ elaboration.
Technology-oriented business services may provide start-up assistance to new ventures as well as working with established SMEs.
A third approach is to provide TES in the context of an applied technology center. In this organizational format, TES is one component of a portfolio of applied technology and contract research services that the center offers. Applied technology and research centers have physical facilities that may include laboratories and equipment, and their staff profile will include researchers as well as staff (who may or may not be research active) who provide TES advice and consultancy directly to firms. Technology-oriented business services and applied technology centers each have their own particular rationales, but the TES components of each of these two broader services have rationales that are similar to those of dedicated field services.
2.3.1. Dedicated Field Services
A dedicated field services approach uses experienced technology specialists, often with engineering and industrial expertise, to work with SMEs. This work is usually accomplished in a decentralized manner, including through direct engagement at the company location, to address its technical and business needs. Dedicated field services programs have their own identities, management, funding, and staff, although they coordinate with and refer to other business, applied research, training, and consultancy programs and services. Two examples of this approach are the MEP in the United States and the MAS in the United Kingdom (Table 2).
The U.S. MEP is a decentralized program delivering TES to manufacturing SMEs through a system of 60 centers. The National Institute of Standards and Technology (NIST) administers the program. NIST provides one-third of the funding for these centers, which they must match with two-thirds from with nonfederal sources. The centers provide a pragmatic set of services related to process improvement, product development, marketing, energy, environmental, and human resources. Most also connect manufacturing SMEs with other private and public assistance sources.
The MAS is a government program providing business support to manufacturers in England.1 The program is overseen by the UK Department for Business, Innovation and Skills and is managed by a consortium of private consulting firms in four large English regions. At the heart of the program are 120 highly experienced field specialists who offer strategic support, process efficiency, and commercialization services to manufacturers.
1 Economic development and business support are among the devolved functions within the UK. In Scotland, the
Justifications for a dedicated field services approach include concerns about the lack of awareness of pragmatic technologies and techniques and the importance of tacit knowledge to adopt these practices. In addition to these market failures, a dedicated field services approach to TES is likely to emerge where there are concerns about public or system failures by existing institutions (such as universities or established small business programs) to support technological upgrading in SMEs.
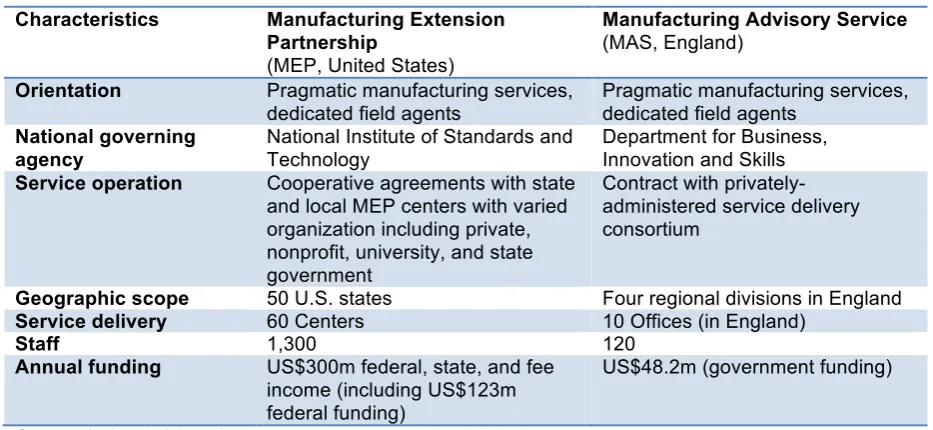
[image:15.595.65.532.354.569.2]The MEP and MAS share several operational characteristics: a core set of highly experienced field staff, a manufacturing orientation, delivery of a set of services that resonate with manufacturing SMEs, and a decentralized network of offices. The MEP is a partnership between federal and state governments whereas the MAS is centrally funded by the national government. The MAS has an explicit structure to involve the private sector in the management of its centers and in making referrals to clients, whereas the MEP uses a flexible range of approaches for service delivery.
Table 2. Selected Programs Using Dedicated Field Services
Characteristics Manufacturing Extension Partnership
(MEP, United States)
Manufacturing Advisory Service
(MAS, England)
Orientation Pragmatic manufacturing services, dedicated field agents
Pragmatic manufacturing services, dedicated field agents
National governing agency
National Institute of Standards and Technology
Department for Business, Innovation and Skills
Service operation Cooperative agreements with state and local MEP centers with varied organization including private, nonprofit, university, and state government
Contract with privately-administered service delivery consortium
Geographic scope 50 U.S. states Four regional divisions in England
Service delivery 60 Centers 10 Offices (in England)
Staff 1,300 120
Annual funding US$300m federal, state, and fee income (including US$123m federal funding)
US$48.2m (government funding)
Source: Authors’ elaboration.
2.3.2. Technology-oriented Business Support
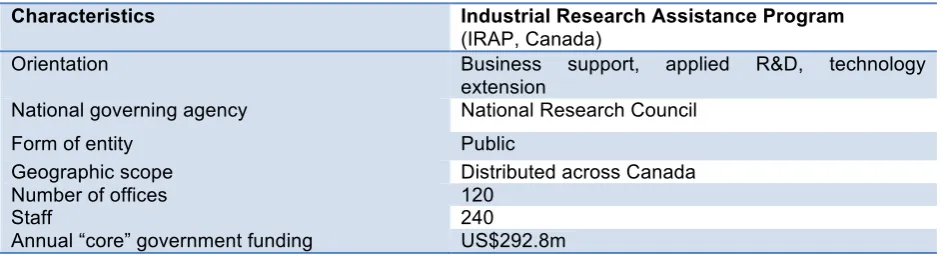
work with companies, offers funding for applied R&D projects to SME clients and collaborates with partner organizations to provide services to entrepreneurs.
Table 3. Selected Technology-oriented Business Support Program
Characteristics Industrial Research Assistance Program
(IRAP, Canada)
Orientation Business support, applied R&D, technology
extension
National governing agency National Research Council
Form of entity Public
Geographic scope Distributed across Canada
Number of offices 120
Staff 240
Annual “core” government funding US$292.8m
Source: Authors’ elaboration.
2.3.3. Applied Technology Centers
Applied technology centers perform contract R&D for companies and other types of organizations; general manufacturing and advisory services are also provided to complement this R&D support. These TES services might be offered under a contract with a state or local government to SMEs in the region. Public support for applied technology centers usually aims to address underinvestment in, and exploitation, of applied R&D. Five examples of applied technology centers are: the Fraunhofer-Gesellschaft (Germany), the Industrial Technology Research Institute (ITRI) (Taiwan), Public Industrial Technology Research Institutes also known as Kohsetsushi centers (Japan), Carnot Institutes (France), and Tecnalia (Basque region, Spain) (Table 4).
between France’s basic research capabilities and industrial needs. The Carnot Institutes share some features of the Fraunhofer program in that Carnot emphasizes contract research with industry. Tecnalia is another Fraunhofer-style program that offers technology services, collaborative R&D, exploitation of research through licensing and spinoffs, and services for organizational innovation and business diversification through 10 centers located throughout the region.
[image:17.595.67.532.355.662.2]Across these programs, the ITRI performs the most high-end research oriented toward the creation of new industries. Tecnalia and Kosetsushi tend to do more basic applied R&D in areas such as testing and materials analysis and Kosetsushi incorporates field specialists who meet with SMEs across their program. Fraunhofer has a strong customized R&D track record that is contract research driven. Carnot is more focused on developing linkages between research and industry. Within this category, our work focuses on Tecnalia because of its potential comparability to Latin American situations.
Table 4. Selected Programs Supporting Applied Technology Centers
Characteristics Fraunhofer Institutes (FhG, Germany) Industrial Technology Research Institute (ITRI, Taiwan) Public Industrial Technology Research Institutes (Kohsetsushi, Japan) Carnot Institutes (France) Tecnalia (Basque Country, Spain)
Orientation Applied R&D Advanced and
Applied R&D R&D and technology assistance for SMEs
Applied R&D Applied R&D
National governing agency
Fraunhofer
Society Ministry of Economic Affairs Ministry of Economy, Trade and Industry National Agency for Research Tecnalia Corporation
Form of entity Private
not-for-profit Government-owned Public (local government) Public research institutions Private not-for-profit
Geographic scope
Distributed across Germany
Main site in Hsinchu (beta site in Tainan)
All prefectures in Japan Distributed across France Distributed across the Basque country Number of institutes
60 1 180+ 34 10
Staff 20,000 5,730 c. 7,000+ 19,000 1470
Annual funding
US$723m (core government)
US$300m ~US$1,000m US$2,540m
(consolidated budget)
US$70m
Source: National Academies (2013); Shapira, Youtie, and Kay (2010).
2.3.5. Other Examples of TES-like Services
Development Organization (KOSGEB), an agency of the Ministry of Industry and Technology of Turkey established in 1990, runs a number of overlapping programs to support SME capacity development in Turkey. KOSGEB does not generally provide consultancy services itself except for the TEKMER program (an incubator program for start-up and microfirms physically located in collaborating host universities) but it provides money for firms to buy this service from the open market. In some programs, SMEs are allowed to use the facilities of KOSGEB (office, machinery, etc.) and obtain subsidized laboratory services for SMEs. If the firms benefit from certain other KOSGEB programs, these laboratory services are free.
Labs are located within 11 regional offices and 12 TEKMERs are located within university campuses (KOSGEB, 2010, 2012). Thirty-five percent of KOSGEB’s more than 1,000 staff resides in the Ankara headquarters facility with the remainder distributed across 75 regional service centers. The 2010 budget amounted to around US$160 million, of which about two-thirds was used directly for service provision (KOSGEB, 2012). In 2009 KOSGEB’s mandate was extended to cover nonmanufacturing SMEs as well. KOSGEB support used to be more in-kind in nature, including in-house consultancy, but in the last five years there has been a trend towards providing financial support to SMEs to obtain these services from the open market (KOSGEB, 2010).
In China, there are a number of programs aimed at increasing the manufacturing capacity of SMEs. One of the main priorities of China’s 12th S&T Five Year Plan is innovation in manufacturing. Technology-oriented business services and applied technology centers are used to offer TES-like services in China. The Spark program is one of the longest-established examples of programs focusing on SME capacity building. Since the 1980s, the program has helped Chinese rural enterprises (i.e. town and village owned enterprises) to use science and technology with the ultimate goal of fostering rural economic development. Besides affording funding to large impact and key projects, the Spark program has provided guidance for projects receiving technical assistance. Spark’s science and technology correspondents visit rural areas to offer technical and entrepreneurial assistance to rural enterprises. While the Ministry of Science and Technology (MOST) administers this program, much of the program management is done at subnational levels including province, prefecture and county (Li, 2012c). Cumulative investment in the program by the Chinese government reached roughly US$1.9 billion by 2006 (Yan, 2006)
research projects with industry and providing consultancy and technical services in the form of product prototyping, turnkey engineering, process development and laboratory services. Roughly half of the 264 NERCs (by 2010) were established by the private sector while the rest represent collaborations with universities and public research organizations. MOST provides financial resources for the initial setup of the NERCs, but they are financially independent by charging for their services (annual revenue for this is around US$10.4 billion), receiving income from research contracts and in rare instances receiving grants from MOST for special projects. The World Bank also provided financial support for a number of NERCs. Since the National S&T Infrastructure Construction Plan in 2004, NERCs have gained importance in providing services to industry. NERCS employed over 65,000 staff by 2010 and MOST invested around US$16 million in them that year (Li, 2012b).
Finally, the InnoFund program, established in 1999, is a funding instrument to support Chinese SME manufacturing efforts through grants, loans and equity investment. The budget for this program was about US$288 million in 2012.
2.3.5. Approaches to Organizing Technology Extension Services
This overview highlights the variations evident in different countries’ approaches. Each approach has its advantages and limitations. Applied technology centers are usually most appropriate in regions with advanced technology ecosystems and SME customers willing and able to pay for contract assistance with advanced technological issues as well as pragmatic service adoption. Technology-oriented business services are particularly relevant to markets with a large set of microenterprises or other types of SMEs with a need for integrated financial and technological assistance services. A dedicated field staff approach requires a relatively stable base of SMEs, but otherwise offers the flexibility of working with a broad set of customers and in environments with multiple private sector suppliers (in which case the field staff acts as a broker) as well as in local environments with few alternative sources of knowledge and assistance. All three approaches can accommodate various combinations of collaborations and alliances to provide program support (e.g., manufacturing associations), specialized services not resident within the program (e.g., incubators and other startup services or specialized machining and prototyping), and add capacity when necessary.
2.4. Policy Mix
TES programs differ not only in objectives and approach (as our three-part categorization indicates), but also operate within the context of particular national and regional innovation systems and capabilities, each with their own strengths, weaknesses, and dynamics. In these innovation systems, other complementary policies and actions are required to make TES programs really effective. Policy and programmatic actions to upgrade SME capabilities include labor market (e.g. vocational and technical training), fiscal (e.g. grants, loans, tax credits), legislative and regulatory (e.g. the cost of regulation) initiatives. There are considerable country-level differences in SME policy mix emphasis. The U.S. policy framework places less emphasis on vocational training and upgrading (because education tends to be primarily operated at the state and local levels), while cost and regulatory issues are of primary emphasis. In contrast, Japan takes a more centralized approach to labor, fiscal, legislative, and regulatory policies while there are structural constraints on flexibility and innovation (Shapira, Youtie, and Kay, 2010).
located in the innovation system and how it relates to other actors, deserve commentary. Some programs (such as the MEP) reside in the standards laboratories within the commerce function while others (such as the IRAP) reside in the research function. There are often complex historical reasons for programs being situated in particular institutions, including the lack of an ideal organizational setting. The most important emphasis of the different cases is how the programs operate, with appropriate attention given to the institutional context within which the programs reside (Shapira, 2001; Shapira Youtie, and Kay, 2010).
2.5. TES Assessment and Evaluation Models
There are variations in approaches to assessing and evaluating TES. Countries with the most extensive assessment and formal evaluation approaches include the United States, the United Kingdom and Canada where assessment and evaluation are often guided by a program logic model (Shapira and Youtie, 2013). The model begins with program intervention. Program interventions are the easiest to measure and are typically captured through monitoring and tracking systems that count instances of assistance provided and customers served. Ideally, a customer and activity reporting system is used to track program interventions (although sometimes self-reported information is relied upon). A program-wide reporting system would have the capacity for the decentralized input of information, standardized definitions of customer and assistance characteristics, and periodic reporting capabilities.
the client becomes more productive and may not need certain low skilled workers but is able to retain most workers as a result of these productivity gains. Typically business outcomes are run through an input-output model to extend direct benefits to other parts of the economy. Case studies are commonly used to draw out linkages between the assistance and these types of outputs, outcomes, and broader impacts.
To conclude, multiple methods are required to capture the full logic model associated with TES interventions. There is, however, a paradox associated with evaluating these types of programs. While TES evaluations seek to measure the impact of the program on client firms, they tend to ignore the situation of firms within value chains and networks (including technology centers, manufacturers, services providers, entrepreneurs, investors). Thus the key role of convening and connecting, which goes beyond the specific client firm to the broader ecosystem is usually not well captured in a typical TES evaluation. Special studies of the role of partnerships or global value chains must be conducted to capture the convening and connecting role of TES.
2.6. Summary
TES represent important measures for providing assistance to the typically underserved existing industry base of a country. Although TES can overlap with other services, several characteristics are central to the concept: an orientation toward established businesses, the use of expert specialists, and decentralized service provision. TES may be organized through a dedicated field staff, technology-oriented business support or R&D center approach. Many of the differences between TES-like programs lie in the distinctive policy frameworks of particular countries.
Second, there is a debate in the literature about whether services should have a focus on technology, sector, or region. Different countries take different approaches to these orientations. In Japan, every prefecture has one general center and the rest are sector focused. In Spain, services such as the Federación Española de Entidades de Innovación (Spanish Federation of Innovation and Technology Organizations or FEDIT) or Tecnalia have a sector focus. For FEDIT, this helps to secure corporate membership. Additionally, Spain has many geographically clustered industries, rendering a focus on sector more logical. The Fraunhofer Institutes have a highly technological orientation, reflecting the needs of its highly specialized base of firms, but this orientation requires closures and openings of new institutes every few years to keep pace with technological advances. These approaches are not necessarily mutually exclusive; rather they reflect the broader needs and makeup of a country’s industrial base.
Finally, there are debates about how to design TES programs. These debates include whether or not to focus on dynamic firms with growth potential, SMEs in strategic positions in global value chains, specific sectors or technologies, or to broadly service the SME base. Likewise, designs will have to determine how to prioritize the types of market failures or problems experienced by the SMEs in the market. For example, while most programs focus on problems SMEs have in acquiring information, knowledge, and resources to adopt pragmatic technologies and techniques, SMEs also face supply-side issues. Large customers, vendors, and consultants find it too costly to support SMEs and trade associations are lacking. The role of TES is not to crowd out these suppliers by offering publicly subsidized services that compete with these private sector providers. Rather TES serves a brokering role by reducing the high cost of marketing that these suppliers would experience in their efforts to reach SMEs, as well as a coaching and mentoring role to provide ongoing contact with SMEs that would be too costly and outside the scope of a typical private sector engagement. These supply-side gaps mean that TES programs must also help coordinate these potential service suppliers and balance these efforts with the delivery of assistance to SMEs.
3.
Overview of Case Studies
discusses the rationale for case selection, the methods used to develop the cases, and highlights of cross-case findings.
3.1. Case Selection
Four case studies were developed:
• The U.S. Manufacturing Extension Partnership (MEP) • The Manufacturing Advisory Service (MAS) in England
• The Industrial Research Assistance Program (IRAP) in Canada • Tecnalia, based in Spain’s Basque Region
The criteria used to select these case studies considered the need to incorporate a sectoral and / or territorial focus in the provision of services, the extent of diversity and clustering in the customer base, the quality and availability of program specialists, the types of services offered, use of evaluation for program improvement, and role of public funding. The programs chosen for case studies were found to offer insights applicable to a diverse range of companies, flexible and decentralized, and providing services with more of an application orientation than a research orientation. Each case represents a different TES organizational approach. Most importantly, they all have manufacturing bases with some stability. In addition, these cases have applicability to middle-income countries, as well as advanced economies.
3.2. Case Study Approach
Key probes were developed to analyze TES programs and case studies (see Box 2). With regard to the case studies, information was obtained through a review of websites and reports about the program, interviews with program managers, an analysis of budget and other financial information and evaluation documents.
Box 2. Key Probes for Analyzing TES Programs and Case Studies
TES programs and case studies are examined using the following set of probes:
§ History and evolution: how the program was started, relevant pre-history, and how/why the TES was housed in the particular institution.
§ Structure: key partners; budget for TES versus other types of services (advanced and basic); major service providing organizations; structure at agency level, program level, and provider level; how coordination takes place.
§ Program scale: annual budget–overall and normalized by number of manufacturers; number and type of institutions involved; number of offices overall and per state; number of staff; changes over recent period (last 3 to 5 years) in terms of budget and service orientation.
§ Financing: financing structure; funding mechanisms; degree of financial sustainability; incentives for firms and institutions involved in the program; recent changes; any performance-based financing schemes.
§ Services and clients: core TES services (e.g., needs assessments); and range of services provided, including whether or not there is a planned progression of services; marketing/outreach methods; provision of specialized services not available in-house; provision of adjacent services; industry segments served (if any); pricing structure and whether it varies by company size or location (urban vs. rural); evolutions and challenges in service provision; linkages to labs, equipment, other infrastructure. § Governance: how does the TES make decisions about opening or closing centers; how the TES
combines flexibility and oversight; who sets goals for the program; examples of a cooperative agreement with changes highlighted; incentives for involvement of institutions and staff; governance of the program and or institution(s) involved, private sector participation in the design and monitoring of the program, and composition and selection of advisory board members for the program; and what types of decisions are made at the central program level versus the regional level.
§ Personnel: educational, experience, and certification qualifications of staff; the program's policies for attracting, hiring and retaining highly qualified staff; training activities; certification programs; key specialization(s) of extension program staff; use of performance-based incentives.
§ Monitoring and evaluation: various evaluation methods and metrics used for monitoring and evaluation methods used; and impact of the programs in the beneficiary firms; challenges in measuring impacts and implementing frameworks and methodologies; evolution of evaluation methods over time.
Source: Authors’ elaboration.
two regional examples were carefully selected to illustrate a diverse range of operations. The South Carolina MEP was one of the first three centers established by the program in 1989. It is a private nonprofit center with a long history of developing assessment tools and operates in an economy with a diverse range of potential clients. The Georgia MEP is one of the two oldest university-based programs in the United States and is very well regarded for its management, the flexible use of industrially experienced personnel, and its ability to leverage and manage resources from the university (including faculty and students) and other related federal and state programs.
Case studies of the four programs were conducted over the four-month period of July to November of 2013. The case studies were guided by an inception report; a review of literature, definitions, and frameworks; discussions at a project kickoff meeting in Washington, DC, in June of 2013; and feedback from IDB, including in-depth comments on early drafts of the MEP and IRAP cases. Additional feedback was obtained through an IDB workshop on technology extension in Buenos Aires in March of 2014. The cases include information about the program at national level as well as state, provincial or regional examples.
In each case write-up financial amounts are presented in the country’s home currency. In the cross-case analysis current budgets are presented in U.S. dollars at current exchange rates.2 Detailed accounts of each of the four TES programs follow in the next four
sections.
4.
U.S. Manufacturing Extension Partnership
The Manufacturing Extension Partnership (MEP) is a national network of manufacturing specialists with centers in all 50 U.S. states. The federal government portion of the financing is matched by centers with funds from state, private sector, and other sources. The objective of the MEP is to enhance the competitiveness of the U.S. manufacturing sector through working with manufacturing SMEs. The program allows for flexibility in the structure and operation of centers, enabling states to take advantage of local historical conditions and assets in the configuration of their centers, while maintaining robust governance and extensive monitoring and evaluation.3
2 US$ 1 = 0.613 GBP, 0.727 EUR, and 1.0582 CAD.
3 This case study is based on personal interviews with managers at NIST MEP, SCMEP, and GaMEP performed
4.1. History and Evolution
The creation of the MEP arose from concerns about the competitiveness of U.S. manufacturing in the 1980s (OTA, 1990). These concerns reflected the ascendancy of strong European and Japanese manufacturers, which relied on advanced technology and techniques rather than lower costs. U.S. manufacturers were confronting heightened competition in both domestic and export markets and the nation’s former trade surplus became a deficit. Not only were there challenges in mature industries such as textile and steel, but also in complex subsectors such as the automobile, machine tool, and semiconductors and electronics industries. Warnings about the prospects for U.S. manufacturing led to several major policy reports, activities and initiatives. In 1986, the National Research Council’s Manufacturing Studies Board published “Toward a New Era in U.S. Manufacturing” about key transformational manufacturing technologies and policies to address these changes (1986). That same year, the Council on Competitiveness was founded by the former head of Hewlett Packard and chairman of President Reagan’s Commission on Industrial Competitiveness to provide a forum for leaders from business, university, and government to raise topical national competitiveness issues in the manufacturing sector in the U.S. policy arena.
The Omnibus Trade and Competitiveness Act was signed into law in 1988 primarily to address industrial competitiveness concerns and the expanding U.S. trade deficit.4 Part of
it dealt with technology challenges and established regional manufacturing technology transfer centers within the newly renamed and reoriented National Institute of Standards and Technology (NIST) in the U.S. Department of Commerce. In 1989, three manufacturing technology centers were selected in an initial start-up phase: the Great Lakes Manufacturing Technology Center at the Cleveland Advanced Manufacturing Program in Ohio (now called MAGNET, the Manufacturing Growth and Advocacy Network); the Northeast Manufacturing Technology Center at Rensselaer Polytechnic Institute in Troy, New York (now part of the New York Manufacturing Extension Partnership); and the South Carolina Technology Transfer Cooperative based at the University of South Carolina in Columbia (now the private nonprofit South Carolina Manufacturing Extension Partnership). Two additional centers were established in 1990 in Michigan and Kansas and two more in 1991 in Minnesota and California. These new manufacturing technology centers built upon a history of prior state and federal initiatives in manufacturing extension (see Appendix 1). Georgia, Iowa, Maryland, Michigan, North Carolina, Ohio, Tennessee, Texas, and Pennsylvania had industrial extension services in their states and the Department of Commerce’s State
Technical Services (STS) funded pilot manufacturing technology transfer programs in the 1960s and early 1970s (Shapira, 1990). While these centers were not the first experiences with technology extension in the United States, they did represent the beginning of a nationwide system.
Expansion to other states came through the Department of Defense’s Technology Reinvestment Project (TRP), created in 1993 to foster dual use commercialization. A further 27 manufacturing technology centers were created through TRP. These centers were all managed by the U.S. Department of Commerce, and transitioned to Department of Commerce funding by 1997, after which they were integrated into what became the Manufacturing Extension Partnership. By the middle of the 1990s there were MEP centers in all 50 U.S. states and Puerto Rico.
The founding legislation in 1988 did not envision an ongoing role of federal funding for TES services, although this was subsequently changed. Originally, it was anticipated that the federal co-funding share would ramp down from 50 percent of the center’s budget in the initial years to 33 percent after the third year. A sunset provision stated that the federal match would cease after the sixth year as the centers became self-sustaining. This was found to be unworkable (i.e., precipitating center closure) and in 1998, the Technology Administration Act eliminated the six-year sunset clause, allowing for an ongoing federal role.
The program’s strategic orientation has evolved since its inception. The initial design called for centers that would transfer federal laboratory technologies to small and medium-sized manufacturers; however, a 1993 National Academies study observed that besides technology services small and medium-sized manufacturers needed a broader range of management and training services (National Research Council, 1993). This finding led to a reorientation of the program toward off-the-shelf proven technologies and techniques rather than laboratory technology transfer. In the early to mid-1990s the MEP engaged in the building of a program to achieve national coverage, establish local service partnerships, and create an evaluation system to demonstrate business and economic impact. By the early 2000s, the direction of the program advanced toward system-wide initiatives. Offers of standardized services were put into place across the MEP system (e.g., tools for companywide assessments and delivery of quality system services such as ISO 9000 and lean manufacturing).
administration, efforts have been made to build up the manufacturing ecosystem through multi-agency solicitations around manufacturing and cluster development and through a new Advanced Manufacturing Partnership guiding a series of initiatives. These include a National Network for Manufacturing Innovation, comprised of regional manufacturing technology centers fostering the development and adoption of leading edge technologies.5 By early
2014 four manufacturing innovation institutes had been established and additional institutes are planned. Within the framework of U.S. manufacturing programs these institutes undertake advanced technology development and demonstration activities, generally with consortia of research organizations, selected larger companies and sophisticated smaller firms. The MEP continues to work downstream, offering pragmatic technology deployment and other TES services targeting the broad base of manufacturing SMEs.
4.2. Structure
4.2.1. Federal Agency Organization
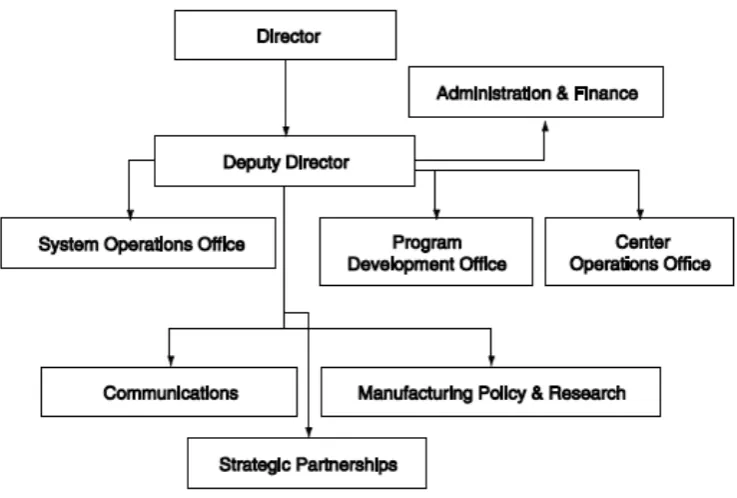
The MEP’s national office is situated in the NIST facilities in Gaithersburg, Maryland and houses 45 staff members (National Academies, 2013). It reports to the NIST Associate Director for Innovation and Industry Services. At the program level, the MEP’s organization includes a director, deputy director, and managers for systems operations, center operations, program development, and policy and research (Figure 2). The MEP has had three directors over its nearly 25-year history, all of whom emerged from management positions in government laboratories. The regional account managers are accountable to the systems operations manager and are responsible for overseeing a set of centers in a given region. The program development manager is responsible for new service delivery initiatives. The operations manager oversees the financials and cooperative agreements for each of the centers. The manager of policy and research designs, collects, and analyzes center-reporting metrics. The Gaithersburg office does not house any MEP center specialists.
Figure 2. NIST MEP Organization Chart, June 2013
Source: National Academies (2013).
4.2.2. State Structures
The MEP is a decentralized and flexibly structured system that allows individual centers to develop strategies and services suited to local conditions. The structure of centers varies according to the history of programs for manufacturers in each state or region but is required by law to be affiliated with a nonprofit organization.6 Nearly two-thirds of the centers are
structured as nonprofit organizations (under section 501(c)(3) of the Internal Revenue Service code which allows exemption from federal income taxes for designated public purposes); 17 centers are based in universities or community colleges; and state governments, usually commerce departments, run four centers. 501(c)(3) centers are typically set up as standalone private nonprofit organizations with independent boards. University centers are organized as a separate unit or embedded in the engineering college, school or university. Programs run by state government take in federal funds, centrally manage reporting and contractual requirements, and usually set up or use universities or separate 501(c)(3) organizations to deliver services.
The national program specifies that each center should have a director, a board of directors, and field specialists, but no other organizational arrangement is required. There is
6 Regional Centers for the Transfer of Manufacturing Technology, 15 U.S.C. 278k, 2012.
http://www.gpo.gov/fdsys/granule/CFR-2012-title15-vol1/CFR-2012-title15-vol1-part290. See also
often a manager responsible for the field specialists and regional offices. Some centers divide their staff into account managers who develop projects and technical specialists who deliver services and some have managers of key service areas such as continuous improvement or growth services (i.e., services that lead to increased sales such as product design and development assistance). Because many centers work with third party providers and partners, there may be managers responsible for partnerships and subcontractors. There is also usually someone responsible for reporting and metrics information. While centers may manage other federal, state, or local programs (e.g., a center may provide training for small businesses in how to respond to government contracts as one of the Defense Logistics Agency’s Procurement Assistance Centers), all work with manufacturing SMEs is subject to reporting and metrics requirements of the MEP program.
The MEP does not have a requirement at the federal or center level to work with any particular partner organization. A range of partner organizations are involved with the MEP. One study found more than 700 partners formally listed in the MEP reporting system (Shapira, Kingsley, and Youtie, 1997). The federal program has formal partnerships with the U.S. Patent and Trademark Office, Economic Development Association, Association of Procurement Assistance Centers, E3-Energy, Economy and Environment (initiative of the Department of Commerce, Environmental Protection Agency, Small Business Administration (SBA), Department of Labor, Department of Energy, Department of Agriculture), American Association of Community Colleges, Economic Development Administration, International Trade Administration, and Department of Transportation.7 The program also has a
cooperative agreement with private nonprofit intermediary organizations such as the State Science and Technology Institute (SSTI) and, through SSTI, the National Governors Association (NGA), and as well as with private firms. At the center level, diverse organizations have been involved, including universities, colleges, economic development organizations, technology centers, federal labs, utilities, and different kinds of private sector consultants. Some states require that certain partners work together at the regional level but no national requirement for local partnership collaboration exists.
Some of these partnerships provide matching funds for new initiatives. The following two federal-level partnership examples are illustrative. In 2013, the MEP collaborated with the Economic Development Administration of the Department of Commerce and the Department of Labor’s Employment and Training Administration to write and jointly issue a multi-agency federal funding opportunity (FFO) announcement entitled “Make it in America Challenge” to award up to US$40 million from the national program budget for a maximum of 15 projects in distressed regions. The FFO promoted projects that encouraged re-shoring by
constructing or rehabilitating physical infrastructure, providing technical assistance, and offering workforce training. The MEP offered US$6 million or US$125,000 per project out of the national program budget to MEP centers serving the distressed regions.8 In 2011 the
MEP granted US$300,000 to co-sponsor a manufacturing innovation policy academy with the NGA to work with governors’ administrations in eight states—Colorado, Connecticut, Illinois, Kansas, Massachusetts, New York, and Pennsylvania. The academy agenda exposed the states to progressive practices, cutting edge research, and peer-to-peer learning for state issues increasing the economic development orientation of universities, cluster strategies, manufacturing roadmapping, and various workforce needs. The academy hosted three meetings during the year, which brought in speakers and consultants.
Some partnerships extend the operational capabilities and offerings of the program. For example, the E3 partnership furnishes assessment tool capabilities enabling MEP centers without these capabilities to provide sustainable manufacturing services to their clients. Partnerships with the SBA enable MEP centers to provide services to small microenterprises, usually through referrals to Small Business Development Centers for business plan development and through referrals to various SBA financing programs.
These types of programs are not usually evaluated separately in the MEP’s monitoring and tracking system, because the system is primarily focused on the performance of a client firm and center but special studies have been undertaken to assess the effectiveness of these partnerships. For example, one such study by Yin, Merchlinsky and Adams-Kennedy (1998) found that a special program at the national level providing funds to selected centers to encourage partnerships between MEPs and SBDCs—where the MEP would provide technical services and the SBDC would provide business and market planning services—was not more effective than partnerships that emerged organically at the center level without the planned federal effort.
4.3. Program Scale
The MEP has 60 centers that operate 370 offices (Map ) staffed with 1,450 specialists (National Academies, 2013). The average center employs 27 full-time equivalent staff members of which two-thirds are professional and technical staff.9 In the mid-1990s, there
were 75 centers because a few states (e.g., New York, California, Ohio) had multiple centers; these centers have since merged into a single statewide network with the former centers becoming offices in the statewide system. Pennsylvania remains a multicenter state. At one point, the MEP had several super centers comprised of multiple states, which were
8 http://www.manufacturing.gov/make_it_in_america.html
expedient for states without infrastructure for the program. However, they have all since dissolved as the directors of these super centers retired and individual states sought to have more control.
Map 1. MEP Office Locations (MEP, 2006)
Source: MEP (2006).
4.4. Financing
[image:33.595.150.449.144.371.2]The overall annual budget for the MEP is about US$300 million, including federal, state, and private sources (National Academies, 2013). An estimated US$123 million is sourced from the federal budget (in the financial year (FY) 2013) and roughly 80 percent of these federal funds financed the basic operations of the centers (Table 5).
Table 5. NIST MEP Federal Budget (FY 2013)
Item Millions of Dollars Percent of Total
Center Renewal Funding 93.5 76.0
Strategic Competitions 3.9 3.2
Support for Centers 11.4 9.3
Programmatic
Requirement/Administration
3.2 2.6
Centralized MEP System Support
8.2 6.7
NIST MEP Labor + Benefits 7.8 6.3
Other Objects 0.9 0.7
NIST Overhead 5.5 4.5
Total 123.0 100.0
Source: National Academies (2013).
funds from state and local government sources, fees for services performed, revenue from licensing and royalties, and in-kind contributions of personnel; although the latter cannot account for more of half of the cost share (National Institute of Standards and Technology, 2013). The funding model sought by NIST is: one-third federal (NIST), one-third state government and one-third fees charged to manufacturing SME clients. The state government share has been less reliable in recent years as some have cut their program match in the wake of financial shortfalls. Raising cost sharing dollar requirements have led to more fee-based services, larger more sophisticated firms and those in highly urbanized areas (GAO, 2011).
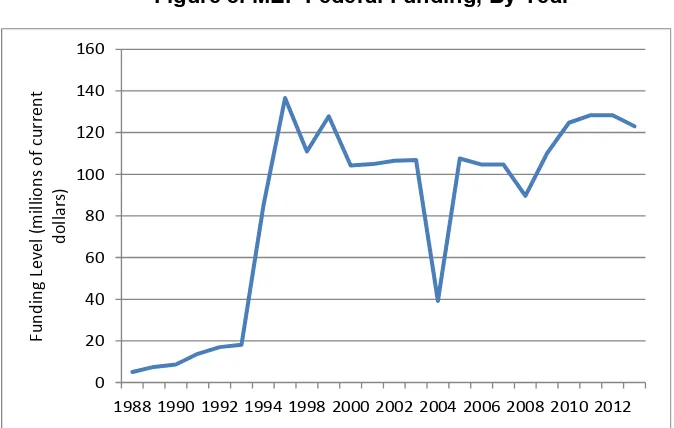
[image:34.595.117.454.536.750.2]The MEP has also experienced considerable fluctuations in its federal budget. The initial budget for the MEP was US$5 million in 1989 (three centers for US$1.5 million each plus program administration). The budget rose as centers were added: US$7.5 million in 1990, US$12 million in 1991, US$15 million in 1992, US$17 million in 1993, US$40 million in 1994. Through the transition from the Department of Commerce and TRP (Department of Defense) funds, the MEP appropriation rose to US$95 million by 1997 (Hallacher, 2005) plus some supplements for Y2K (Year 2000 information technology) assistance. In the 2000s, the federal budget for the MEP fluctuated from around US$100 million to US$130 million. It was at the lower end of this range in the early 2000s (indeed its budget was reduced to around US$40 million in 2004), but has incrementally grown in the period from 2010 to 2013. The MEP budget grew by nearly 3 percent from 2010 (US$124.7 million) to 2011 (US$128.4 million), but dropped back to US$123 million by 2013 (Figure 3). Efforts to maintain support for the program have been coordinated by the Modernization Forum and the American Small Manufacturers Coalition advocacy associations.
Figure 3. MEP Federal Funding, By Year
Source: National Academies (2013). 0
20 40 60 80 100 120 140 160
1988 1990 1992 1994 1998 2000 2002 2004 2006 2008 2010 2012
Fun
di
ng L
ev
el
(m
ill
ion
s
of
cu
rre
nt
do
llars
Given that the MEP is the primary federal technological service for small and medium-sized manufacturers, its budget is relatively small in comparison to the budget for general assistance to small businesses and R&D. Its budget is 75 percent of the Small Business Administration’s noncredit budget line (based on an average of the budget for fiscal years 2012–14), 0.1 percent of the federal R&D budget and 7 percent of the budget for the Small Business Innovation Research and Technology Transfer (SBIR/STTR) programs. The U.S. investment in the MEP as a percentage of GDP was around 0.0009 percent in 2012. Ezell and Atkinson (2011) reported that, notwithstanding issues of comparability, in 2009 the overall budget for Canada’s extension program was 10 times larger than that of the MEP as a share of GDP, Germany’s was 20 times larger, and Japan’s was 30 times larger. In 2011 (the most recent year of manufacturing data available), the MEP federal budget amounted to US$436 per manufacturing establishment.10
The average center receives US$1.5 million from the federal government, but there is a wide range: allocations run from less than US$500,000 for smaller states (Delaware, Hawaii, South Dakota, West Virginia) to more than US$5 million for larger states (California, Texas, New York). The federal sponsor does not offer performance-based financial schemes.
4.5. Services
Two basic service delivery models exist in the MEP system. This first is the in-house specialist model whereby the majority of services are delivered by internal staff. The second is the broker model whereby consultants provide specialized services or capacity and the MEP brokers the services by qualifying external consultants and managing relationships between these consultants and manufacturing clients. Nearly all centers provide some form of a mix of these two models. The Georgia MEP is among the centers that provide almost all services in-house; the Oklahoma Manufacturing Alliance is among those that are primarily marketing and project management organizations with nearly all services provided through third party consultants.
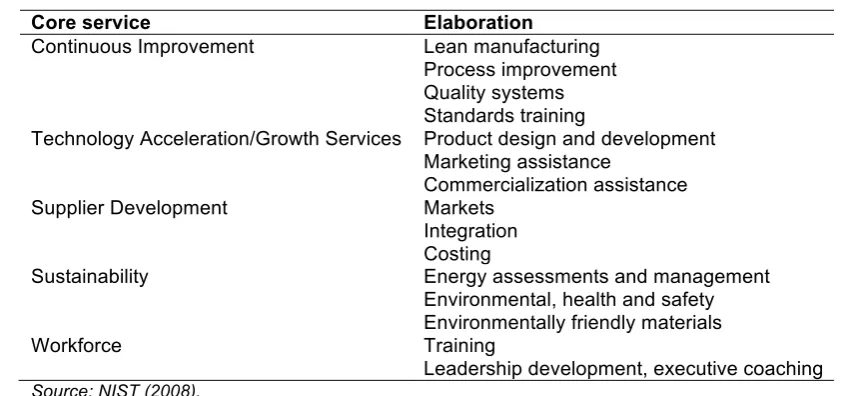
Most MEP centers deliver assistance through a range of services including lean process, energy management, quality systems, business process and supply chain management, product and market development, information technology, and human resource development (Table 6). There is no natural progression of services, rather services are dependent on client needs; and services are not standard. They vary widely in terms of description of services, number of hours involved, milestones, and costs. Likewise, centers
10 Based on 295,643 manufacturing establishments with at least one employee from County Business Patterns in