1
Optimal design of a thin-wall diffuser for performance
improvement of a tidal energy system for an AUV
Weichao Shi 1, Dazheng Wang2, Mehmet Atlar1, Bin Guo2, Kwang-cheol Seo1
1 School of Marine Science and Technology, Newcastle University, UK
2 Naval Architecture and Ocean Engineering, Harbin Institute of Technology, Weihai, PR China
Corresponding Author
Kwangcheol Seo, [email protected]
Assistant Professor / Ph.D
Department of Naval Architecture and Ocean Engineering
Mokpo National Maritime University, South-Korea
Office Phone: 0082-(0)061-240-7303
2 Abstract
The study presents an energy performance improvement measure for an Autonomous Underwater Vehicle (AUV) carrying oceanographic equipment for collecting scientific data from the ocean. The required electric energy for the on-board equipment is harvested from tidal energy by using twin horizontal axis turbines which are integrated with thin-wall diffusers to enhance their energy capturing performance. The main focus and hence objective of the paper is the optimal design of the diffusers by using Reynolds Average Navier-Stokes Equations (RANSE) based Computational Fluid Dynamics (CFD) method and the validation of the design using physical model tests.
A goal-driven optimisation procedure is used to achieve a higher power coefficient for the turbine while keeping the size and the drag of the diffuser as practically minimum as possible. Two main parameters of the optimisation are selected, the outlet diameter and the expansion section length of the diffusers, which are optimised for the highest flow acceleration ratio at the diffuser throat and for the minimum drag of the integrated diffuser and turbine system which is called as “Diffuser Augmented Tidal Turbine” (DATT) system. The numerical optimisation is validated by two sets of physical model tests conducted with a single turbine without diffuser and the same turbine integrated with the diffuser (DATT) in a cavitation tunnel and a circulating water channel. These tests demonstrated a performance enhancement for the turbine with the optimal diffuser by almost doubling the power coefficient of the turbine without the diffuser. However the performance enhancement was dependent upon the pitch angle of the turbine.
3
1
Introduction
1.1 Challenge for tidal energy
With the increasing depletion of traditional fossil energy, like coal, oil and gas, renewable energy is growing to be the main focus of attraction in the world by considering its green nature. Amongst in different types of renewable energy resources, during the last decades, tidal energy has been targeted and explored as one of the most promising type due to its high predictability and resource abundance (Charlier, 2003; Li et al., 2010; Pelc and Fujita, 2002). Hence various types of tidal energy devices have been developed in recent years. For the purpose of testing some of the newly developed prototype tidal devices, the European Marine Energy Centre (EMEC) has established a testing site around Orkney Island of UK in 2003 (Ben Elghali et al., 2007). Orkney is an ideal base with its excellent oceanic wave regime, strong tidal currents, grid connection and sheltered harbour facilities. This is complemented by the expertise in the field of renewable, maritime and environment that exist within the local community. These attributes have made the EMEC site is an important hub for the tidal energy developments in UK and worldwide.
4
mounted together on a single crossbeam which is buoyant and tethered to the seabed by a series of mooring chains (Ben Elghali et al., 2007).
On the other hand, the distribution of tidal current velocities vary all over the world, generally from 0.5 to 4.0 m/s, depending on the topography (Charlier, 2003). Nevertheless, most areas around the world do not have strong tidal current like in the above mentioned EMEC test site, 3~4 m/s. Therefore the general applicability of certain type tidal energy devices has been questioned. As a result different tidal turbines or generating systems have to be designed to suit local conditions, in terms of e.g. the diameter, the rotation speed and so on. Therefore, it is more difficult to perform volume production in order to lower the cost, like in the wind and solar energy. Besides this, according to some research (Pelc and Fujita, 2002) it is not economical to apply a tidal energy device to areas where the tidal current velocity is below 2m/s which is the most common circumstance for all over the world. To overcome these problems, one of the practical options is to use acceleration devices to enhance the current velocity and hence to improve the applicability of the tidal devices in lower speed regions. Within this framework the diffuser concept is a well-known acceleration means by using an enlarged exit area to inlet area and hence accelerate the flow passing through the turbine as exploited in the wind turbine technology (Ben Elghali et al., 2007). The interest for the diffuser application on the tidal turbines is also reported to be on the increase e.g. (Mehmood et al., 2012; Ohya et al., 2008; Ponta and Jacovkis, 2008; Reinecke et al., 2011; Werle and Presz, 2008).
1.2 Concept of an Autonomous Underwater Vehicle (AUV) using tidal energy
5
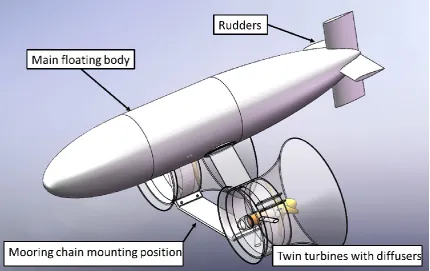
endurance of such instruments a novel AUV concept has been developed under the research project sponsored by the State Oceanic Administration of the People’s Republic of China (GHME2011GD01). The concept AUV is powered by twin tidal energy converters, as sketched in Fig.1 and consists of three sub-systems described next.
The first subsystem includes two DATTs working as the power generator and supply unit. The turbines are designed to generate a 1kW rated power in 1m/s current velocity. Fixed pitch and variable speed control methods are used to pursue the maximum efficiency. The generated power will be used to charge the battery packs located inside the AUV which will continuously supply the electric power for the instruments carried on board. Although the main function of the DATTs is to generate electric power for the instruments they can be also used for thruster to change the location of the AUV.
Due to varying environmental conditions, the hydrodynamic forces on the AUV would be changing by different working conditions. The second subsystem of the AUV is therefore to control the attitude and motion of the device in order to keep the turbines in-line with the main flow direction. This subsystem therefore contains gyroscope, two cross rudders and several integral ballast water tanks.
The third subsystem of the AUV is a gravity based mooring system for anchoring the device to the seabed. This allows the device to adapt with the flow direction and hence to provide the AUV with a self-adaptation capability to face the incoming velocity. The mooring system would also provide a capability to adjust the depth of submergence of the device by winding or releasing the mooring chain. This would also benefit the maintenance and recycle work. 1.3 Design approach to Diffuser Augmented Tidal Turbine (DATT) system
6
As far as the diffuser design is concerned, it is known from the literature that, the diffuser concept was initially exploited in the wind energy circles and then has been recently introduced in the tidal energy applications (Hansen et al., 2000; Lawn, 2003; Ohya et al., 2008; Werle and Presz, 2008). Various types diffusers (or ducts) for wind turbines or tidal turbines have been designed and investigated, such as diffusers with flanges (Ohya et al., 2008; Tedds et al., 2014), diffusers using airfoils (Luquet et al., 2013; Mehmood et al., 2012; Shives and Crawford, 2010), Venturi ducts (Lago et al., 2010; Li, 2014) and so on. However, considering the present application, the target diffuser is expected to work for a long time in the ocean and hence it has to be simple, reliable and robust. According to the previous studies, the acceleration ratio of the diffuser, which is critical for the performance enhancement, is mainly determined by the ratio of the inlet area to the outlet area as well as the length of the diffuser. Therefore, the design of the subject diffuser should maintain a simple shape whilst its optimisation should only integrate the most important design parameters.
However, one of the complexities of the design and analysis of turbines with diffusers is to determine the actual velocity passing through the turbine swept area, because of the interaction between turbine and enclosing diffuser (Bussel, 2007). A simplified approach for this is to utilize the actuator theory for the turbine modeling (Burton et al., 2011), where the turbine can be simplified as an actuator disc. In this study, since the RANSE based CFD modeling will be used in combination with the actuator disc theory the effect of the disc, with the same diameter as the turbine, will be represented by a pressure jump before and after the disc to model the energy extraction like turbine (Burton et al., 2011; Harrison et al., 2010). By this approach, several basic characteristics of the turbine can be quickly achieved. The limitation of this approach is obvious since the detailed geometrical information of the blades will be lost. However, it is still the ideal approach in terms of the optimisation task of the diffuser, which is the main focus in this study, since this will save considerable amount of computational time.
7
8
2
Diffuser design and optimisation
2.1 Turbine performance without diffuser
Although the AUV has twin DATT system the design, optimisation and model test tasks were concentrated on a single DATT system by assuming the effect of interaction between the main body of the AUV and DATT system is negligible.
The turbine of the powering subsystem was initially designed without a diffuser and model tested. This was a 3-bladed horizontal axial turbine using symmetrical and bi-directional airfoil blade sections. These sections are classified as BDA65-21 and BDA66-12 (Guo et al., 2013; Shi et al., 2013), which were adopted from NACA 65-21 and NACA 66-12, respectively, as shown in Fig.2. The open water performance of the turbine was verified experimentally using a 300mm diameter model turbine which was initially tested in the Emerson Cavitation Tunnel (ECT) of Newcastle University, UK (Atlar, 2011) and later in the circulating water channel of Harbin Institute of Technology (HIT), in China.
The model turbine was arranged and manufactured to change its pitch angle to +/- 5° relative to the design pitch angle, which is defined at 0.7r (as 4.21°) and referred as 0° in the rest of the paper. The details of the main geometry of the blades are shown in Tab.1 in terms of the chord length and the pitch angle distribution across the span while the picture of the 300mm model turbine is shown in Fig.3. The root region of the turbine blades, from 0.2R to 0.4R, was based on the thicker BDA65-21 section to ensure adequate strength for the blade. In the tip region, from 0.6R to 1.0R, the thinner BDA66-12 was employed to enhance the efficiency of the turbine as well as minimise the cavitation.
Tab.1 Main geometry of turbine model
r/R 0.2 0.3 0.4 0.5 0.6 0.7 0.8 0.9 1.0 Chord length (mm) 38.16 35.51 32.86 30.21 27.56 24.47 21.82 19.17 16.52
Pitch angle (deg) 22.61 16.17 11.68 8.45 6.11 4.21 2.99 2.02 1.23 Airfoil type BDA65-21 Transitional BDA66-12
9
CP is above 40%. The first model test was carried out in the Emerson Cavitation Tunnel (ECT),
which has no free surface, at atmospheric condition with a 3m/s incoming velocity that corresponds to the Reynolds number range of 1E+5 to 4E+5 for varying rotational speeds of the turbine. The second test was conducted in the HIT circulating water channel with the incoming velocity under 1.3m/s which corresponded to the Reynolds number range varying from 3E+4 to 1E+5 because of the limitation of the facility’s drive system. Even though the Reynolds number in the ECT is almost three times higher than in the HIT water channel the impact of the Reynolds number on the results appeared to be limited. Only 0.75% difference can be found at TSR=5.5 when the turbine reached to the maximum power coefficient (Shi et al., 2013).
2.2 Diffuser Design
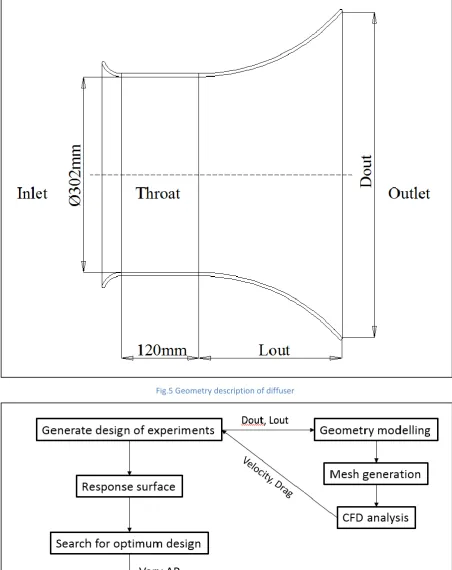
The diffuser considered for the turbine described in Section 2.1 was a thin-wall shroud. Its basic geometry is shown in Fig.5. Bearing in mind several practical limitations and engineering considerations for the prototype system: such as ease of manufacture, installation and size limitations, the diffuser was designed to have a small frontal (inlet) nozzle, a middle parallel body (throat) for the turbine installation and an expansion diffuser (outlet) which was the major part for speed acceleration.
The initial main dimensions of the diffuser were based on the diameter of the turbine, which was 300mm in model scale; hence the diameter of the diffuser throat was selected 302mm with a 1mm practical tip clearance. In order to optimise the diffuser geometry two main optimisation variables were selected to be the expansion section (Lout) and the diameter of
the outlet (Dout) as shown in Fig. 5. As indicated by the previous studies e.g. (Shives and
Crawford, 2010), lengthening of Lout and enlarging of Dout would enhance the acceleration of
10 2.3 Numerical modelling of turbine
As stated in Section 1.3 it is not an easy task to analyse the flow action passing through the turbine in a diffuser due to the complex interaction between the turbine and enclosing diffuser (Bussel, 2007). While the turbine is extracting energy from the flow by slowing it down, the diffuser will be creating a suction affect to accelerate the flow. In this framework in order to model the turbine action in a simplified manner the well-known axial momentum theory, where the turbine is assumed to be an actuator disc, can be used (Burton et al., 2011; Harrison et al., 2010). The action of the disc would lead to a reduction in the momentum of the flow passing through the disc, which would cause a pressure jump (Burton et al., 2011; Bussel, 2007; Scherillo et al., 2011). This pressure jump (∆p) across the disc can be represented in terms of axial induction factor (a) as in the following.
∆𝑝 = 2𝜌𝑉𝑓𝑎𝑟2 𝑎(1 − 𝑎) eq. 1
where Vfar is the incoming velocity, m/s; ρ is the density of water, 997 kg/m3.
Power coefficient (CP) of the turbine can be related to the axial induction factor as in eq.2.
𝐶𝑝 = 4𝑎(1 − 𝑎)2
eq.2
As presented in Section 2.1, the maximum Cp of this turbine without diffuser is around 0.4,
which corresponds to ∆p=229.89 Pa. However, for the DATT the pressure jump across the turbine including the effect of the diffuser is not the same as the turbine without the diffuser, since the velocity will be higher. In order to simulate this acceleration effect in the optimisation process, which is presented in the next section (2.4), an initial value of p = 300Pa was used. After the optimisation process, different pressure jump values would be applied to find the maximum Cp.
2.4 Diffuser optimisation
11
optimisation process are given in the following steps whilst the associated flowchart for the computational implementation of these steps is shown in Fig.6.
1. Geometry of the diffuser and associated computational fluid domain were created in the ANSYS-Design Modeller module. As described earlier in Section 2.2 and shown in Fig.5, the diffuser was represented by two variables, Dout and Lout for the
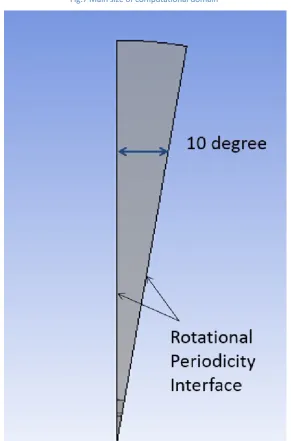
optimisation purpose. And then the flow domain was modelled. The inlet in the upstream of the diffuser was located at a distance of 10R (here R is referred to the turbine radius) from the diffuser while the outlet was located at 20R downstream. The radial out boundary was located at 15R away from the diffuser. The computational domain with these boundaries is shown in Fig.7. In order to enhance the computational speed the whole flow domain was represented by rotational periodicity interfaces at every 10° interval in the circumferential direction as illustrated in Fig.8.
2. The mesh of the fluid domain was built in the ANSYS-Meshing module by using unstructured mesh. For the boundary layer control, prism mesh was used to ensure the mesh quality in the boundary layer. Due to the scalable wall treatment in the k turbulence modelling, the first layer thickness near the wall was taken as 0.1mm (ANSYS, 2013). Under these settings, the number of grid elements was controlled around 500,000 to ensure that the computations could be performed both accurately and efficiently.
12
turbine was introduced using the actuator disc model. The associated pressure jump was selected as 300Pa.
4. During the CFD simulations the mean velocity at the throat, where the turbine was located, and the drag of the diffuser were considered as the performance evaluation indicators. In determining the optimal diffuser size, Dout and Lout were varied
systematically by the bench work system within a reasonable range.
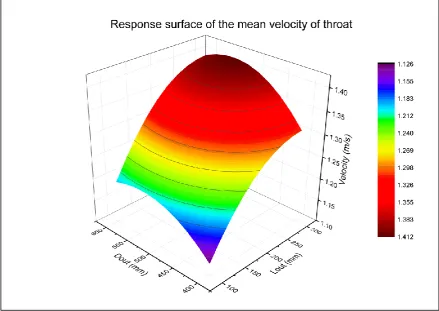
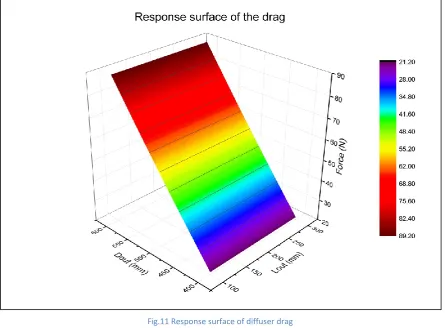
5. Eventually the response surfaces for the throat velocity and diffuser drag were plotted for the two optimisation variables (Dout and Lout) to select the optimal
diffuser configuration.
6. With the selected optimal diffuser configuration, the pressure jump from 0 to 500Pa was applied on the actuator disc to find out its maximum power coefficient Cp that
the optimal design can be achieved (Shives and Crawford, 2010; Werle and Presz, 2008).
2.5 Optimisation results
The global sensitivities of the two important optimisation variables (Dout and Lout) on the
diffuser performance in terms of the throat velocity and the drag of the diffuser are shown in Fig.9. As can be seen in Fig. 9 the expansion section length (Lout) has a larger influence on
the throat velocity than the outlet diameter (Dout). This is because increasing Lout reduces
the effect of flow separation which, in turn, reduces the acceleration ratio. On the other hand, Dout appears to have significant effect on the drag compared to the negligible effect of
the Lout. This can be related to the fact that any increase in the outlet diameter will reflect
on the diffuser area by the square term which leads to the dramatic increase in the drag. The response surfaces for the throat mean velocity and the diffuser drag, which were obtained during the optimisation process, are shown in Fig.10 and Fig.11 respectively. As can be seen in Fig.10, with the increase of Dout and Lout, the throat mean velocity is increased
13 the optimisation parameters varied.
As far as the diffuser drag is concerned, as shown in Fig.11, the increase in Dout results in
almost linear and dramatic increase in the drag whilst the change in Lout has almost no
impact on the drag by following the same trend observed in the sensitivity analysis.
Based on the analyses of the response surfaces three possible sets of optimal results that can achieve the highest velocities but generate moderate drag values were obtained as listed in Tab. 2.
Tab. 2 Computed results for the selection of optimal diffuser design
Name Lout (mm) Dout(mm) Mean Velocity(m/s) Force(N)
Optimal diffuser No.1 202.10 499.71 1.36 54.13
Optimal diffuser No.2 214.90 497.17 1.37 53.27
Optimal diffuser No.3 227.70 498.73 1.38 53.80
As shown in Table 2, the three results are very close to each other. Lout is around 220mm
and Dout is close to 500mm and the performances in terms of the throat mean velocity and
diffuser drag appear to be almost the same. Therefore, the optimum design can be considered to be achieved by a 220mm for Lout and 500mm for Dout.
14
3
Experimental validation
3.1 Experimental set-up
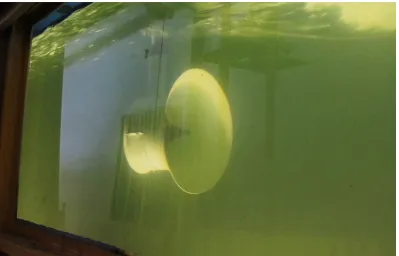
Having completed the numerical optimal design of the diffuser, the next was the experimental validation of its performance. For this purpose the earlier described model diffuser was manufactured from Glass Reinforced Plastic (GRP) material and integrated with the model turbine to form the DATT system. The system was then tested in the circulating water channel facility of Harbin Institute of Technology (HIT). The main dimensions and speed capability of this facility are given in Tab.3 while its testing section is shown in Fig.13 where the model diffuser and turbine assembly can be seen.
Tab.3 Main parameters of circulating water channel (HIT)
Length of the test section (m) 8
Width of the test section (m) 2
Water depth (m) 1.3
Current speed (m/s) 0.2 - 2
The experiments were concentrated to determine the power coefficient (CP) and the drag
coefficient (CD) of the DATT system, which is defined as the sum of the turbine thrust and
the diffuser drag, over a range of tip speed ratios (TSRs) within the capabilities of the testing facility and its equipment. It should be noted that the power coefficient here is referred to the hydrodynamic coefficient without the drive-train efficiency or efficiency of the generator.
For evaluating the performance of the DATT system the use of different power coefficient (CP) definitions combining the turbine and diffuser performances is still being debated even
15
𝜆 = 𝜔𝑟
𝑉𝑓𝑎𝑟 eq.3
𝐶𝑝 =
𝑃ℎ𝑦𝑑𝑟𝑜
1 2𝜌𝑉𝑓𝑎𝑟3 𝐴𝑇
= 1 𝑄𝜔
2𝜌𝑉𝑓𝑎𝑟3 𝐴𝑇 eq.4
𝐶𝐷=
𝐷 1
2𝜌𝑉𝑓𝑎𝑟2 𝐴𝑇 eq.5
where TSR is the tip speed ratio of the turbine; ω is the angular velocity of the turbine, rad/s; r is the radius of the turbine, which is 150mm; Vfar is the incoming velocity, m/s; Phydro
is hydrodynamic power of the turbine; ρ is the density of water, 997 kg/m3; A
T is the swept
area of the turbine, m2; Q is the torque of the turbine, Nm; D is the drag of the DATT system,
N.
Further details of the experimental set-up in relation to the powering performance (e.g. generator) and diffuser forces (e.g. load cell) are given in the next sections.
3.2 Power coefficient analysis
16
𝐶𝑝 =1𝑃ℎ𝑦𝑑𝑟𝑜 2𝜌𝑉𝑓𝑎𝑟3 𝐴𝑇
=
𝑃𝑜𝑢𝑡 𝜂 +𝑄𝑓𝜔 1
2𝜌𝑉𝑓𝑎𝑟3 𝐴𝑇
eq.6
where Pout is the measured electrical power, W; η is the efficiency of the generator; is
the friction torque of the sealing and bearing, Nm.
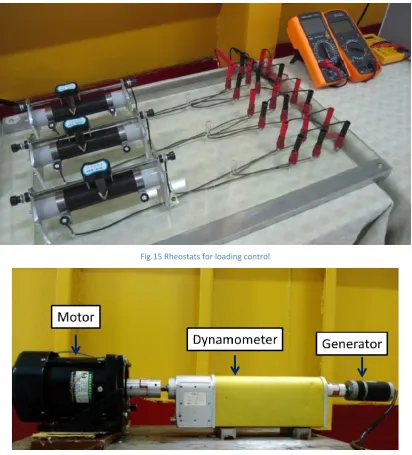
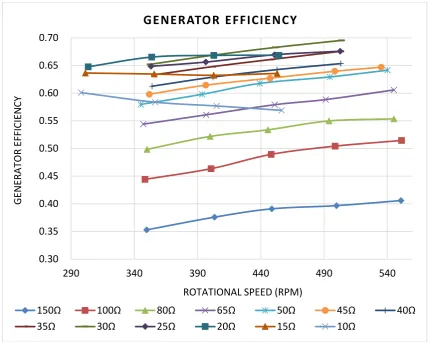
The efficiency of the generator under varied loading conditions and rotational speeds had to be calibrated by using the motor and the dynamometer shown in Fig.16. The variation in loading conditions was achieved by the same loading control device shown in Fig.15. The calibration results for the generator efficiency are shown in the Fig.17. Based on the further calibrations before the installation the friction torque of the sealing and bearing system was found to be around 0.1 Nm to be taken into account in the analysis.
3.3 Drag coefficient analysis
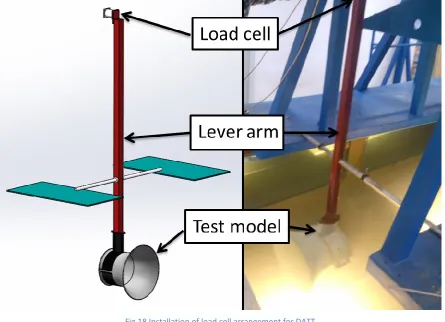
The drag of the DATT system was measured using a load cell. A frame with a 1: 1.78 lever arm was designed to transfer the system’s drag to the load cell at the top as shown in Fig.18. The diffuser was mounted at the bottom of the lever arm. Therefore the force measured in the load cell was only 1/1.78 of the drag of the test model. Hence derived from eq.5, the drag coefficient was calculated from eq. 7.
2 2
. *
= measure
D
far T far T
1 78 D D
C
1 1
V A V A
2 2
2 2
. *
= measure
D
far T far T
1 78 D D
C
1 1
V A V A
2 2
𝐶𝐷 =
𝐷 1 2𝜌𝑉𝑓𝑎𝑟2 𝐴𝑇
=1.78𝐷1 𝑚𝑒𝑎𝑠𝑢𝑟𝑒
2𝜌𝑉𝑓𝑎𝑟2 𝐴𝑇
eq.7
where Dmeasure is the value that measured by the load cell, N.
3.4 Results and discussions
During the whole testing process in the circulating water channel, the incoming water velocity was maintained constant with a 1.0m/s. Two series of experiments were carried out
f
17
with 0° and +5° pitch angles of the turbine to analyze the power coefficients, CP, and the
system’s drag coefficients, CD/10. The results are shown in Fig.19 and Fig.20 for the power
coefficient and the system’s drag coefficient, respectively, over the TSR range applied. First of all, Fig.19 clearly illustrates the enhanced performance of the turbine with the optimal diffuser (DATT) over that of the same turbine without the diffuser in terms of the power coefficient. The maximum enhancement due to the diffuser is almost 100% over the turbine with no diffuser for the +5° pitch angle setting. It is also interesting to note that the performance improvement is dependent upon the pitch angle of the turbine. At the 0o pitch
angle setting the performance improvement due to the diffuser drops to about 62% level. The addition of the diffuser also affects the variation of the CP curve over the TSR tested.
The maximum CP was shifted from 6.2 to 7.1 while the CP curve became wider for the +5°
pitch angle case. It is also interesting to note that, over the TSR range of 6.2 to 7.6, the values of the CP coefficient are continuously above 0.8 presenting an attractive and robust
efficiency performance.
In complementing the trend in the CP curves, as shown in Fig.20, the system’s drag
coefficient values for the +5° pitch angle setting are also lower than those of the 0° pitch angle case by a great margin over the full range of TSRs. This is obviously a desirable feature for an anchored floating system to reduce the mooring forces. The maximum value of the CD/10 for the +5° pitch angle setting is around 0.26, while that of the 0° pitch angle case is
about 0.32.
Referring to the above observations, as a consequence, the turbine with the +5° pitch angle case had a better performance than the turbine with the 0° pitch angle by providing an 18.5% increase in the maximum value of the power coefficient and 23.1% reduction in the maximum value of the system’s drag coefficient.
4
Conclusions
18
main objective of the paper is the design and optimisation of a thin-wall diffuser for the DATT system using the CFD based numerical method and to validate the optimal design by model tests.
In order to achieve the objective of the study a goal-driven optimisation methodology was conducted for the optimal design of a thin-wall diffuser to achieve higher flow acceleration inside the diffuser while maintaining small diffuser size and hence associated drag. The outlet diameter (Dout) and expansion section length (Lout) of the diffuser were chosen as the
main variables for the optimisation and they were evaluated using a commercial RANSE based CFD code. In the CFD modeling the effect of the turbine and hence the interaction between the diffuser and the turbine was simplified by using an actuator disc model for the turbine action. In order to validate the diffuser performance two sets of model experiments were conducted with an existing turbine with no diffuser and with the optimal diffuser at two different pitch angles of the turbine at 0° and +5°. Based on these investigations the followings were concluded.
1. The CFD based predictions indicated that theoretical performance of the turbine with the optimal diffuser can be enhanced around twice the performance of the same turbine without the diffuser.
2. CFD simulations further indicated that Lout had a larger influence on the mean flow
velocity at the diffuser throat than Dout had. This was because the lengthening of Lout
would reduce the effect of flow separation which would in turn reduce the acceleration ratio. On the other hand, Dout had considerably greater effect on the drag of the diffuser
due to the increased frontal area of the diffuser by the square value of Dout.
19
4. The model tests validated the performance enhancement by the optimal diffuser by almost doubling the power coefficient of the turbine without the diffuser. However the performance enhancement was dependent upon the pitch angle of the turbine as stated in conclusion 3.
Acknowledgement
20
Reference
ANSYS, 2013. Release 14.5 Documentation. Inc ANSYS.
Atlar, M., 2011. Recent upgrading of marine testing facilities at Newcastle University. The 2nd Intl’ Conf’ on Advanced Model Measurement Technology for the EU Maritime Industry, 4-5 April 2011, Newcastle upon Tyne, UK, 1-32
Ben Elghali, S., Benbouzid, M., Charpentier, J.F., 2007. Marine tidal current electric power generation technology: State of the art and current status, Electric Machines & Drives Conference, 2007. IEMDC'07. IEEE International. IEEE, pp. 1407-1412.
Burton, T., Jenkins, N., Sharpe, D., Bossanyi, E., 2011. Wind energy handbook. Wiley.
Bussel, D.G.J.W.v., 2007. The science of making more torque from wind: Diffuser experiments and theory revisited. Journal of Physics: Conference Series 75, 012010.
Charlier, R.H., 2003. A “sleeper” awakes: tidal current power. Renewable and Sustainable Energy Reviews 7 (6), 515-529.
Francis, M., Hamilton, M., 2007. SRTT Floating Tidal Turbine Production Design Study with Independent Verification. Carbon.
Guo, B., Wang, D.Z., Zhou, J.W., 2013. Numerical Predictions and Experimental Verifications for Hydrodynamic Performance of Tidal Stream Turbine. Manufacturing Process and Equipment, Pts 1-4 694-697, 630-634.
Hansen, M.O.L., Sørensen, N.N., Flay, R., 2000. Effect of placing a diffuser around a wind turbine. Wind Energy 3 (4), 207-213.
Harrison, M., Batten, W., Myers, L., Bahaj, A., 2010. Comparison between CFD simulations and experiments for predicting the far wake of horizontal axis tidal turbines. Renewable Power Generation, IET 4 (6), 613-627.
Lago, L.I., Ponta, F.L., Chen, L., 2010. Advances and trends in hydrokinetic turbine systems. Energy for Sustainable Development 14 (4), 287-296.
Lawn, C., 2003. Optimisation of the power output from ducted turbines. Proceedings of the Institution of Mechanical Engineers, Part A: Journal of Power and Energy 217 (1), 107-117. Li, D., Wang, S., Yuan, P., 2010. An overview of development of tidal current in China: Energy resource, conversion technology and opportunities. Renewable and Sustainable Energy Reviews 14 (9), 2896-2905.
21
Luquet, R., Bellevre, D., Fréchou, D., Perdon, P., Guinard, P., 2013. Design and model testing of an optimized ducted marine current turbine. International Journal of Marine Energy 2, 61-80.
Mehmood, N., Zhang, L., Khan, J., 2012. Exploring the Effect of Length and Angle on NACA 0010 for Diffuser Design in Tidal Current Turbines. Applied Mechanics and Materials 201, 438-441.
Ohya, Y., Karasudani, T., Sakurai, A., Abe, K.-i., Inoue, M., 2008. Development of a shrouded wind turbine with a flanged diffuser. Journal of Wind Engineering and Industrial Aerodynamics 96 (5), 524-539.
Pelc, R., Fujita, R.M., 2002. Renewable energy from the ocean. Marine Policy 26 (6), 471-479. Ponta, F.L., Jacovkis, P.M., 2008. Marine-current power generation by diffuser-augmented floating hydro-turbines. Renewable Energy 33 (4), 665-673.
Reinecke, J., von Backström, T., Venter, G., 2011. Effect of a Diffuser on the Performance of an Ocean Current Turbine.
Scherillo, F., Maisto, U., Troise, G., Coiro, D.P., Miranda, S., 2011. Numerical and experimental analysis of a shrouded hydroturbine, Clean Electrical Power (ICCEP), 2011 International Conference on, pp. 216-222.
Shi, W., Wang, D., Atlar, M., Seo, K.C., 2013. Flow separation impacts on the hydrodynamic performance analysis of a marine current turbine using CFD. Proceedings of the Institution of Mechanical Engineers, Part A: Journal of Power and Energy.
Shives, M., Crawford, C., 2010. Computational Analysis of Ducted Turbine Performance, 3rd International Conference on Ocean Energy.
Tedds, S.C., Owen, I., Poole, R.J., 2014. Near-wake characteristics of a model horizontal axis tidal stream turbine. Renewable Energy 63, 222-235.
22
[image:22.595.97.503.380.714.2]Fig.1 Concept AUV with twin diffuser augmented tidal turbine (DATT)
Fig.2 BDA65-21 and BDA66-12 airfoil sections
-0.5 -0.4 -0.3 -0.2 -0.1 0 0.1 0.2 0.3 0.4 0.5
0 0.2 0.4 0.6 0.8 1
BDA65-21 AND BDA66 -12 AIRFOIL
23
[image:23.595.157.439.70.343.2] [image:23.595.84.516.339.706.2]Fig.3 Picture of basis axial turbine tested
Fig.4 Power coefficient of turbine without diffusers
0.00 0.05 0.10 0.15 0.20 0.25 0.30 0.35 0.40 0.45
2.00 3.00 4.00 5.00 6.00 7.00 8.00 9.00
P
OWE
R
COEFF
ICI
EN
T
(CP
)
TIP SPEED RATIO (TSR)
PERFORMANCE OF THE TURBINE WITHOUT DIFFUSERS
24
[image:24.595.71.525.463.705.2]Fig.5 Geometry description of diffuser
25
Fig.7 Main size of computational domain
[image:25.595.153.445.273.715.2]26
Fig.9 Variable parameter sensitivities on the mean flow velocity at the diffuser throat and on drag of diffuser
[image:26.595.78.518.400.711.2]27
Fig.11 Response surface of diffuser drag
Fig.12 Power coefficient variation of DATT system under different pressure jump values
0 0.1 0.2 0.3 0.4 0.5 0.6 0.7 0.8 0.9 1
0 100 200 300 400 500
P
OWE
R
COEFF
ICI
EN
T
(CP
)
[image:27.595.79.520.81.719.2]28
Fig.13 Single model DATT system installed in the measuring section of circulating water channel in Harbin Institute of Technology
[image:28.595.107.493.378.724.2]29
[image:29.595.92.505.69.525.2]Fig.15 Rheostats for loading control
30
Fig.17 Calibration of generator efficiency
0.30 0.35 0.40 0.45 0.50 0.55 0.60 0.65 0.70
290 340 390 440 490 540
GEN
ERATOR
EFF
ICI
EN
CY
ROTATIONAL SPEED (RPM) GENERATOR EFFICIENCY
150Ω 100Ω 80Ω 65Ω 50Ω 45Ω 40Ω
31
Fig.18 Installation of load cell arrangement for DATT
[image:31.595.74.524.403.715.2](Sketch on the left and actual installation photo on the right)
Fig.19 Comparison of power coefficients of DATT system with the turbine without diffuser based on model tests
0 0.1 0.2 0.3 0.4 0.5 0.6 0.7 0.8 0.9
2 2.5 3 3.5 4 4.5 5 5.5 6 6.5 7 7.5 8 8.5 9
P
OWE
R
COEFF
ICI
EN
T
(
CP
)
TIP SPEED RATIO (TSR)
RESULT OF POWER COEFFICIENTS
32
Fig.20 Comparison of system’s drag coefficients of DATT at two different blade pitch settings.
0.2 0.22 0.24 0.26 0.28 0.3 0.32 0.34
5 5.5 6 6.5 7 7.5 8 8.5 9
D
RAG
COEFF
ICI
EN
T
(
CD
/1
0
)
TIP SPEED RATIO (TSR) RESULT OF DRAG COEFFICIENTS