ASSISTED DIFFERENTIATED STEM CELL CLASSIFICATION IN INFRARED
SPECTROSCOPY USING AUDITORY FEEDBACK
Domenico Vicinanza
DANTE,
City House, 126-130 Hills Road,
Cambridge, CB2 1PQ, UK.
[email protected]
Ryan Stables
Digital Media Technology Lab,
Birmingham City University,
Birmingham, B4 7XG, UK.
[email protected]
Graeme Clemens, Matthew Baker
Centre for Materials Science,
University of Central Lancashire,
Preston, PR1 2HE, UK.
[email protected]
[email protected]
ABSTRACT
In this study we investigate ways in which data sonification can improve standard data analysis techniques currently employed in the analysis of stem-cells using Fourier Transform Infrared (FTIR) Spectroscopy. Four different sonification methods have been eval-uated and their effectiveness has been evaleval-uated through listen-ing tests, designed to assess the discriminatlisten-ing capability of the auditory technique. We identify FM synthesis driven by feature extraction as the most perceptually relevant technique for the au-ditory classification of FTIR data. Whilst this technique is not commonly used in sonification research, it allows us to utilise the most salient characteristics of the absorption spectra, leading to an improved classification accuracy with a clear timbral differences between differentiated and non-differentiated cell-types.
1. INTRODUCTION
The use of stem cells in biomedical applications is currently an area of interest given the vast potential that stem cells offer as a renewable source of material for the production of differentiated human tissues. However, there are still a number of challenges in stem cell biology and regenerative medicine, one of these being the understanding of whether the process of differentiation begun. This is a very important question due to the fact that undifferenti-ated stem cells can cause tumour formation when transplanted into a human host.
Current analytical methods used to discriminate between dif-ferentiated and undifdif-ferentiated cells are very time consuming, require the addition of potentially harmful exogenous biomark-ers and the cells are typically destroyed in or order for them to be analysed. Although their results are extremely useful for re-search, these methods are impractical for the screening of live stem
This work is licensed under Creative Commons Attribution Non Commercial (unported, v3.0) License. The full terms of the License are available at http://creativecommons.org/licenses/by-nc/3.0/.
cells and differentiated progeny. Since the introduction of Fourier Transform Infrared Spectroscopy (FTIR) an infrared absorption spectrum can be recorded in much shorter time periods, without the destruction of the sample, and more importantly, biological samples can be classified based on their biochemical absorption properties.
Whilst the majority of this classification is done using offline machine learning techniques, it is also useful to provide analysts with a means to rapidly search through large datasets of cells and selectively evaluate the probability of differentiation. To do this from the visual representation alone is very difficult, we therefore consider novel ways of data representation using sound.
2. VIBRATIONAL SPECTROSCOPY
Vibrational spectroscopy, such as Raman and FTIR are excellent techniques for the analysis of many materials due to their ease of use and requirement for simple sample preparation. The in-elastic (Raman) scattered light from molecules under irradiation is wavelength-shifted with respect to the incident light by molecular vibrations. The Raman spectrum is complementary to that of IR where incident light is absorbed at the resonant frequency of the bond or group, exciting vibrational modes. Different biomolecules exhibit responses to different wavelengths of light; the resultant spectrum can be thought of as a ”fingerprint” of the sample. Spec-troscopic analysis allows the objective classification of biological materials on a molecular level [1].
1000 1500 2000 2500 3000 3500 4000 −0.02
0 0.02 0.04 0.06 0.08 0.1 0.12
[image:2.612.61.303.72.198.2]1. 2. 3. 4. 5. 6. 7.
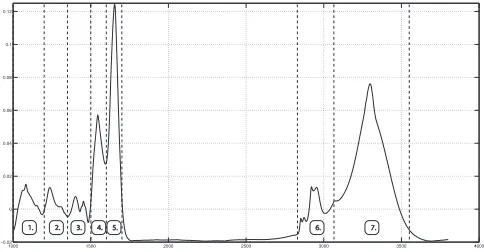
Figure 1: A typical Infrared absorption spectrum with subband di-visions. Horizontal axis represents wavenumber (cm−1), vertical axis intensity
suitable for real time analysis of spectra. An approach that enables the real time classification of different samples with auditory feed-back would further the clinical translation and enable spectroscopy to achieve its potential.
2.1. Infrared Spectroscopy
Infrared (IR) Spectroscopy is the measure of how IR radiation in-teracts with molecules, either through absorption, emission or scat-tering. Waves of IR radiation have frequencies between(3x10¹²
)-( 3 x10¹⁴) Hz and are found in the IR spectral region of the electro-magnetic (EMR) spectrum. For a molecule to absorb a wave of IR radiation, the wave has to have an energy which matches the en-ergy needed to excite the molecule from the ground state (v0) to an
excited vibrational energy state (v1). There is therefore a range of
spectral sub-bands which correlate with relevant molecular vibra-tions. Figure 1 shows the division of these bands in an absorption spectrum. Here, the bands represent the following molecular com-ponents: 1, C-O carbohydrates 2,P O2- nucleic acids 3, lipids and
proteins 4, N-H (amide II) proteins 5, C=O (amide I) proteins 6, C-H lipids 7, O-H/N-H proteins and carbohydrates.
2.2. Stem Cells in Biomedicine
The use of stem cells in biomedical applications is currently an area of interest given the vast potential that stem cells offer as a renewable source of material for the production of differentiated human tissues. However, there are still a number of challenges in stem cell biology and regenerative medicine, one of these being distinguishing stem cell and differentiated cell phenotype. This is important due to the fact that undifferentiated stem cells can cause tumour formation when transplanted into a human host. Cur-rent analytical methods used to discriminate between diffeCur-renti- differenti-ated and undifferentidifferenti-ated cells are very time consuming, require the addition of potentially harmful exogenous biomarkers and the cells are typically destroyed in order for them to be analysed. Al-though their results are extremely useful for research, these meth-ods are impractical for screening stem cells and their differentiated progeny.
Since the introduction of FTIR, an infrared absorption spec-trum can be recorded in much shorter time periods, without the de-struction of the sample, and more importantly, biological samples can be classified based on their biochemical absorption properties.
Recent studies have shown the applicability of FTIR to monitor the bio-molecular changes associated with the differentiation of stem cells into specialised cell populations therefore, showing the po-tential of the technique to monitor stem cell and differentiated cell phenotype, without the need for biomarkers/labels [8] [9] Whilst the majority of this classification is done using offline machine learning techniques, it is also useful to provide analysts with a means to rapidly search through large datasets of cells and selec-tively evaluate the probability of differentiation. To do this from the visual representation alone is very difficult, we therefore con-sider novel ways of representation using an auditory representation via sonification.
2.3. Scientific Data Sonification
Data sonification is, in general terms, the use of non-speech audio signals to convey information or perceptualise data [10]. Auditory perception of complex, structured information could have several advantages in terms of temporal, amplitude, and frequency reso-lution when compared to visual representations and often opens up possibilities for an alternative or complement to visualisation techniques [11]. These advantages include the capability of the hu-man ear to detect patterns, recognise timbres and follow different strands at the same time. This would offer, in a natural way, the opportunity of rendering different, interdependent variables into sound in such a way that a listener could gain relevant insight into the represented information or data.
In particular in the medical context, there have been several investigations using data sonification as a support tool for classifi-cation and diagnosis from working on sonificlassifi-cation of medical im-ages to converting EEG to tones, including real-time screening and feedback on EEG signals [12][13][14]. The technique described in this work aims to combine single and multi-dimensional data soni-fication techniques with data abstraction and classisoni-fication. Signal analysis and features extraction techniques have been employed to select the most effective parameters to potentially discriminate between two set of samples (differentiated and non differentiated cells). Those parameters have then been used to drive different sonification algorithms.
3. METHODOLOGY
The challenge of providing auditory feedback for IR spectroscopy is two-fold, we first need to identify statistically relevant charac-teristics of the absorption spectra and secondly need to map these features to perceptually relevant synthesis parameters. To explore this, we have implemented 4 different methods of sonification, each based on a commonly used synthesis technique. In order to evaluate the performance of each of the methods of synthesis, two experiments were conducted in order to get subjective feedback. In total, 35 subjects took part in the experiment, all with normal hearing. The participants were from either an analytical chemistry background or from an audio production background. The par-ticipants were both male and female, aged between 18-40, with normal hearing.
3.1. Experiment 1: Similarity
synthesis techniques, subjects were presented with pairs of sam-ples and asked to rate the similarity on a continuous scale, ranging
from0 ≤ n ≤ 1. If the pair was considered to be completely
dissimilar, a value of 0 was given, if the listener judged the pair to very similar, a value of 1 was given. Each listener was pre-sented with 20 pairs, randomly chosen from a set of 311 samples for each synthesis technique. For each pair, the samples were gen-erated using the same sonification technique, then the techniques were compared. The pairs consisted of either two samples from the same cell type, or two samples from different cell types. For a technique to perform well, the listener would have to assign a high value to pairs from the same cell type and a low scores to pairs from different cell types. when all tests were completed, the scores were analysed in order to compute similarity measurements for each synthesis technique.
3.2. Experiment 2: Clustering
As an additional measure of perceptual relevance, a multi-stimulus test was conducted in which subjects were presented with a group of 6 samples, some of which were taken from differentiated cells and some of which were taken from non-differentiated cells. Sub-jects were asked to put each of the samples into one of two possible subgroups, thus partitioning the samples based on empirical per-ceptual features. The ratio of cells from each group varied from 1:5 to 5:1 and the subjects were unaware of the group ratios. The classification error was then calculated and the sonification tech-niques were compared. Users were presented with 15 groups of 6 samples, each group was randomly selected from the dataset. For each group, only one synthesis technique was used to generate the samples.
4. SONIFICATION TECHNIQUES
In total, 4 techniques were explored, each with varying degrees of abstraction from the original absorption spectra. This is in-tended to demonstrate the perceptual salience of common soni-fication techniques when applied to spectroscopy data.
4.1. Peak-Spectral Formant Synthesis
The most intuitive approach used in the experiment was a simple formant synthesis technique. Here, the spectral envelope was used to derive the centre-frequencies and bandwidths of a set of five formant filters. The number of filters was fixed as each of the samples had a static number of bands. Here, each of the filters are defined using the transfer function:
Hn(z) =
1
(1−c0z−1)(1−c1z−1)
(1)
Wherec0 andc1 are parameters calculated from the
center-frequency and bandwidth of each formant. The individual filters are then combined using Eq 2 and used to process an impulse train, with a fixedf0of 1KHz.
H(z) =
N−1
X
n=0
Hn(z) (2)
In order to provide audible data, the peaks from the absorption spectra were rescaled in frequency to range between 20Hz-20KHz and normalised in amplitude.
4.2. Concatenative Synthesis
In order to directly control the timbre of the synthesised wave-form, the absorption spectra were simply concatenated in the time domain over a period of 3 seconds. Here, thef0is set to 1KHz,
which is a function of the sample rate and the FFT-size. This is modified using linear interpolation. In this method, the waveforms can be characterised by their cepstral representation. This shows the resulting harmonic configuration, caused by the relative peaks in the absorption spectra.
4.3. Time-seriesf0Conversion
One of the most frequently used approaches in data sonification is the use of an empirically derived trajectory for time-domainf0
modulation. Here, the data is normalised and the amplitude of the absorption spectra is rescaled using Eq. 3 and optionally quantised to pitch classes.
yn=Pmin+
(xn−qmin)(Pmax−Pmin)
qmax−qmin
(3)
In our case,qminandqmaxare set to 0 and 1 andpminandpmax
are set to 20 and 20,000 respectively, allowing us to cover the ma-jority of the auditory spectrum. In our implementation, we chose not to apply quantisation to allow for more variance in resulting waveforms.
4.4. Feature Selection
In an attempt to maximise the classification accuracy through ab-straction of the parameter set, the most salient properties of the absorption spectra were selected using variable ranking. This tech-nique is designed to isolate the most highly correlated feature vec-tors with a target set, thus assigning scores based on a feature’s ability to discriminate between two classes. To do this, an ex-tended feature-matrix was extracted from the absorption spectra which consisted of sub-band spectral moments (e.g: spectral cen-troid, skew, kurtosis) and their corresponding inter-band ratios. Each of the feature vectors were then ranked using the mutual in-formation metric, given in Eq. 4
r(i) =X
xi X
y
P(X=xi, Y =y)log
P(X=xi, Y =y)
P(X =xi)P(Y =y)
(4) Where,P(X = x, Y = y)refers to the joint distribution ofx
andy, andP(X =x)andP(Y =y)are the probability density functions ofxandyrespectively. The top three descriptors were then used as control signals for parameters of an FM synthesizer. These features were
1. Kurtosis Ratio between bands 6 and 3 (r = .548)
2. Kurtosis ratio between bands 6 and 5 (r = .491)
3. Skew of band 4 (r = .442)
Where the Kurtosis ratio is given in Eq 5 and the Skew is given in Eq 6.
xi= KK((bbi[3])
i[5]), K(y) = (
1
N
PN−1
i=0 [
yi−µ
σ ]
4)−3
xi=
1
N
N−1
X
i=0
[yi−µ
σ ]
3
(6)
Using the rescaling described in Eq. 3, the top three features were used to control thef0, the modulation index and the modulation
frequency respectively.
5. RESULTS
In order to evaluate each system’s ability to produce audible dif-ferences between the two cell types, the results from the listen-ing tests were analysed and the perceived dissimilarity across the two types was calculated for each technique. The results from the first experiment are shown in Figures 2 and 3, where Figure 2 il-lustrates the similarity measurements shown for each sonification technique. Here, each technique is divided into pairs consisting of two of the same sample (a), and pairs consisting of different samples (b).
0 0.1 0.2 0.3 0.4 0.5 0.6 0.7 0.8 0.9 1
peaks Concat F0 FS
Si
mi
la
ri
ty →
[image:4.612.332.547.81.250.2]a b a b a b a b
Figure 2: The relative similarity scores of paired listening tests. For each sonification technique,arepresents samples taken from the same cell type andbrepresents samples taken from different cell types.
From this data, we can then compute the subjective difference measurement for each technique using Eq. 7, thus demonstrating the relative success of each model. This measurement is illustrated in Figure. 3.
sd=
¯
a+ (1−¯b) 2
2
(7)
Wherea¯, and¯b represents the respective means of the pair groupsaandb.
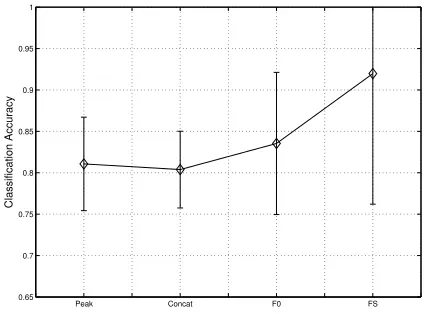
Both of these figures suggest the feature selection technique significantly outperforms the other methods of sonification with a score of 0.68. To evaluate this further, the results from the cluster-ing experiment are displayed in Figure 4. Here, the classification accuracy is given over the full range of selected samples for each technique.
Peaks Concat F0 FS 0
0.05 0.1 0.15 0.2 0.25 0.3 0.35 0.4 0.45 0.5
[image:4.612.68.292.309.479.2]Subjective Difference
Figure 3: The subjective difference across each of the sonification techniques, measured using audio from two cell-types, computed using Eq. 7.
Peak Concat F0 FS
0.65 0.7 0.75 0.8 0.85 0.9 0.95 1
Classification Accuracy
Figure 4: Subjective classification accuracy taken from listeners assigning labels to groups of six samples.
Generally, people were able to group the samples from the feature selection method with a higher degree of accuracy. Here, the accuracy for the feature selection technique was 91.9%, this is 11% higher than the nearest technique. Whilst this demonstrates that participants were able to successfully classify samples from this sonification technique, there is also a high variance, suggesting results were somewhat inconsistent.
6. DISCUSSION
[image:4.612.335.547.337.494.2](a) Class 1: Sample 1 (b) Class 1: Sample 2 (c) Class 1: Sample 3
[image:5.612.85.535.81.392.2](d) Class 2: Sample 1 (e) Class 2: Sample 2 (f) Class 2: Sample 3
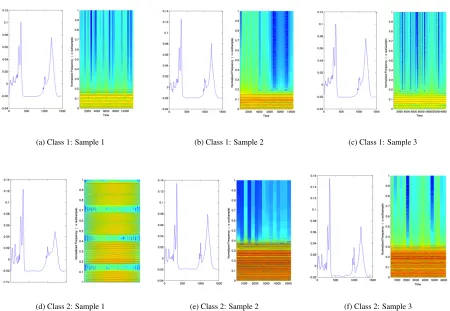
Figure 5: Sonograms from audio samples created using FM-synthesis driven by feature extraction. Here, class 1 represent non-differentiated samples and class 2 represent differentiated samples.
of abstraction caused by the feature selection process allows us to use the most salient characteristics of the absorption spectra, rather than some arbitrary features, derived implicitly through the synthesis technique. The feature selection process allows us to ef-fectively improve the classification accuracy, thus creating clear timbral differences between the two cell-types.
This effect is demonstrated in Fig. 5, here the spectrograms show a clear difference between the harmonic content of the dif-ferentiated and non-difdif-ferentiated cell types. In class 1 there are much fewer harmonics, whereas in class 2 the spectral peaks are much more densely populated, leading to a higher inharmonicity measure. Perceptually, this means the timbre of the differentiated cells is much rougher, with a very distorted sound. This timbral variance between cell types is also reflected in the results, Figure 2, for example shows the technique is capable of producing sounds that are perceived as different when different cell types are soni-fied and sounds that are perceived as similar when samples from the same cell type are sonified.
7. CONCLUSION
Whilst the evaluation procedure is still at an early stage, the pre-liminary results indicate that the feature selection method
signifi-cantly out performs the other 3 techniques in terms of perceptual relevance, and ultimately subjective classification accuracy. The combination of feature extraction and FM synthesis, with timbre parameters controlled by kurtosis and skew ratios of selected bands in the absorption spectrum, demonstrates promising results in the auditory discrimination of differentiated and undifferentiated cells for stem cell research.
8. ACKNOWLEDGEMENTS
The authors acknowledge Prof. P. Gardner (University of Manch-ester), Prof. S. Przyborski and Prof A. Whiting (University of Durham), Dr. K. R. Flower and Dr. A. P. Henderson for the use of the spectral dataset used in this study.
9. REFERENCES
[1] Taylor SE et al. ”Infrared spectroscopy with multivariate analysis to interrogate endometrial tissue: a novel and ob-jective diagnostic approach” Brit. J. Cancer, 104, 2011; 790-797
histopathology of metastatic brain cancer and primary sites of origin”. Anal. Methods, 2014 Advance Article. http://link.springer.com/article/10.1007
/s00216-013-7163-z
[3] Baker, et al. ”Attenuated Total Reflection Fourier Trans-form Infrared (ATR-FTIR) spectral discrimination of brain tumour severity from serum samples”. Journal of Biopho-tonics, Special Issue: Photonic Biofluid Diagnostics, Vol-ume 7, Issue 3-4, pages 189:199, April 2014.
[4] Baker, Clemens, et al. ”Investigating the use of Raman and immersion Raman spectroscopy for spectral histopathology of metastatic brain cancer and primary sites of origin”. An-alytical Methods, 2014.
[5] Trevisan, Angelov, et al. ”Extracting biological information with computational analysis of Fourier-transform infrared (FTIR) biospectroscopy datasets: current practices to future perspectives ”. Analyst, 2012,137, 3202-3215.
[6] M.J. Baker, et al. ”ToF-SIMS PC-DFA analysis of prostate cancer cell lines”. Applied Surface Science, Volume 255, Pages 1084:1087, Issue 4. December 2008.
[7] M.J.Baker at al, ”FTIR-based spectroscopic analysis in the identification of clinically aggressive prostate cancer”. British Journal of Cancer (2008) 99, 1859:1866.
[8] G. Clemens at al. ”The action of all-trans-retinoic acid (ATRA) and synthetic retinoid analogues (EC19 and EC23) on human pluripotent stem cells differentiation investigated using single cell infrared microspectroscopy”. Molecular BioSystems, Issue 4, 2013.
[9] J. Cao, et al. ”The Characterisation of Pluripotent and Multipotent Stem Cells Using Fourier Transform Infrared Microspectroscopy” Int J Mol Sci., Sep 2013; 14(9); 17453:17476
[10] Kramer, Gregory, ed. ”Auditory Display: Sonification, Audification, and Auditory Interfaces”. Santa Fe Institute Studies in the Sciences of Complexity. Proceedings Vol-ume XVIII. Reading, MA: Addison-Wesley. ISBN 0-201-62603-9.
[11] Ben-Tal, et al. ”De natura sonoris: Sonification of complex data.” Mathematics and Simulation with Biological, Eco-nomical, and Musicoacoustical Applications (2001): 330.
[12] Kagawa, et al. ”A supporting Method of Medical Diagnosis with Sonification” Complex, Intelligent and Software Inten-sive Systems (CISIS), 2012 Sixth International Conference.
[13] Hermann, Meinicke, et al ”Experiments in Sonification of EEG Signals”. International Conference on Auditory Dis-play (ICAD), Kyoto, Japan, 2002.