City, University of London Institutional Repository
Citation
:
Dykes, J. and Bleisch, S. (2006). Planning Hikes Virtually: How Useful are Web-based 3D Visualizations?. Paper presented at the GIS Research UK 14th AnnualConference (GISRUK 2006), 5 - 7 Apr 2006, University of Nottingham, Nottingham, UK.
This is the unspecified version of the paper.
This version of the publication may differ from the final published
version.
Permanent repository link:
http://openaccess.city.ac.uk/401/Link to published version
:
Copyright and reuse:
City Research Online aims to make research
outputs of City, University of London available to a wider audience.
Copyright and Moral Rights remain with the author(s) and/or copyright
holders. URLs from City Research Online may be freely distributed and
linked to.
City Research Online: http://openaccess.city.ac.uk/ [email protected]
USING WEB-BASED 3D VISUALIZATION FOR PLANNING HIKES
VIRTUALLY – AN EVALUATION
Susanne Bleisch
1, Jason Dykes
21
University of Applied Sciences Northwestern Switzerland (FHNW), CH – 4132 Muttenz Tel. +41 61 4674 398 Fax +41 61 4674 460 Email [email protected]
2
giCentre, School of Informatics, City University London, EC1V OHB Tel. +44 20 7040 8906 Fax +44 20 7040 8584 Email [email protected]
KEYWORDS: 3D visualization, web-based, geovisualization, combining realistic and abstract information, usability
1. INTRODUCTION
A range of recently developed technologies has made it increasingly straightforward to digitally visualize information in interactive three-dimensional forms. Realistic 3D visualizations may be understood more intuitively than traditional maps [1][2] and distributing them over the Internet makes them accessible to a wide audience [3]. They are also popular as demonstrated by the rapid advances and widespread uptake associated with desktop Virtual Reality environments or 'geo-browsers' such as Google Earth [4] or NASA's World Wind [5]. But are these forms of representation effective when used for particular activities - to help support successful task completion? And does their use lead to any particular biases or behaviours?
Geovisualization applications are frequently technology driven but whilst we continue to build exciting and impressive applications the need for evaluating them in supporting particular tasks is paramount [6]. Here we address a particular need and test a desktop 3D visualization technology in a specific context and with a predetermined and real task set. Hiking is the most popular recreational activity amongst the Swiss [7] and the tourism organisations and other agencies are looking for ways to promote their region and support hiking [8]. We explore the usefulness of an interactive 3D application that provides web-based ‘realistic’ visualization in the context of planning hikes in the foothills of the Swiss Alps. Our 3D maps are photorealistic, but enhanced with abstract information that is valid to the task in hand, such as a hiking route and spot heights. The assessment of usefulness includes aspects of both, utility (the tools performance regarding a specific task) and usability (the users efficiency and satisfaction with a tool), as defined in the field of human-computer interaction design [9]. Whilst many different sources may be consulted when planning hikes we test the 3D visualization as the sole tool used in this study. Doing so enables us to evaluate its usefulness in isolation and make inferences about its potential contribution to hike planning and the possible effects of using it as part of this process.
1.1 VISUAL REALISM IN A 3D ENVIRONMENT – BACKGROUND, DATA AND VISUALIZATION
print-based traditional map, concluding that the 3D visualization is generally more effective in
communicating the information presented. However, studies also indicate that the acceptance and utilization of 3D cartography is relatively low amongst certain groups and the effort required to learn to use it effectively can be very high when compared with the increase in knowledge achieved [2].
This investigation focuses on a digital environment that combines digital elevation models and photorealistic imagery with additional abstract information to support hike planning. We use the Virtual Reality (VR) technologies from Geonova AG - software tools that allow highly interactive 3D visualizations to be generated from digital terrain models and ortho imagery and subsequently
distributed over the Internet. The elevation data used for the 3D visualization in this study is the DHM25, the most frequently used digital height model of Switzerland with a resolution of 25m. Our study focuses on an area in the heart of Switzerland that permits moderate hiking between 430 and 2400 metres above sea level. The area is established but far from notorious amongst hikers and representative of many similar regions, enabling us to compare users who know the region with those who are new to it and to generalise our results to other areas of similar geography. To facilitate the comparison, the 3D representation contains approximately the same information as the traditional Swiss National Maps (LK25). There are some key differences however - whilst on the map the third dimension is encoded using contour lines and spot heights, this information is represented by
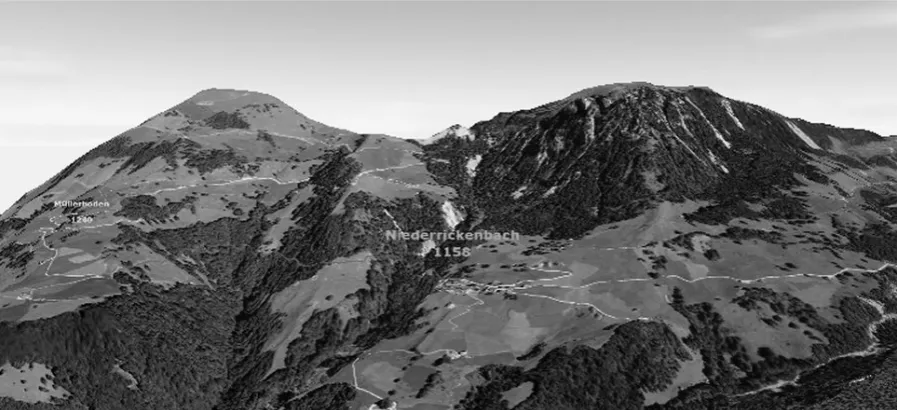
perspective views of the digital elevation model in the 3D scene. Lange [16] shows that draping ortho images over terrain is the most important element for generating virtual environments that are
perceived as ‘realistic’. Following Lange [16] we drape ortho imagery with a resolution of 0.5m over the elevation model (Figure 1). This approach is typical of many of the current wave of geo-browsers. Another key difference thus relates to the way that land cover is represented. On the map it is pre-interpreted and represented through coded symbols whilst the 3D visualization employs the un-interpreted ortho imagery to show land cover. MacEachren et al. [18] recommend cartographic designs for virtual environments that combine abstract and realistic representations of geographic phenomena. For this study abstract vector information showing a hiking route, spot heights and place name labels were added to the 3D visualization (Figure 1). Similar information is available in
traditional panoramic representations of tourism regions (e.g. [19]). The addition of only one specific hiking route ensures that all participants of the study refer to the same route when attempting the tasks. One significant difference relating to information content is that place names and height labels are less dense in the 3D representation than in the 2D LK25 so that the 3D scene is not overcrowded with labels.
1.2 PLANNING OF HIKES
The Swiss Federal Office of Sports has a program called "Youth & Sport" (J&S) with guidelines describing the sequence of events involved in planning a hiking tour [20]. The J&S instructions are used as guidelines for measuring the utility of the 3D visualization for planning hikes. The map related parts of the guidelines can coarsely be divided into three categories: getting an overview of a hiking region, which means studying maps and getting a feeling for the region and its topography; selecting a suitable route; and planning the hike in detail, for example, by checking the heights, steepness of slope and distances. This is often an iterative process.
2. DATA COLLECTION AND ANALYSIS
2.1 TASKS
A number of specific tasks were designed to represent hike-planning activities by converting the guidelines from each of the the J&S categories into questions. Tasks that had been designed for paper-map hike planning [20], [24] were analysed according to their information content and
translated into questions that required the same information to be acquired by interacting with the 3D visualization. For example, a height profile is created during the paper-map planning stage because this information is regarded as being difficult to interpret from contour lines in the 2D map. The contention that realistic 3D visualizations are more intuitive than traditional maps [1], [2] suggests that information about steep sections or the highest and lowest points of a route may be visually interpreted directly from the oblique views of the 3D visualization by interacting with the model. To fulfil the tasks the users were encouraged to navigate around the 3D visualization. Use of the mouse to control viewing position and to fly across the landscape was explained to all participants.
2.2 QUESTIONNAIRE AND INTERVIEWS
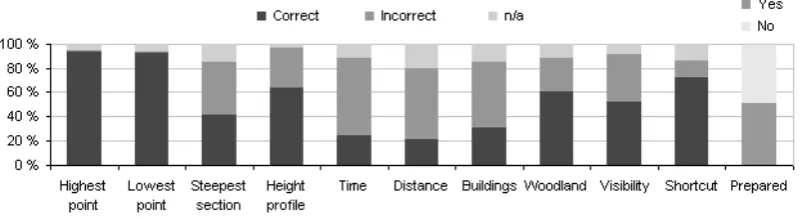
A series of questions about the specific tasks were designed to record activities undertaken and levels of task completion (Figure 3 and Figure 4 show task titles that summarise the questions used here). Users were also asked to record their feelings about the ease of task completion and their confidence in the results. Details about prior map reading skills, knowledge of the region, prior contact with 3D visualization applications and demographic status were also recorded [25]. Multiple choice questions were employed in some cases with one or more answer possibilities. Where appropriate a "Don't know" or "Other" category was added with opportunities to provide further explanation to allow for omitted answers [26]. Short answer (closed) questions that could also be quantitatively analysed were used for some of the tasks - for example for finding the steepest part of the hike. Open-ended
questions allowed the participants to express their thoughts and feelings about using the visualization. To generate more qualitative information and to follow up on written statements, interviews were conducted with a sample of respondents [27]. This allowed us to validate our interpretations of the responses from those participants and explore some of the reasons behind them.
2.3 THE SAMPLE
The population that can be sampled for the purpose of this study consists of all people interested in hiking in the foothills of the Swiss Alps. The application and questionnaire were publicized through the Internet, through hiking websites and communicated to hiking contacts via Email. All hikers informed about the study were asked to further distribute the information to acquaintances interested in hiking. As both the 3D visualization and the questionnaire were made accessible over the Internet only hikers with some IT knowledge were able to participate in the study. A subset of those who completed the questionnaire were interviewed. Producing an unbiased sample of this diverse
population is an extremely difficult task [25]. The sample of the hikers reached through the methods described in this study may not be wholly representative of the background population. The findings are thus applicable only to this sample, but due to the similarities between the characteristics of those used in the sample and a section of the background population they may be more widely relevant to hikers who are digitally aware and empowered by the Internet. These are likely to be those who use geo-browsers and to whom tourism agencies may want to promote hiking through interactive 3D cartography.
2.4 DATA ANALYSIS
Quantitative data were analysed graphically and where appropriate with statistical comparison techniques to investigate possible differences in successful task completion between: gender,
techniques, but predominantly through qualitative methods including content analysis [28]. The qualitative data was used to contextualise and help us interpret the quantitative findings.
3. RESULTS AND FINDINGS
Approximately 600 people were informed about the study and 99 participants completed the
questionnaire. A further 68 people did not fill in the questionnaire completely or provided other forms of feedback, such as not being able to access the 3D visualization or feeling motion sick when
navigating. The questionnaire reached people from a full range of ages and about a quarter of the participants were women. Notably, most participants claimed to have 'very good' or 'good' map reading skills. More than two-thirds of the participants stated that they had come into contact with 3D visualizations prior to the study, perhaps suggesting a bias in the sample that may be associated with the Internet-based nature of both the software used and the dissemination techniques employed. More than half of the participants (58%) did not know the region. Qualitative statements from the open-ended questions in the questionnaire and interviews were used to triangulate the quantitative data obtained through the questionnaire.
3.1 GETTING AN OVERVIEW OF A REGION
Responses to tasks associated with the first of the J&S hike planning categories are summarised in Figure 2. They show that 56% of the participants preferred the realistic 3D visualization over the map for the task of 'getting an overview or an impression of an unknown region' (41% of these with and 59% without prior knowledge of the region). 76% of the participants preferred the 3D visualization for virtually 'revisiting' a known region (43% of these with and 57% without prior knowledge of the region). 78% preferred the 3D visualization for helping with the decision as to whether to visit the region for hiking (41% with and 59% without prior knowledge of the region). These results suggest that users without prior knowledge of the study area have a stronger preference of using the 3D visualization for any of the three tasks. However, employing a Chi-square test reveals that these differences are not significant at the 0.05 level. The possible advantages of the 3D visualization over the 2D map for this stage of the hike planning are evidenced through the content analysis which highlighted a sizeable number of positive statements about hike planning using 3D: "it is faster to get
an overview of a hike (where does it lead through) or region with the 3D visualization"; "it is possible
to know what the views from a specific point on the hike will be"; "it is more intuitive to comprehend
the topography of the region".
3.2 SELECTING A SUITABLE ROUTE
The second stage of hike planning involves selecting a suitable hiking route by detecting possible tracks on the orthophoto draped over the DEM. 56% of the participants were able to locate routes along streets and clearly visible paths. 15% located concealed or less visible paths such as those across pastures or through woodland. For selecting routes 68% of the participants prefer to use the traditional map. However, 12 participants mentioned that this would change in favour of the 3D visualization if more than one hiking route was included in the visualization. This coincides with participants' statements that the ortho imagery by itself is difficult to interpret for exact information extraction as, in contrast with most traditional 2D maps, the realistic content is not pre-interpreted and highlighted by cartographers. This supports the contention of MacEachren et al. [18].
3.3 EXTRACTION OF EXACT INFORMATION
points can be extracted directly from height labels in the 3D visualization. This corresponds with qualitative feedback on the importance of the height labels in the 3D scene.
Tasks like estimating the length of a hike section or finding the steepest section of the hike were rarely solved satisfactorily in the 3D visualization. Only 22% of the participants estimated the length of a 3km-section of the hike to within ±500m1. On average they overestimated the length of the
section by 700m (23%) with a high standard deviation of 1.5km. One or both of the two steepest sections of the hike were identified by 41% of the participants. These findings further support the suggestion that ancillary information, such as distance or height information or measuring tools, is needed when using realistic environments to help the successful completion of some tasks that are deemed essential in planning hikes. One clear trend was identified: 58% of the incorrect answers to the question about the steepest section selected the longest steep section, but this did not contain the steepest slope as measured between adjacent cells at a scale equivalent to the resolution of the DEM. The finding that a minority of participants were able to identify the steepest section at this scale may be surprising as 3D maps are believed to be "understood more intuitively". Such judgements may relate to the fact that slope is a scale-dependent property. This suggests that whilst the form of the landscape might be "understood", the nature and scale of its variation may not be interpreted accurately or effectively from the 3D visualization. Alternatively, participants may have used their experience of longer shallower sections being harder hiking than the short steeper sections in
completing this task. The content analysis of our qualitative data identified three statements in support of this interpretation - noting that it is difficult to estimate the steepness of slopes in the 3D
visualization. Our data also show that those who solved the different tasks of extracting exact
information from the 3D visualization correctly were not confident that this was the case - associating considerable uncertainty with this task.
The conflicting overestimation of distance and likely misinterpretation of slope and the associated uncertainty suggest some difficulties in effectively planning hikes using the 3D visualization software evaluated here. Importantly in this context, even though almost all participants were unable to use the 3D visualization to extract exact information with confidence 51% of them felt sufficiently prepared to go hiking having used the 3D representation. These possible misinterpretations could have serious consequences. More than half of those 51% who stated that they felt sufficiently prepared also indicated that they did not have prior knowledge of the hiking area.
The participants were asked what they thought was missing from the 3D visualization. 71% suggested additional abstract height, time and/or distance information in forms such as labels, contour lines, reference grids or measuring tools, highlighting the need for additional abstract information and functionality to support specific tasks. Others desired additional functionality such as hotel or travel information or the automatic generation of height profiles. As neither of these features can be found in the traditional map it seems that the new technology has resulted in demands for new functionality and possibilities in general. But as shown by the rather poor task performance (see Figure 4) it also seems that the participants were not able to satisfy their information needs for hike planning from a 3D visualization environment consisting solely of a digital elevation model with draped ortho imagery and limited abstract ancilliary information. The widely accessed geo-browsers discussed in section 1 consist predominantly of precisely this combination and our findings therefore suggest that solely using such tools for hike planning may be problematic.
3.4 DIFFERENCES BETWEEN USER GROUPS
1
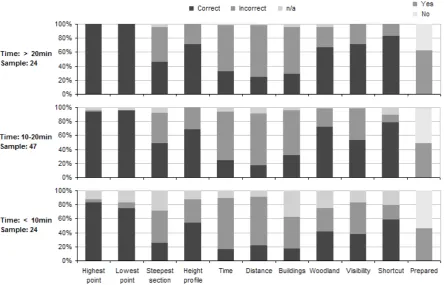
The tasks were evaluated in the light of differences between subgroups of participants using Chi-square tests at a 0.05 significance level. Tests for differences between gender, occupation, age and prior technical experience with 3D visualizations suggested some trends but revealed no significant differences in relation to any of the findings reported above. Significant differences were found for some tasks when users were categorised according to completion time. Figure 4 shows that many tasks were solved more successfully by participants who spent longer with the 3D visualization. The group with prior technical experience of 3D visualizations also solved some of the tasks with more success than the group without, though this was not a statistically significant difference. These results at least suggest that those who are more familiar or spend more time with 3D visualizations (which may indicate a greater willingness to familiarise with the application) may find them more useful. Another trend relates to those who regarded themselves as having less accomplished map reading skills. This group of 9 participants is a small sample of users, but their poor performance in the tasks warrants further investigation. Despite their inability to successfully complete the preparation tasks, this group felt best prepared for going hiking after completing the tasks in comparison to all other groups (e.g. in comparison with the group with more advanced map reading skills and also those groups relating to gender, age, completion-time, etc.). Interestingly, the questionnaire data contained 13 statements from participants who mostly consider themselves as being proficient map readers suggesting that realistic 3D visualizations might be most useful for moderate or poor map readers.
Evaluating the task performance of those with previous knowledge of the study area and those without yields almost no differences between these two groups. Only the task involving identifying the location of the steepest section seems to benefit slightly from prior knowledge of the area.
4. CONCLUSIONS AND OUTLOOK
Some sections of the public seem extremely interested in the new possibilities associated with planning hikes virtually. The findings reported here suggest that web-based 3D visualizations that combine realistic and abstract information may be helpful additions to the paper map for some when planning hikes but as implemented for our tests in the Geonova AG software are not suitable
replacements. We also identify some possible risks associated with hike planning using 3D
visualization software. Whilst use of the visualization software was not directly compared to use of the LK25 in this study the experienced hiker seems to base their judgements of the usefulness of the 3D visualization for planning hikes according to this comparison. This argument is supported by a number of related statements such as "nothing will ever be able to replace the LK25" or "I would
never plan a hike without the LK25". We note that the methods employed here, whereby participants
were asked to self-report on their task performance may lead to statements that do not reflect the true value or usefulness of the 3D visualization [25].
small and controllable, needs further research due to the potential dangers involved in
underestimating hazards when planning hikes. Gradient is scale dependent and the question about steep slope made no assumptions about measurement scale. The selection of a less steep larger-scale feature by many participants, rather than a steeper smaller-scale slope adds weight to the argument that users of desktop VR may underestimate the scale of the features with which they are interacting. In this sense, photorealistic 3D environments may be virtually unrealistic. We also identify some inconsistencies between the ways in which users think that tasks have been completed when using 3D visualizations and actual successful task completion. This may be related to the trend noted by
Appleton and Lovett [17] who found that people self-report being better able to imagine the landscape and relate to the 3D visualization with increased levels of detail. These issues are important in
applications of visualization that are associated with significant safety issues and should be of particular concern to those promoting hiking using the kind of 3D interfaces to landscape evaluated here.
The findings draw attention to a number of opportunities for further research. We may be able to identify groups of task or user for which / whom 3D visualizations may be a better choice than 2D representations or usefully enhance 2D displays in combination. The result that participants
predominantly prefer the 3D visualization over the 2D map for 'getting an overview' tasks but request more abstract information or the use of the 2D map for extracting exact information indicates that a combination of 2D and 3D representations may be sensible. Thus, each visualization type may be used for the tasks for which it is most useful. Our continuing research examines how abstract
information can best be combined with and represented in 3D environments that are designed to look realistic. Preliminary results show that users are not significantly influenced by topographic
information such as distance or elevation differences when comparing the heights of abstract symbols in virtual environments. Further research may include the exploration of scale in 3D desktop-based landscape visualizations. Using larger surveys with more varied terrain may allow exploring whether responses and task completion success varies not only with the familiarity or the time spent with the application but rather with the environment (e.g. terrain variability, route length, height discrepancy). The participant's requests for more abstract information and functionality could be taken into account (for example, by using more abstract or pre-interpreted terrain covers instead of the ortho imagery). Related to this, other researchers are investigating the use of (photo-) realism as visual variable [31]. A different study [32] has shown that draping a digital terrain model with a 2D map or leaving it undraped does not influence the estimation of walking times or of gradients. Employing more abstract information or combining 2D and 3D visualizations may result in users who are more confident in their findings. Research undertaken on the technical and human aspects of using 3D visualizations with additional abstract information in the field (e.g. [33], [34]) may also help in making 3D visualizations more useful as hike planning tool . The assessment of the risks resulting from overstimating distances, understimating the size or steepness of landscape features or poor map readers feeling prepared for going hiking is an important area for additional research.
5. ACKNOWLEDGEMENTS
The creation of the 3D visualizations has been possible thanks to data from LIS Nidwalden AG and the free use of Geonova AG software. We appreciate the feedback provided by those who reviewed an extended abstract of this paper submitted to GISRUK 06 and those who participated in discussion during the subsequent visualization session at the meeting. Their comments and suggestions have informed our study and helped shape the work as presented here. The authors also thank the two anonymous reviewers of this chapter for their comments and suggestions which have been used to improve the work.
[1] Meng, L., Missing Theories and Methods in Digital Cartography, in Proceedings of the 21st
International Cartographic Conference, 10-16 August 2003, ICA, Durban, 2003.
[2] Rase, W.D., Von 2D nach 3D - perspektivische Zeichnungen, Stereogramme, reale Modelle,
in Kartographische Schriften, Band 7: Visualisierung und Erschliessung von Geodaten,
Deutsche Gesellschaft für Kartographie, Hannover, 2003, 13-24.
[3] Treinish, L.A., Web-based Dissemination and Visualization of Operational 3D Mesoscale Weather Models, in Exploring Geovisualization, Dykes, J., MacEachren, A.M. and Kraak, M.-J., Eds., Elsevier, Amsterdam, 2005, 403-422.
[4] Google, Google Earth – Explore, Search and Discover, [online] http://earth.google.com/, 2008.
[5] NASA, World Wind, [online] http://worldwind.arc.nasa.gov/, 2008.
[6] Fuhrman, S. et al., Making Useful and Useable Geovisualization: Design and Evaluation Issues, in Exploring Geovisualization, Dykes, J., MacEachren, A.M. and Kraak, M.-J., Eds., Elsevier, Amsterdam, 2005, 553-566.
[7] Kromer, F.K. et al., Leitbild Langsamverkehr Teilbereich Wandern, Riehen, 2001.
[8] Almer, A. and Stelzl, H., Multimedia Visualisation of Geoinformation for Tourism Regions based on Remote Sensing Data, in Proceedings of the Technical Commission IV/6, ISPRS Congress, 8-12 July 2002, Ottawa, 2002.
[9] Rinner, C., A Geographic Visualization Approach to Multi-Criteria Evaluation of Urban
Quality of Life, Working Paper, Workshop Visualization, Analytics & Spatial Decision
Support, GIScience 06, 20 September 2006, Münster, 2006.
[10] Peterson, M.P., Elements of Multimedia Cartography, in Multimedia Cartography, W. Cartwright, M.P. Peterson, and G. Gartner, Eds., Springer-Verlag, Berlin, 1999, 31-40. [11] Cartwright, W. and Peterson, M.P., Multimedia Cartography, in Multimedia Cartography, W.
Cartwright, M.P. Peterson, and G. Gartner, Eds., Springer-Verlag, Berlin, 1999, 1-10. [12] Troyer, M., The world of H.C. Berann, [online] http://www.berann.com/, 2007. [13] Imhof, E,. Bern-Lötschberg-Simplon. Vogelschaukarte, [online]
http://www.maps.ethz.ch/imhof/imhof7/, 1922.
[14] Memory-Map, Memory-Map, [online] http://www.memory-map.co.uk/, 2008.
[15] Dickmann, F., Mehr Schein als Sein? Die Wahrnehmung kartengestützer Rauminformationen aus dem Internet, Kartographische Nachrichten, 2, 61, 2004.
[16] Lange, E., The degree of realism of GIS-based virtual landscapes: implications for spatial planning, in Photogrammetric Week '99, Fritsch, D., Spiller, R., Eds., Wichmann, Heidelberg, 1999, 367-374.
[17] Appleton, K. and Lovett, A., GIS-based visualisation of rural landscapes: defining ‘sufficient’ realism for environmental decision-making, Landscape and Urban Planning, 65, 117, 2003. [18] MacEachren, A.M, Kraak, M.-J., and Verbree, E., Cartographic issues in the design and
application of geospatial virtual environments, in Proceedings of the 19th International
Cartographic Conference, 14-21 August 1999, ICA, Ottawa, 1999.
[19] Schatzalp Davos, Wanderkarte Schatzalp, [online] http://www.schatzalp.ch/download/Karte2007.pdf, 2008.
[20] Lehner, P. and Von Dach, J., Lagersport/Trekking, Trekking - unterwegs sein, Bundesamt für Sport, Magglingen, 2004.
[21] Ware, C., Information Visualization: Perception for Design, 2nd, Morgan Kaufman Publishers, San Francisco, 2004.
[22] Gabbard, J.L., Hix, D., and Swan, J.E.I., Usercentered design and evaluation of virtual environments, IEEE Computer Graphics and Applications, 19(6), 51, 1999.
[23] Kirschenbauer, S., Applying "True 3D" Techniques to Geovisualization: An Empirical Study,
in Exploring Geovisualization, Dykes, J., MacEachren, A.M. and Kraak, M.-J., Eds.,
Elsevier, Amsterdam, 2005, 363-387.
[24] Gurtner, M., Karten lesen: Handbuch zu den Landeskarten, SAC-Verlag and Bundesamt für Landestopographie, Bern, 1995.
[25] Elmes, D. G., Kantowitz, B. H., and Roediger, H. L., Research Methods in Psychology. 8th, Thomson Wadsworth, Belmont, 2006.
http://www.sysurvey.com/tips/whitepapers.asp, 2002.
[27] Rudestam, K.E. and Newton, R.R., Surviving your Dissertation A Comprehensive Guide to
Content and Process, 2nd, Sage Publications Inc, Thousand Oaks, 2001.
[28] Kitchin, R. and Tate, J.T., Conducting Research into Human Geography – Theory,
Methodology and Practice, Pearson Education Ltd, Harlow, 2000.
[29] Gurtner, M., Karten lesen Handbuch zu den Landeskarten. Schweiz. Bundesamt für Landestopographie and Schweizer Alpen Club, Bern, 1995.
[30] Bodum, L., Modelling Virtual Environments for Geovisualization: A Focus on
Representation, in Exploring Geovisualization, Dykes, J., MacEachren, A.M. and Kraak, M.-J., Eds ,Elsevier, Amsterdam, 2005, 389-402.
[31] Fabrikant, S. I. and Boughman, A., Communicating Data Quality through Realism, in
Geographic Information Science, IfGIprints, Fourth International Conference, GIScience
2006, Münster, 269-271, 2006.
[32] Wood, M., Pearson, D. G. and Calder, C., Comparing the effects of different 3D
representations on human wayfinding, in Location Based Services and TeleCartography, Gartner, G., Cartwright, W., and Peterson, M. P., Springer, Heidelberg, 2007, 345-356. [33] Coors, V. et al., Presenting Route Instructions on Mobile Devices: From Textual Directions
to 3D Visualization, in Exploring Geovisualization, Dykes, J., MacEachren, A.M. and Kraak, M.-J., Eds., Elsevier, Amsterdam, 2005, 529-550.
[image:10.595.73.522.376.581.2][34] Edwardes, A., Burghardt, D., and Weibel R., Webpark – Location Based Services for Species Search in Recreation Area, in Proceedings of the 21st International Cartographic Conference, 10-16 August 2003, Durban, 2003.
Figure 2: 3D visualization or map preferences subdivided by prior knowledge of the study region (graphic area per task = 100%)
[image:11.595.98.501.312.421.2]Figure 4: Hike planning tasks by the time spent answering the questions. A trend towards higher proportions of correct answers amongst participants spending more time with the 3D visualization is
shown. This trend is significant for finding the lowest point, the steepest section, the number of buildings, the woodland and the intervisilibity. Participants who spent more time with the 3D