Attention Assessment in Visual Content
Interaction
Georgia Elafoudi1, Vladimir Stankovic1, Lina Stankovic1, Deepti Pappusetti2, Hari Kalva2
1 Department of Electronic and Electrical Engineering, University of Strathclyde,
Glasgow, UK
{georgia.elafoudi, vladimir.stankovic, lina.stankovic}@strath.ac.uk
2 Department of Computer and Electrical Engineering and Computer Science,
Florida Atlantic University, Boca Raton, Florida, USA?
{dpappuse, hari.kalva}@fau.edu
Abstract. Eye movements and changes in pupil dilation are known to
provide information about viewer’s attention and interaction with visual content. This paper evaluates di↵erent statistical and signal processing methods for autonomously analysing pupil dilation signals and extracting information about viewer’s attention when perceiving visual information. In particular, using a commercial video-based eye tracker to estimate pupil dilation and gaze fixation, we demonstrate that wavelet-based sig-nal processing provides an e↵ective tool for pupil dilation asig-nalysis and discuss the e↵ect that di↵erent image content has on pupil dilation and viewer’s attention.
1
Introduction
Objectively assessing users’ experience when interacting with visual content is gaining increased research interest due to its relevance for numerous applications ranging from video compression, Human Computer Interaction (HCI)-based de-cision support tools design, web-site design, and Internet visual searches, to those related to marketing, science and medicine. Eye trackers that use high-resolution, high-speed video cameras to record eye movements and corneal reflections are cost-e↵ective tools for high-precision measurement of the size of the pupil, gaze locations and the time length of fixation. They consist of a video camera and infrared illuminators, positioned in front of an eye, used to track the movement of the eyes which are then mapped into real-world coordinates by camera cali-bration.
The gaze location and the time length of fixation obviously show which fea-tures of the image the user is looking at and can reveal, for example, which features attract “the eye”, which features are missed, and identify the point of
?We would like to thank all participants in the study. The work was supported by
visual fixation. However, since purely looking at an image feature does not neces-sarily mean that the feature attracted attention and caused the desired cognitive reaction, relating pupil dilation to cognition is a promising research direction. Numerous studies in psychology have demonstrated that changes in pupil dila-tion consistently occurs during the cognidila-tion process, including reading, visual search, and problem solving, as well as valence, arousal, pain, etc. (see [1]-[10]). Extracting useful information from raw pupil dilation signals is not a trivial task due to high measurement noise of the commercial camera-based eye trackers, distortion due to gaze angle [1], frequent eye blinking, e↵ects of illumination changes, irregular time delays in pupil response to stimuli, as well as the fact that pupil reaction is caused by di↵erent factors, which are hard to separate. In this paper, we designed a set of simple experiments based on a commercially available eye tracker, and use them to evaluate several statistical and signal processing tools for extracting useful information from pupil dilation signal when a user is presented with a sequence of coloured images. We demonstrate that mean, peak and variance are insufficient to capture the dynamics of pupil dilation change and propose frequency-based and wavelet-based analysis, for defining and extracting features that can be further used for clustering or pattern matching.
2
Background
Pupils respond to di↵erent stimuli, including pain, emotional reaction, mental workload, and arousal with a very uneven reaction time delay and intensity that depends on the intensity and type of stimuli. The reaction delay can range from 0.1sec (mainly in the case of pain) to 2-7 seconds for emotional stimuli [1]. For example, [2] investigated reaction to sound stimuli, and observed that only after 400ms the pupil starts to sharply dilate, reaching a peak 2-3sec after the stimuli. Beatty [3] concluded that pupil dilation is a good representation of the diffi-culty and amount of mental workload across tested subjects and cognitive tasks. For example, calculating 16⇥23 causes 10% larger pupil dilation than 7⇥8, or memorizing a 3-digit number and 7-digit number caused 0.1mm and 0.55mm of pupil dilation, respectively (see [1]).
Di↵erent measures, such as mean dilation, peak dilation, variance, as in [4], and response time, have been proposed to quantify pupil dilation as a response to cognitive tasks (see [1] and references therein). However, these measures are not very robust and often not informative enough.
[8] proposed a measure calledIndex of cognitive activity (ICA), that repre-sents the average number of “abrupt” changes in pupil size per second. This was estimated using wavelet decomposition, a technique that proved capable of filtering out the change of brightness e↵ect. Building on this work, Marshall [9] compared pupil dilation with other measures such as blink rates, fixation time, saccade distance and speed, during di↵erent tasks, such as driving a car and visual search, in order to identify the best combination of measures for assess-ing the cognitive state of a subject. This research has proposed a combination of seven “eye metrics”, left and right index, left and right blink, left and right movement, and divergence.
All these methods are either limited in conclusions they can make due to a restricted extracted feature space, or require additional measurands. Despite the fact that the pupil dilation signal has been studied for long (see [1] and references therein), there are still many unknowns w.r.t exploiting pupil dilation analysis for assessing multimedia experience, and appropriate signal processing and machine learning tools are needed to make the information extraction process fast and automated, to open the door for real-time visual feedback design mechanisms.
3
Methods
Experiments were designed to examine the gaze position and pupil responses to di↵erent, “neutral-content” images (indoors and outdoors) with and without searching for a specific target. The “neutral-content” images were selected as we want to examine pupil activity that is not a product of emotional triggering (pleasant/unpleasant), which is expected to create a more intense response. Ad-ditionally, we want to assess the e↵ect of “busy” indoor images versus less busy outdoor images.
The eye tracker used during all our experiments is the Tobii X2-60 Eye Tracker, which provides pupil dilation and gaze fixation data with a 60Hz sam-pling rate. Data collection and stimuli presentation were obtained using Ogama.
Experimental Setup Experiments were performed in a laboratory using mod-erate artificial light conditions, which were kept constant for the duration of all trials. Ten subjects who participated in the experiment ranged between 25 and 50 years old, both male and female, either with normal or corrected-to normal vi-sion. The subjects were sitting in front of a screen with a resolution of 1920x1080 pixels, at a ⇠70 cm distance (35 angle from the eye tracker). Calibration was performed using Ogama’s calibration process, where a coloured dot was moving in the corners and centre of the screen and the subjects were asked to gaze at the dot. This process was performed before each trial.
(a) Content Image 1 (b) Content Image 2
[image:4.612.152.446.97.242.2](c) Content Image 3 (d) Content Image 4
Fig. 1.Content images used as a stimuli during the experiments.1
For each subject, the experiment comprised three trials, which took place at the same time and place, with a gap of less than a minute between the two trials. During the first trial (Trial 1), the subjects were shown the stimuli presentation, and were asked to watch the presentation with no further instructions. After the end of the trial, the same stimuli was shown for the second time (Trial 2), with no further instructions. During the final trial (Trial 3), all subjects were requested verbally to locate the flower(s) in the images at the beginning of the trial, without doing any task when this occurred or without verbally suggesting that they had identified the target.
Preprocessing Pupil dilation and gaze data were cleaned during the prepro-cessing by removing all eye blink artifacts, as in [4, 6]. All missing data were replaced using data interpolation from both right and left pupil data using lin-ear interpolation. We perform three types of signal processing analysis on the processed data: (1) statistical analysis using dilation mean, variance, and peak; (2) frequency analysis; and (3) wavelet-based analysis.
Harmonic Analysis is performed using Welch Method [12] which is a com-monly used method for estimating thepower spectral density (PSD) of a signal in the presence of noise. It splits the data into overlapping segments, computes modified periodograms of the overlapping segments and then averages them in order to estimate the PSD and mitigate e↵ects of random noise. In the applied procedure, the signal is segmented into eight sections of equal length, each with 50% overlap. All remaining signal parts that cannot be included into these eight segments are discarded. Each segment is windowed with a Hamming window of the same length as the segment.
Wavelet-based Analysis After interpolation and prior to wavelet-based anal-ysis, to mitigate the e↵ect of random measurement noise, the pupil dilation signal was filtered by a 5th order low-pass Butterworth filter with a cuto↵frequency of
fc =4Hz, which was selected as in [4] and [6], since the pupil servomechanism’s break frequency is roughly 2Hz (see [6] and references therein).
After filtering, we performedDiscrete Wavelet Transform (DWT) decompo-sition of the signal and wavelet denoising using soft thresholding [11]. This is
1 Image 1 was taken from Billy Wilson under CC BY-NC 2.0, Image 2 and 4 from Kay
done by passing the signal through a low-pass and a high-pass filter, and then down-sampling the filtered signals in order to remove the over-completeness of the transform coefficients. Due to the properties of DWT, the energy of the transformed signal is concentrated in only few DWT coefficients that have high magnitudes, and the energy of the noise is spread across a large number of DWT coefficients that have low magnitudes. Wavelet Denoising by Soft Thresholding [11] can be applied to remove the remaining noise in the 0-4Hz band, by min-imizing mean square error (MSE) of the reconstructed signal compared to the original signal under the constraint that with high probability the reconstruction is at least as smooth as the original. This allows for the removal of undesirable noise ripples or oscillations that would not be removed with a simple MSE mini-mization. The idea of wavelet denoising by soft thresholding is to first decompose the noisy signal into N levels using a pyramidal wavelet filter, and then apply thresholding on the wavelet coefficients coordinate-wise with a specially selected threshold. All DWT coefficients whose absolute value is less than the predefined threshold are set to zeros and all remaining coefficients will have magnitude reduced by the applied threshold. In the proposed method, we use Minimax
thresholding and estimate the level of noise based on the first level coefficients.
Finally, the inverse transform is applied to recover the original signal. We note that a similar wavelet denoising procedure was used in [8] to evaluate the level of cognitive activity based on pupil dilation.
4
Results and Discussion
We separated the filtered pupil dilation signal into image segments and then con-catenated all content image segments and all grey image segments, forming in this way two signals: a signal carrying four content images and a signal carrying grey images. Fig. 2 shows the filtered pupil dilation signal for Subject 5 and 10 during all three trials for the content images. Each vertical line represents the temporal transition between images. These subjects were selected as a represen-tative example of all subjects. The pupil dilation range was around 1mm for both subjects and it dynamically changed during the experiments. From these graphs it is apparent that the dilation on average is higher during Trial 3, compared to the other two trials.
1 600 1200 1802 2402 2
2.2 2.4 2.6 2.8 3 3.2
Pupil Dilation (mm)
Sample Number
Trial 1 Trial 2 Trial 3
1 602 1202 1801 2402
2 2.2 2.4 2.6 2.8 3 3.2 3.4 3.5
Pupil Dilation (mm)
Sample Number
Trial 1 Trial 2 Trial 3
Fig. 2.Filtered Pupil Dilation for Subjects 5 and 10 respectively during all three trials
Table 1 shows the Mean values of pupil dilation when viewing the Content Images, after filtering. From Table 1, we can see that predominately the highest values (bold) of mean pupil dilation were during Trial 3, which is expected.
[image:6.612.134.465.90.181.2]In general though, mean, variance and number of peaks (not shown here due to space restrictions) rather irregularly change across the images and subjects, failing to capture signal transients. Thus, time averaging over the images do not, in this case, provide information that can be used to assess user’s attention and experience, since the signal transition information is lost.
Table 1.Mean of the Filtered Pupil Dilation Signal of the Content Images [in mm]. S
stands for Subject andBoldrepresents the highest mean value per image
Image1 Image 2 Image 3 Image 4
S Trial1 Trial2 Trial3 Trial1 Trial2 Trial3 Trial1 Trial2 Trial3 Trial1 Trial2 Trial3
1 2.180 2.1932.123 2.215 2.2362.213 2.135 2.227 2.3152.111 2.2582.246
2 2.5762.500 2.546 2.606 2.751 2.7952.479 2.583 2.7452.458 2.4812.417
3 3.104 3.2413.215 3.312 3.103 3.4293.091 2.991 3.097 3.0382.849 2.958
4 3.1092.631 2.749 3.1572.823 2.843 2.779 2.699 2.8082.642 2.644 2.703
5 2.550 2.520 2.7712.528 2.442 2.7652.477 2.428 2.6402.275 2.270 2.530
6 2.578 2.6892.673 2.645 2.665 2.8332.609 2.683 2.7812.499 2.6082.586
7 2.614 2.544 2.657 3.0232.653 2.872 2.6802.627 2.668 2.8302.612 2.542
8 3.4023.204 3.374 3.481 3.185 3.5003.209 3.050 3.350 3.2653.139 3.221
9 3.131 3.059 3.134 3.1863.159 3.032 2.929 3.029 3.1632.804 2.8292.707
10 2.757 2.873 2.9252.639 2.739 2.8282.770 2.743 2.8282.546 2.6902.653
Harmonic Analysis Next, we performed harmonic analysis by estimating the PSD of the signal in the range of interest (0-2Hz) using the Welch method de-scribed above. We separately estimated PSD for each grey image and each con-tent image. The results for all concon-tent images are shown in Table 2. Frequency analysis shows the distribution of the power indicating in which frequency sub-band most of signal’s energy is concentrated. It could potentially indicate in-creased mental activity, if small enough time windows are applied. This can be seen from Table 2 as on average Trial 3 shows increased power values per im-age, when compared with other trials. For example, Subject 5 in Image 1 shows 564.4W, which is higher compared to 477.6W and 468.5W for Trials 1 and 2, respectively. This pattern is similar to the case of mean values in Table 1 and generally power values are higher for Trial 3 when the subjects were asked to perform a target search task. This is mostly pronounced for Image 3 where all subjects show higher energy at Trial 3 (see bold values in Table 2). As frequency analysis loses time information and makes it difficult to conclude which time stimuli caused the reaction, we propose next wavelet-based analysis.
0 500
1000 1500
0 500 1000
0 200 400 600
Gaze Position X (a) 3D Gaze Position for Subject 5
Gaze Position Y
Sample Number (Time)
Image 1 Image 2 Image 3 Image 4
(b) Gaze Position Image 1
Subject 5 Subject 10
(c) Gaze Position Image 2
Subject 5 Subject 10
0 500
1000 1500
0 500 1000
0 200 400 600
Gaze Position X (d) 3D Gaze Position for Subject 10
Gaze Position Y
Sample Number (Time)
Image 1 Image 2 Image 3 Image 4
(e) Gaze Position Image 3
Subject 5 Subject 10
(f) Gaze Position Image 4
Subject 5 Subject 6
Fig. 3. Gaze Position for Subject 5 and 10 for all images (3D) during Trial 3, and
[image:7.612.140.475.108.242.2]individually per content image.
Table 2.Signal Power in the 0-2Hz Band in [W] per content image.Boldrepresents
the highest power per image.
Image1 Image 2 Image 3 Image 4
S Trial1 Trial2 Trial3 Trial1 Trial2 Trial3 Trial1 Trial2 Trial3 Trial1 Trial2 Trial3
1 348.8 355.4335.1 362.2 367.7359.5 336.4 365.5 392.2329.8 373.2373.2
2 490.2 461.8 506.9502.6 557.4520.4 451.1 490.2 491.1447.0 451.9428.9
3 707.9 772.9763.1 802.5 708.6 863.1701.6 663.8 703.2 677.3596.9 642.6
4 710.8510.2 554.5 731.0585.7 592.4 567.6 538.0 580.0512.7 516.2 538.9
5 477.6 468.5 564.4470.0 436.5 559.0451.8 432.9 512.6379.1 379.8 470.9
6 490.2 530.6523.5 513.5 521.3 585.3500.6 529.3 567.0458.0 498.6491.9
7 502.2 476.9 523.2 672.6516.4 602.9 528.8 507.2 531.7 620.3502.1 474.5
8 855.8756.3 852.0 891.8 749.3 910.0757.0 687.1 823.2 782.6721.4 771.4
9 726.8695.3 722.2 746.2742.2 676.3 636.3 678.7 736.3579.8 590.6540.5
10 561.0 605.3 624.4517.0 551.2 588.4567.6 554.4 587.6477.4 539.6519.6
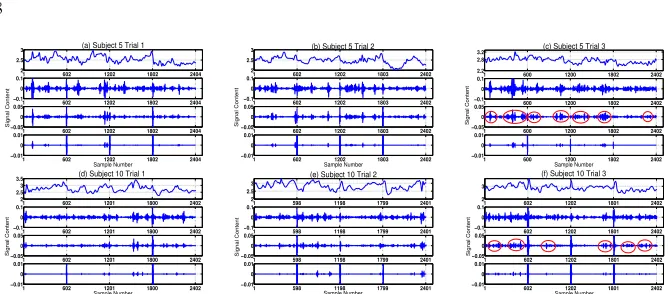
Horizontal axis again shows the sample number with vertical lines pointing to the image transition moments; vertical axis denotes the right eye pupil dilation in mm. We used Daubechies-4 wavelet filter which is one of the most popular orthogonal wavelet filter with fast wavelet transform. In contrast to the Fourier analysis, DWT can tradeo↵ frequency and time resolution allowing for detec-tion of time interval when specific frequency component occurred. We used a 4-level wavelet decomposition, decomposing the signal into 4 frequency bands, to maintain high frequency resolution. The areas around the image transitions should be ignored as they are caused by signal stitching. We can clearly observe increased activity in the band of interest. Trial 3 is characterised by significant pupil dilation activity in the beginning (until the task is solved, bearing in mind delayed reaction) and then reduction, while the other two trials have more evenly spread activity. Trial 1 has evidently more activity than Trial 2, since new con-tent was presented in Trial 1. This activity has been marked for both subjects in Figs. 4(c) and (f) with red circles, where activity is more clear. In Trial 3, the pupil dilation activity indicates that Image 2 was most challenging, which is true since the flower position is not so obvious.
1 602 1202 1802 2404 2
2.5
3 (a) Subject 5 Trial 1
1 602 1202 1802 2404
−0.1 0 0.1
1 602 1202 1802 2404
−0.05 0 0.05
1 602 1202 1802 2404
−0.01 0 0.01
Sample Number
Signal Content
1 602 1202 1803 2402
2 2.5
3 (b) Subject 5 Trial 2
1 602 1202 1803 2402
−0.1 0 0.1
Signal Content
1 602 1202 1803 2402
−0.05 0 0.05
1 602 1202 1803 2402
−0.01 0 0.01
Sample Number
1 600 1200 1802 2402 2.2
2.8
3.2 (c) Subject 5 Trial 3
1 600 1200 1802 2402
−0.1 0 0.1
Signal Content
1 600 1200 1802 2402
−0.05 0 0.05
1 600 1200 1802 2402
−0.01 0 0.01
Sample Number
1 602 1201 1800 2402 2
2.5 3
3.5 (d) Subject 10 Trial 1
1 602 1201 1800 2402
−0.1 0 0.1
1 602 1201 1800 2402
−0.05 0 0.05
Signal Content
1 602 1201 1800 2402
−0.01 0 0.01
Sample Number
1 598 1198 1799 2401
2 2.5 3
(e) Subject 10 Trial 2
1 598 1198 1799 2401
−0.1 0 0.1
1 598 1198 1799 2401
−0.05 0 0.05
Signal Content
1 598 1198 1799 2401
−0.01 0 0.01
Sample Number
1 602 1202 1801 2402
2 3
(f) Subject 10 Trial 3
1 602 1202 1801 2402
−0.1 0 0.1
1 602 1202 1801 2402
−0.05 0 0.05
Signal Content
1 602 1202 1801 2402
−0.01 0 0.01
[image:8.612.138.473.93.240.2]Sample Number
Fig. 4.Wavelet Analysis of Content Images for Subject 5 and 10 for all three trials.
Our main goal was to review and test di↵erent methods, in order to evaluate their future use for feature definition and extraction for autonomous pattern matching and event detection. As in [8], our findings show that clearly wavelets provide a clearer view of activity on pupil dilation and can be essentially used as a helping tool for extracting signatures from the pupil dilation signal in order to relate each segment to image information/task for automated pattern match-ing. In addition to the wavelets, mean, variance, and power spectral density using Welch method, can be used in order to provide a more accurate activity recognition process.
References
1. J. Y.-Y. Wang, “Pupil dilation and eye-tracking,” inA Handbook of Process Tracing
Methods for Decision Research: A Critical Review and User’s Guide M. Schulte-Mecklenbeck, A. Kuhberger, Rob Ranyard (Eds.), Psychology Press, (2010). 2. Partala, T., Surakka, V.: Pupil size variation as an indication of a↵ective processing.
International journal of human-computer studies, 59 (1), 185–198 (2003)
3. Beatty, J.: Task-Evoked Pupillary Responses, Processing 19, and the Structure of Processing Resources. Psychological Bulletin, 91(2), 276–292 (1982)
4. Privitera, C. M., Renninger, L. W, Carney T., Klein S., Aguilar, M.: The pupil dilation response to visual detection,Human Vision and Electronic Imaging (2008) 5. Oliveira, F. T. P., Aula, A., Russell, D. M.: Discriminating the relevance of web
search results with measures of pupil size. Proc. 27th ACM CHI’2009
6. Privitera, C. M., Renninger, L. W,Carney T., Klein S., Aguilar, M.: Pupil dilation during visual target detection. Journal of Vision, 10(10):3 (2010)
7. Hossain, G.,Yeasin, M.: Understanding E↵ects of Cognitive Load from Pupillary Responses Using Hilbert Analytic Phase, CVPRW’14, pp.381–386 (2014)
8. Marshall, S.P.: Method and apparatus for eye tracking and monitoring pupil dilation to evaluate cognitive activity. Google Patents, US6090051 (2000)
9. Marshall, S. P.: Identifying cognitive state from eye metrics. Aviation, Space, En-vironmental Medicine, 78(5), 165–175 (2007)
10. Klingner, J., Kumar, R., Hanrahan, P.: “Measuring the task-evoked pupillary re-sponse with a remote eye tracker.” Proc. ETRA’08.
11. Donoho, D. L.: Denoising by soft-thresolding. IEEE Transactions on Information Theory, vol. 41, 613–627, (3), (1995)

![Table 1. Mean of the Filtered Pupil Dilation Signal of the Content Images [in mm]. Sstands for Subject and Bold represents the highest mean value per image](https://thumb-us.123doks.com/thumbv2/123dok_us/1586008.111256/6.612.134.465.90.181/filtered-dilation-signal-content-images-sstands-subject-represents.webp)
![Table 2. Signal Power in the 0-2Hz Band in [W] per content image. Bold representsthe highest power per image.](https://thumb-us.123doks.com/thumbv2/123dok_us/1586008.111256/7.612.140.475.108.242/table-signal-power-band-content-image-representsthe-highest.webp)